Báo cáo y học: "Transpulmonary thermodilution-derived cardiac function index identifies cardiac dysfunction in acute heart failure and septic patients: an observational study" pptx
Bạn đang xem bản rút gọn của tài liệu. Xem và tải ngay bản đầy đủ của tài liệu tại đây (753.38 KB, 10 trang )
Open Access
Available online />Page 1 of 10
(page number not for citation purposes)
Vol 13 No 4
Research
Transpulmonary thermodilution-derived cardiac function index
identifies cardiac dysfunction in acute heart failure and septic
patients: an observational study
Simon Ritter
1
, Alain Rudiger
2
and Marco Maggiorini
2
1
Intensive Care Unit, Department of Internal Medicine, Triemli City Hospital, Birmensdorferstrasse 497, CH-8063 Zurich, Switzerland
2
Intensive Care Unit, Department of Internal Medicine, University Hospital Zurich, Raemistrasse 100, CH-8091 Zurich, Switzerland
Corresponding author: Alain Rudiger,
Received: 5 May 2009 Revisions requested: 4 Jun 2009 Revisions received: 6 Jul 2009 Accepted: 11 Aug 2009 Published: 11 Aug 2009
Critical Care 2009, 13:R133 (doi:10.1186/cc7994)
This article is online at: />© 2009 Ritter et al.; licensee BioMed Central Ltd.
This is an open access article distributed under the terms of the Creative Commons Attribution License ( />),
which permits unrestricted use, distribution, and reproduction in any medium, provided the original work is properly cited.
Abstract
Introduction There is limited clinical experience with the single-
indicator transpulmonary thermodilution (pulse contour cardiac
output, or PiCCO) technique in critically ill medical patients,
particularly in those with acute heart failure (AHF). Therefore, we
compared the cardiac function of patients with AHF or sepsis
using the pulmonary artery catheter (PAC) and the PiCCO
technology.
Methods This retrospective observational study was conducted
in the medical intensive care unit of a university hospital. Twelve
patients with AHF and nine patients with severe sepsis or septic
shock had four simultaneous hemodynamic measurements by
PAC and PiCCO during a 24-hour observation period.
Comparisons between groups were made with the use of the
Mann-Whitney U test. Including all measurements, correlations
between data pairs were established using linear regression
analysis and are expressed as the square of Pearson's
correlation coefficients (r
2
).
Results Compared to septic patients, AHF patients had a
significantly lower cardiac index, cardiac function index (CFI),
global ejection fraction, mixed venous oxygen saturation
(SmvO
2
) and pulmonary vascular permeability index, but higher
pulmonary artery occlusion pressure. All patients with a CFI less
than 4.5 per minute had an SmvO
2
not greater than 70%. In both
groups, the CFI correlated with the left ventricular stroke work
index (sepsis: r
2
= 0.30, P < 0.05; AHF: r
2
= 0.23, P < 0.05) and
cardiac power (sepsis: r
2
= 0.39, P < 0.05; AHF: r
2
= 0.45, P <
0.05).
Conclusions In critically ill medical patients, assessment of
cardiac function using transpulmonary thermodilution technique
is an alternative to the PAC. A low CFI identifies cardiac
dysfunction in both AHF and septic patients.
Introduction
Several studies have suggested that there is no clear benefit,
or that there may even be harm, in using a pulmonary artery
catheter (PAC) in critically ill patients [1-4]. As a result, the use
of PAC decreased substantially over the last decade [5]. How-
ever, PAC is still recommended for the hemodynamic monitor-
ing of critically ill patients with heart failure [6] because it
allows the assessment of the pulmonary artery occlusion pres-
sure (PAOP), which may provide information on left ventricular
function [7]. As an alternative to the more invasive PAC, the
use of the transpulmonary thermodilution method (pulse con-
tour cardiac output, or PiCCO) has been suggested [8]. The
PiCCO monitor measures cardiac output (CO) and the global
end-diastolic volume indexed for body surface area (GEDVI)
as well as parameters of cardiac performance such as the car-
diac function index (CFI) and the global ejection fraction
AHF: acute heart failure; ALI/ARDS: acute lung injury/acute respiratory distress syndrome; CFI: cardiac function index; CI: cardiac output indexed for
body surface area; CO: cardiac output; CP: cardiac power; DSt: exponential downslope time; ELWI: extravascular lung water indexed for predicted
body weight; EVLW: extravascular lung water; GEDV: global end-diastolic volume; GEDVI: global end-diastolic volume indexed for body surface area;
GEF: global ejection fraction; ICU: intensive care unit; IQR: interquartile range; ITTV: intrathoracic thermal volume; LVSWI: left ventricular stroke work
index; MAP: mean arterial pressure; MTt: mean transit time; PAC: pulmonary artery catheter; PAOP: pulmonary artery occlusion pressure; PiCCO:
pulse contour cardiac output; PTV: pulmonary thermal volume; PVPI: pulmonary vascular permeability index; SmvO
2
: mixed venous oxygen saturation;
SV: stroke volume; SVI: stroke volume indexed for body surface area.
Critical Care Vol 13 No 4 Ritter et al.
Page 2 of 10
(page number not for citation purposes)
(GEF). It also provides an estimate of extravascular lung water
(EVLW) and calculates the pulmonary vascular permeability
index (PVPI) [9-11], which allows the differentiation between
a hydrostatic and a permeability type of pulmonary edema
[12,13]. Volumetric parameters better estimate preload than
central venous pressure or PAOP [8,10,11,14], and EVLW
monitoring is of prognostic relevance [15-18]. A recent study
suggested that guiding fluid and catecholamine therapy by an
algorithm based on GEDVI and EVLW reduces postoperative
vasopressor and catecholamine requirements in cardiac sur-
gery patients [19].
The PiCCO method has been validated mainly in surgical
patients and, to a lesser extent, in patients with sepsis [14,20-
22]. However, there is still limited clinical experience with
PiCCO-derived parameters of cardiac function and volume
status in critically ill medical patients, particularly in those with
acute heart failure (AHF) [8]. Therefore, we retrospectively
analysed a series of simultaneous measurements by PiCCO
and PAC in patients with AHF, severe sepsis, or septic shock.
Materials and methods
Study design
The study was performed at the 12-bed medical intensive care
unit (ICU) of the University Hospital Zurich, Switzerland.
Approval was given by our Institutional Review Board. Due to
the retrospective nature of the analysis, the need for informed
consent was waived. Twenty-one patients (15 males and 6
females) with circulatory failure monitored with a PAC were
included in the study. Treatment was directed by the clinicians
in charge of the patients. In 17 patients (81%), PAC was
inserted within 1 day after ICU admission. After initial hemody-
namic stabilisation but before removal of the PAC, the arterial
line was switched to a PiCCO catheter in order to have less
invasive continuous monitoring of CO for vasopressor wean-
ing and fluid management. This provided a unique opportunity
of simultaneous monitoring with the two methods during a 24-
hour period. During this period, the dosage of vasoactive
drugs was progressively decreased and volume was substi-
tuted or removed according to the clinical treatment strategy.
Simultaneous recordings started 2 days (interquartile range
[IQR] 1 to 4 days) after ICU admission. In each patient, four
consecutive measurements were performed before PAC
removal. Median (IQR) time intervals from baseline to the sec-
ond and third measurements were 5 (4 to 8) and 13 (9 to 16)
hours, respectively. All four measurements were realised after
19 (14 to 22) hours. A total of 84 simultaneous hemodynamic
measurements were recorded and finally analysed.
Patient characteristics
Severe sepsis was defined according to the published guide-
lines as systemic inflammatory response syndrome with infec-
tion associated with organ dysfunction [23]. AHF was
diagnosed in the presence of an underlying heart disease and
congestive heart failure, pulmonary edema, or cardiogenic
shock [6]. Diagnosis of AHF was based on clinical signs of
congestion (dyspnea, orthopnea, rales, or elevated jugular
venous pressure), low CO with organ hypoperfusion, and bilat-
eral alveolar consolidations on chest x-ray. Echocardiography
and coronary angiography were performed only when clinically
indicated. The severity of illness was described by the Simpli-
fied Acute Physiology Score (SAPS II) as calculated with the
worst values within 24 hours following ICU admission [24].
AHF and severe sepsis or septic shock were diagnosed in 12
and 9 patients, respectively. Baseline characteristics on ICU
admission are shown in Table 1. Coronary heart disease was
present in 7 patients with AHF. Other underlying heart dis-
eases included dilatative cardiomyopathy (n = 2), non-com-
paction cardiomyopathy (n = 1), valvular heart disease (n = 1),
and congenital heart disease (n = 1). Cardiac imaging by
echocardiography or coronary angiography or both was avail-
able in all heart failure patients except in two with known
ischemic heart disease. The septic patients suffered from
proven bacterial infection, namely pneumonia (n = 6), abdom-
inal infection (n = 1), urogenital tract infection (n = 1), and
puerperal sepsis (n = 1). Twelve patients (57%) required nore-
pinephrine (0.1 to 0.3 μg/kg per minute), 13 patients (62%)
needed inotropic support with dobutamine (1.5 to 6 μg/kg per
minute), milrinone, or levosimendan, and 6 patients (29%)
received intravenous vasodilatators such as nitroglycerin or
nesiritide. Furthermore, 16 patients (76%) were mechanically
ventilated, and 11 patients (52%) had renal replacement ther-
apy by continuous veno-venous hemofiltration.
Hemodynamic measurements
A continuous CO thermodilution PAC (model VIP 139F75;
Edwards Lifesciences LLC, Irvine, CA, USA) was inserted via
a central vein into the right pulmonary artery. Correct place-
ment of the catheter was checked by appropriate pressure
traces and fluoroscopy. The PAC was used for measurements
of pulmonary artery pressure, PAOP, and cardiac index. Spe-
cial care was taken to define the zero reference at midchest
level and to perform measurements at end-expiration. Contin-
uous assessment of CO was measured using the modified
thermodilution technique provided by the PAC manufacturer
and described elsewhere [25,26].
A thermister-tipped arterial PiCCO catheter (Pulsiocath 5F,
20 cm, PV2015L20; Pulsion Medical Systems AG, Munich,
Germany) was placed in the descending aorta and connected
to a bedside PiCCO plus monitor. Cardiac index and volumet-
ric variables were measured with the single-indicator transpul-
monary thermodilution technique. The PiCCO values were
obtained by repeated injections of 15- or 20-mL boluses of
ice-cold normal saline via a central line. The mean value of
three consecutive measurements was used for analysis. If the
difference between the three obtained values for cardiac index
was greater than 10%, two additional measurements were
Available online />Page 3 of 10
(page number not for citation purposes)
performed subsequently. Finally, the mean of all consecutive
measurements was used.
By means of the thermodilution curve, the PiCCO calculates
CO by the modified Stewart-Hamilton equation, the mean
transit time (MTt), and the exponential downslope time (DSt)
of the curve. The product of CO times MTt gives the intratho-
racic thermal volume (ITTV) [12,27]. The product of CO times
the DSt gives the pulmonary thermal volume (PTV) [12,28,29].
The difference between ITTV and PTV is called global end-
diastolic volume (GEDV), or GEDVI if indexed for the body sur-
face area.
Stroke volume (SV) is calculated by dividing CO by heart rate.
A 'global' ejection fraction (GEF) can be obtained by dividing
SV by a quarter of GEDV. Similarly, dividing CO by the preload
parameter GEDV gives an indicator of cardiac systolic func-
tion, the so-called CFI. Both GEF and CFI may provide infor-
mation on left ventricular systolic function [30]. In patients with
shock and multi-organ failure, GEF and CFI correlated closely
with left ventricular fractional area of change using echocardi-
ography [30].
The PiCCO method and definitions of intrathoracic blood vol-
ume and EVLW are described in more detail elsewhere [31].
For this study, EVLW was indexed to predicted body weight
(ELWI), as proposed by Phillips and colleagues [16].
The ratio of EVLW to pulmonary blood volume is used as an
index of pulmonary vascular permeability (PVPI). Additionally,
we calculated the ratio of EVLW indexed for body weight to
GEDVI (that is, ELWI/GEDVI × 10
2
) as another index of pul-
monary vascular permeability [13].
In addition to mean arterial pressure (MAP), heart rate, contin-
uous CO, and right atrial pressure, the following hemodynamic
parameters were simultaneously recorded four times in each
patient: cardiac index by both methods, mixed venous oxygen
saturation (SmvO
2
), left ventricular stroke work index (LVSWI),
PAOP, GEDVI, CFI, GEF, ELWI, and PVPI. For each record-
ing, all variables were determined within 10 minutes. LVSWI
was calculated by the formula SVI × (MAP – PAOP) × 0.0136,
where SVI denotes SV index (SV divided by body surface
area). For comparison purposes, we also calculated cardiac
power (CP) using the formula CP = MAP × CO/451. The CP
has been described as a valuable marker of outcome in
patients with cardiogenic shock [32-34]. Definitions are pro-
vided in Table 2.
Statistical analysis
Clinical data were collected from the patients' charts, ano-
nymised, and entered into a computerised database. Medians,
25th–75th percentiles (IQR), or percentages were calculated
for the overall sample and subgroups. Comparisons between
groups were made with the use of the Mann-Whitney U test or
the Fisher exact test, as appropriate. Repeated measures
within groups were compared with a Wilcoxon signed rank
sum test. Including all consecutive hemodynamic measure-
ments per patient, correlations between data pairs were
established using linear regression analysis and are expressed
Table 1
Baseline characteristics of patients on admission to the intensive care unit
Sepsis
n = 9
Acute heart failure
n = 12
P value
Gender, male/female 5/4 10/2 0.33
Age, years 52 (37–65) 65 (55–71) 0.15
Body mass index, kg/m
2
23.4 (20.4–25.5) 25.0 (23.3–29.7) 0.19
SAPS II 49 (41–63) 35 (27–65) 0.19
PaO
2
/FiO
2
ratio, mm Hg 165 (115–206) 254 (210–377) 0.004
ProBNP, ng/L 13,104 (6,964–27,225) 13,822 (7,692–23,885) 0.92
Troponin T, μg/L 0.03 (0.01–0.40) 0.11 (0.03–2.57) 0.42
Creatinine, μmol/L 129 (97–215) 138 (114–191) 0.65
White blood cell count, per mm
3
12.5 (9.7–18.8) 9.5 (7.3–12.6) 0.19
CRP, mg/L 244 (85–334) 28 (7–150) 0.006
PCT, ng/mL 18.0 (2.5–34.4) 0.3 (0.2–1.3) 0.001
LVEF
a
, percentage 60 (50–65) 28 (19–43) 0.005
Data are presented as numbers or medians (interquartile ranges). Creatinine, norm 70 to 105 μmol/L. Troponin T, norm <0.10 μg/L.
a
Echocardiography was performed in seven patients with sepsis and in nine patients with acute heart failure. CRP: C-reactive protein (norm <5
mg/L); FiO
2
: inspired oxygen fraction; LVEF: left ventricular ejection fraction; PaO
2
: partial arterial oxygen pressure; PCT: procalcitonin (norm <0.5
ng/mL); ProBNP: N-terminal pro-B-type natriuretic peptide (norm <227 ng/L); SAPS II: Simplified Acute Physiology Score II.
Critical Care Vol 13 No 4 Ritter et al.
Page 4 of 10
(page number not for citation purposes)
as the square of Pearson's correlation coefficients (r
2
). To
investigate the relationship between the cardiac index meas-
ured by PAC and PiCCO, bias and limits of agreement of data
pairs were calculated as described by Bland and Altman [35].
Bias represents the systemic error between the two methods.
Upper and lower limits of agreement, calculated as mean bias
± two standard deviations, define the range in which 95% of
the differences are expected. The percentage error was calcu-
lated as 100 × (CO indexed for body surface area [CI] by
PiCCO - CI by PAC)/[(CI by PiCCO + CI by PAC)/2], as pro-
posed by Rödig and colleagues [36]. All analyses were per-
formed using SPSS version 12.0 for Windows (SPSS Inc.,
Chicago, IL, USA). Statistical significance was defined as P
values of below 0.05, and all hypothesis testing was two-
tailed.
Results
The clinical characteristics of the two study groups are
described above. Net fluid balance during the 24-hour obser-
vation period was +2,066 (375 to 2,749) mL in septic patients
as compared with +60 (-596 to 1,622) mL in patients with
AHF (P = 0.11). ICU lengths of stay were 17 (14 to 30) days
in septic patients and 12 (5 to 19) days in AHF patients (P =
0.13). Overall ICU mortality rates were 44% (4/9) among
patients with sepsis and 25% (3/12) among those with AHF
(P = 0.40).
Hemodynamic measurements
Measurement of PAOP was unavailable in two AHF patients,
and the SmvO
2
was missing in another AHF patient. Hemody-
namic measurements obtained at the first and fourth record-
ings are shown in Table 3. Between the first and the forth
measurements, hemodynamic variables remained nearly
unchanged. Exceptions were LVSWI (increase in septic
patients), PAOP and GEDVI (decrease in AHF patients), and
SmvO
2
(increase in AHF patients). According to the mild
changes during the observation period, we pooled the results
within each group for further correlation purposes (Table 4). In
comparison with patients with AHF, those with sepsis had
higher cardiac index, CP, LVSWI, SmvO
2
, CFI, GEF, PVPI,
and ELWI/GEDVI ratio but a lower PAOP. ELWI was higher in
patients with sepsis, but this trend did not reach statistical sig-
nificance (P = 0.09).
A Bland-Altman analysis of cardiac index measurements by
PiCCO and PAC resulted in a mean bias of 0.19 L/minute per
square metre. Limits of agreement were -0.97 and 1.35 L/
minute per square metre. The median percentage error of
comparisons was 2.5%. It was within 15% for 68% of compar-
isons between CI by PiCCO and CI by PAC. In septic patients,
r
2
between the two cardiac indexes was 0.81 (P < 0.001)
compared with 0.58 in patients with AHF (P < 0.001).
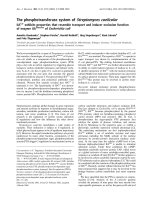
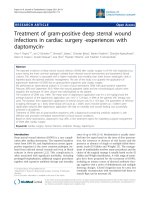
Comparisons between CFI and other markers of cardiac per-
formance (CP and LVSWI) are displayed in Figure 1. Figure 1
demonstrates the significant correlation between CFI and
LVSWI (sepsis: r
2
= 0.30, P = 0.001; AHF: r
2
= 0.23, p =
0.002) as well as CFI and CP (sepsis: r
2
= 0.39, P < 0.001;
AHF: r
2
= 0.45, P < 0.001) in both patient groups. In Figures
1a and 1b, the CFI values of four septic patients with
depressed cardiac function can easily be identified. The corre-
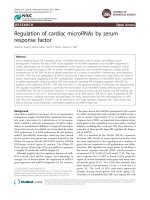
lations between GEF and LVSWI (sepsis: r
2
= 0.26, P =
0.001; AHF: r
2
= 0.18, P = 0.006) plus GEF and CP (sepsis:
r
2
= 0.22, P = 0.004; AHF: r
2
= 0.13, P = 0.01), as shown in
Figure 2, were comparable to the corresponding CFI correla-
tions in Figure 1. The overall correlation between CFI and GEF
was r
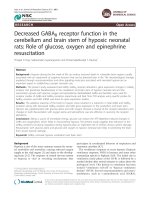
2
= 0.81 (P < 0.001). Figure 3 shows the relationships
between CFI and PAOP and between CFI and SmvO
2
. It dem-
onstrates the significant negative correlation between CFI and
PAOP (r
2
= -0.18, P = 0.006) in AHF patients but not in
patients with sepsis (P = 0.89). On the other hand, CFI was
significantly correlated with SmvO
2
in septic patients (r
2
=
0.22, P = 0.004) but not in those with heart failure (P = 0.26).
All AHF patients had an SmvO
2
of not more than 70% and a
CFI of less than 4.5 per minute, except one suffering from con-
genital heart disease, who presented with low central venous
oxygen saturation and shock. In this patient (classified as AHF
because of her history), PAC showed a CI of 3.6 L/minute per
square metre and an SmvO
2
of 68%. PiCCO revealed a CFI
of at least 4.5 per minute in two of four measurements and a
GEF of greater than 20% in all four measurements.
All septic patients with cardiac dysfunction (CFI of less than
4.5 per minute) had an SmvO
2
of not more than 70%. Among
Table 2
Definitions
LVSWI = SVI × (MAP – PAOP) × 0.0136
CP = MAP × CO/451
ITTV = CO × MTt
PTV = CO × DSt
GEDV = ITTV - PTV = CO × (MTt - DSt)
ITBV = 1.25 × GEDV
CFI = (CO/GEDV) × 10
3
GEF = SV/(GEDV/4)
EVLW = ITTV - ITBV
PVPI = EVLW/PBV
The detailed pathophysiological background is explained in Materials
and methods. CFI: cardiac function index; CO: cardiac output; CP:
cardiac power; DSt: exponential downslope time; EVLW:
extravascular lung water; GEDV: global end-diastolic volume; GEF:
global ejection fraction; ITBV: intrathoracic blood volume; ITTV:
intrathoracic thermal volume; LVSWI: left ventricular stroke work
index; MAP: mean arterial pressure; MTt: mean transit time; PAOP:
pulmonary artery occlusion pressure; PBV: pulmonary blood volume;
PTV: pulmonary thermal volume; PVPI: pulmonary vascular
permeability index; SV: stroke volume; SVI: stroke volume indexed for
body surface area.
Available online />Page 5 of 10
(page number not for citation purposes)
those with a CFI of at least 4.5 per minute, 1 patient had four
SmvO
2
values of less than 70%, most likely because of hypo-
volemia. The remaining four points of less than 70% (2
patients) were associated with an arterial oxygen saturation of
below 92% (Figure 3b).
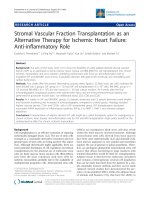
PAOP did not correlate with ELWI and PVPI either in septic or
in heart failure patients (Figure 4). Five of 12 patients with AHF
and 6 of 9 with sepsis had at least one PVPI value of greater
than 3.0, indicating that PVPI may not discriminate between
heart failure and sepsis. No correlations were found between
PAOP and GEDVI (data not shown).
Discussion
The results of the present study indicate that in patients with
AHF and severe sepsis or septic shock the PiCCO-derived
cardiac function parameters, namely CFI and GEF, are valua-
ble and comparable to the more classic PAC-derived parame-
ters such as CP and LVSWI and are better than PAOP and
SmvO
2
. In patients with sepsis, the PVPI and the ratio of ELWI
to GEDVI were only slightly higher than in those with AHF,
which suggests an increased pulmonary vascular permeability
in the latter group. Elevated ELWI despite a relatively low
PAOP for patients with AHF supports this assumption.
Table 3
Comparing the first and the fourth hemodynamic measurements in patients with sepsis and acute heart failure
Sepsis Acute heart failure
1st measurement 4th measurement 1st measurement 4th measurement
n = 9 n = 9 n = 12 n = 12
Basic monitoring
Heart rate, 1/minute 83 (80–96) 90 (78–108) 87 (72–97) 85 (75–95)
MAP, mm Hg 75 (65–81) 77 (69–86) 74 (70–78) 66 (58–75)
a, b
RAP, mm Hg 13 (9.0–17) 12 (10–15) 13 (9.5–15) 11 (8.3–15)
SaO
2
, percentage 94 (91–96) 94 (93–97) 95 (94–96) 94 (93–97)
PAC
CI, L/minute per m
2
3.8 (3.1–4.3) 4.8 (3.7–6.2) 2.6 (1.9–3.1)
a
2.8 (2.3–3.1)
a
CP, W 1.00 (0.88–1.32) 1.33 (1.04–1.87) 0.71 (0.59–0.95) 0.80 (0.65–0.93)
a
LVSWI, g-m/m
2
32 (23–45) 42 (34–54)
b
20 (17–25)
a, c
18 (17–29)
a, c
MPAP, mm Hg 31 (30–32) 27 (27–31) 32 (27–37) 31 (22–35)
PAOP, mm Hg 18 (15–21) 17 (14–18) 21 (17–26)
c
19 (12–20)
b, c
SmvO
2
, percentage 68 (61–74) 70 (60–75) 50 (48–62)
a, d
59 (52–64)
a, b, d
PiCCO
CI, L/minute per m
2
3.6 (3.5–5.6) 4.8 (3.8–5.4) 2.9 (1.8–3.8)
a
2.9 (2.2–3.3)
a
CFI, 1/minute 6.0 (3.3–6.8) 6.4 (3.5–8.0) 2.7 (2.2–2.9)
a
2.7 (2.4–3.6)
a
GEF, percentage 21 (15–30) 25 (16–34) 13 (9.8–14)
a
14 (12–17)
a
GEDVI, mL/m
2
857 (703–1,128) 797 (660–1,164) 1,141 (893–1,311)
a
904 (796–1,144)
b
ELWI, mL/kg 18.2 (14.7–24.0) 15.3 (12.4–20.2) 15.4 (13.7–22.4) 15.7 (14.0–19.2)
PVPI 2.6 (2.2–4.1) 3.0 (1.9–3.4) 2.8 (2.0–3.8) 2.5 (1.9–2.8)
ELWI/GEDVI, × 10
2
2.0 (1.6–2.7) 2.1 (1.4–2.3) 1.6 (1.2–2.4) 1.9 (1.4–2.2)
The results are presented as medians (interquartile ranges).
a
P < 0.05 between the two groups for a given time point;
b
P < 0.05 for changes
between the two time points within a group. Reduced numbers because of missing data are indicated by superscript c (
c
), where n = 10, and
superscript d (
d
), where n = 11. CFI: cardiac function index; CI: cardiac index; CP: cardiac power; ELWI: extravascular lung water index; GEDVI:
global end-diastolic volume index; GEF: global ejection fraction; LVSWI: left ventricular stroke work index; MAP: mean arterial pressure; MPAP:
mean pulmonary arterial pressure; PAC: pulmonary artery catheter; PAOP: pulmonary artery occlusion pressure; PiCCO: transpulmonary
thermodilution technique; PVPI: pulmonary vascular permeability index; RAP: right atrial pressure; SaO
2
: arterial oxygen saturation; SmvO
2
: mixed
venous oxygen saturation.
Critical Care Vol 13 No 4 Ritter et al.
Page 6 of 10
(page number not for citation purposes)
Our results confirm that PiCCO-derived CO measurements
parallel values obtained by PAC [20,37,38]. In addition to pre-
vious reports from surgical and septic patients, our data prove
that this is also the case for critically ill medical patients pre-
senting with AHF and a low CO. The systemic error (bias) of
CO measurements between PiCCO and PAC was considera-
bly lower in our medical ICU population. As previously
reported, CO is usually slightly overestimated when measured
in the aorta compared with the pulmonary artery [20,39].
SmvO
2
is considered a surrogate marker of CO in several con-
ditions [40]. In our study, we found that SmvO
2
correlated with
CFI in patients with sepsis but not in those with AHF. All
patients presenting with AHF had an SmvO
2
of below 70%.
Among the septic patients with a CFI of greater than 4.5 per
minute, three had SmvO
2
measurements of below 70%. This
observation is in line with the hypothesis that SmvO
2
has a low
sensitivity and specificity for the detection of myocardial dys-
function in patients with distributive shock [41-43]. Our results
favour CO measurements over SmvO
2
assessments for the
monitoring of cardiac performance in septic patients.
PAC-derived LVSWI and particularly CP, the product of CO
and MAP, are predictors of outcome in cardiogenic shock
patients [32-34]. In our study, we found a good correlation
between CFI and both LVSWI and CP, independently of
whether patients had sepsis or AHF. Of note, the median left
ventricular ejection fractions were below 30% in heart failure
patients and normal in septic patients. The PiCCO parameters
CFI and GEF have previously been shown to be reliable mark-
ers of left ventricular function when compared with echocardi-
ographic assessments [27] and left ventricular dP/dt max [44].
Interestingly, CFI and GEF identified a subpopulation of septic
patients with a myocardial function as poor as in AHF patients.
The CFI cutoff level for a depressed myocardial function in our
septic population was between 4 and 5 per minute, which is
in agreement with the results of a recent study indicating that
a CFI of less than 4 per minute estimated a left ventricular frac-
tional area of change of less than 40% with a sensitivity of
86% and a specificity of 88% [30].
In AHF patients but not in septic patients, PAOP was nega-
tively correlated with CFI, suggesting that PAOP in heart fail-
ure is a marker of myocardial dysfunction. This is in line with
earlier results in patients with acute myocardial infarction [45],
in which a PAOP of at least 18 mm Hg was associated with an
increased mortality [46]. Caution is recommended when using
PAOP as a surrogate marker of cardiac function because
Table 4
Comparing hemodynamic characteristics between patients with sepsis and acute heart failure
Sepsis
n = 36
Acute heart failure
n = 48
P value
PAC
CI, L/minute per m
2
4.2 (3.6–5.5) 2.6 (2.2–3.0) < 0.001
CP, W 1.14 (0.99–1.63) 0.80 (0.62–0.94) < 0.001
LVSWI, g-m/m
2
38 (30–49) 23 (18–29)
a
< 0.001
RAP, mm Hg 13 (9–15) 12 (8–14) 0.26
PAOP, mm Hg 16 (15–18) 20 (15–24)
a
0.008
MPAP, mm Hg 29 (26–32) 32 (26–37) 0.02
SmvO
2
, percentage 68 (62–74) 57 (50–62)
b
< 0.001
PiCCO
CI, L/minute per m
2
4.6 (3.7–5.6) 2.7 (2.2–3.3) < 0.001
CFI, 1/minute 6.1 (3.5–6.8) 2.8 (2.3–3.1) < 0.001
GEF, percentage 23 (17–30) 14 (10–16) < 0.001
GEDVI, mL/m
2
907 (748–1133) 995 (849–1172) 0.16
ELWI, mL/kg 18.0 (14.3–23.1) 14.7 (13.1–18.5) 0.09
PVPI 2.8 (2.3–3.5) 2.4 (1.7–2.9) 0.01
ELWI/GEDVI, × 10
2
2.0 (1.7–2.4) 1.6 (1.3–2.2) 0.01
Data represent the median (interquartile range) of the four consecutive measurements obtained during the observation period. Reduced numbers
because of missing values are indicated with superscript a (
a
), where n = 40, and superscript b (
b
), where n = 44. CFI: cardiac function index; CI:
cardiac index; CP: cardiac power; ELWI: extravascular lung water index; GEDVI: global end-diastolic volume index; GEF: global ejection fraction;
LVSWI: left ventricular stroke work index; MPAP: mean pulmonary arterial pressure; PAC: pulmonary artery catheter; PAOP: pulmonary artery
occlusion pressure; PiCCO: transpulmonary thermodilution technique; PVPI: pulmonary vascular permeability index; RAP: right atrial pressure;
SmvO
2
: mixed venous oxygen saturation.
Available online />Page 7 of 10
(page number not for citation purposes)
PAOP depends on left ventricular filling volume and compli-
ance. Hence, the relationship between the left ventricular filling
pressure and volume is not linear [47]. Therefore, other pres-
sure-independent hemodynamic markers of cardiac function
such as CFI, GEF, or CP are superior. The results of our study
in septic and AHF patients suggest that CFI adequately
reflects cardiac function and may be preferred to PAOP,
LVSWI, and CP.
Consistent with previous studies in heart failure [8] and septic
[48,49] patients, PAOP correlated neither with GEDVI nor
with EVLW. In contrast to a recent study performed in patients
with hydrostatic pulmonary edema and acute lung injury/acute
respiratory distress syndrome (ALI/ARDS) [13], we could not
find a significant difference in GEDVI and EVLW between
heart failure and septic patients. However, we found a lower
PVPI and ELWI/GEDVI ratio in patients with AHF than in those
with sepsis. This is in accordance with the hydrostatic origin of
pulmonary edema in the former group. In our septic patients,
GEDVI was higher and ELWI and PVPI were both lower than
in the patients with ALI/ARDS reported by Monnet and col-
leagues [13]. This difference may be explained by lower pul-
monary vascular permeability and milder pulmonary edema in
our patients. The PaO
2
/FiO
2
(partial arterial oxygen pressure/
inspired oxygen fraction) ratios were an average of 165 mm
Hg in our septic patients and 118 mm Hg in patients with ALI/
ARDS reported by Monnet and colleagues. In our AHF
patients, PVPI and the ELWI/GEDVI ratio were surprisingly
high, suggesting an increased pulmonary vascular permeabil-
ity in addition to an elevated left ventricular filling pressure.
These results add further evidence against the use of PAOP
as the only criterion to differentiate between a hydrostatic and
a permeability type of pulmonary edema [12,50,51].
The number of patients limits the results of our study. How-
ever, consistently using four measurements per patient in a
condition close to a steady state over a short observation
period of an average of 19 hours, 2 days after ICU admission,
Figure 1
The relation between CFI, LVSWI and CPThe relation between CFI, LVSWI and CP. (a) The relationship
between cardiac function index (CFI) and left ventricular stroke work
index (LVSWI) in patients with sepsis and those with acute heart fail-
ure. Significant correlations between the two variables exist in patients
with sepsis (r
2
= 0.30, P = 0.001) and those with acute heart failure (r
2
= 0.23, P = 0.002). (b) The significant relationship between CFI and
cardiac power (CP) in both patient groups (sepsis: r
2
= 0.39, P <
0.001; acute heart failure: r
2
= 0.45, P < 0.001). Dashed lines indicate
CFI of 4.5 per minute, LVSWI of 40 g-m/m
2
, and CP of 1.3 W.
Figure 2
The relation between GEF, LVSWI and CPThe relation between GEF, LVSWI and CP. (a) The relationship
between global ejection fraction (GEF) and left ventricular stroke work
index (LVSWI) in patients with sepsis and those with acute heart fail-
ure. Significant correlations between the two variables exist in patients
with sepsis (r
2
= 0.26, P = 0.001) and those with acute heart failure (r
2
= 0.18, P = 0.006). (b) The significant relationship between GEF and
cardiac power (CP) in both patient groups (sepsis: r
2
= 0.22, P =
0.004; acute heart failure: r
2
= 0.13, P = 0.01). Dashed lines indicate
GEF of 20%, LVSWI of 40 g-m/m
2
, and CP of 1.3 W.
Critical Care Vol 13 No 4 Ritter et al.
Page 8 of 10
(page number not for citation purposes)
at least partially compensated for this limitation. Moreover,
consecutive measurements in the same patients may have
multiplied the number of errors. However, as seen in Tables 3
and 4, the IQRs for a single variable between the four sets of
measurements and within the groups were small. Thus, our
measurements made in two different and well-characterised
clinical conditions probably give a realistic hemodynamic pic-
ture of the two populations, allowing a fair comparison
between PiCCO and PAC. Another important point is that
some of the investigated parameters are mathematically cou-
pled. For example, LVSWI, CFI, and CP are all linked to SV.
Similarly, GEDV is the preload index for both CFI and GEF.
This fact might explain at least some of the significant correla-
tions found in this study.
Conclusions
The results of our study indicate that hemodynamic variables
derived from the transpulmonary thermodilution method allow
hemodynamic characterisation of patients with AHF and sep-
sis. In particular, a low CFI and GEF identified cardiac dysfunc-
tion in patients with AHF and in patients with severe sepsis or
septic shock. Prospective studies are now needed to demon-
strate that the PiCCO technology is superior to a standard of
care based on the current recommendations for hemodynamic
monitoring and management in shock [40,52].
Competing interests
MM is a member of the Pulsion Medical Systems AG Medical
Advisory Board. He received reimbursements for travel costs
by the company for attending advisory board meetings and
giving talks on several occasions. He received no grants for
this study. The other authors declare that they have no com-
peting interests.
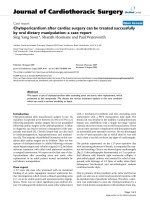
Figure 3
The relation between CFI, PAOP and SmvO2The relation between CFI, PAOP and SmvO2. (a) The relationship
between cardiac function index (CFI) and pulmonary artery occlusion
pressure (PAOP) in patients with sepsis and acute heart failure. In
patients with acute heart failure, CFI is negatively correlated with PAOP
(r
2
= -0.18, P = 0.006), whereas there is no significant correlation in
septic patients (r
2
= 0.0006, P = 0.89). (b) CFI is significantly corre-
lated with mixed venous oxygen saturation (SmvO
2
) in patients with
sepsis (r
2
= 0.22, P = 0.004) but not in patients with acute heart failure
(r
2
= 0.03, P = 0.26). Dashed lines indicate CFI of 4.5 per minute,
PAOP of 18 mm Hg, and SmvO
2
of 70%.
Figure 4
The relation between PAOP, ELWI and PVPIThe relation between PAOP, ELWI and PVPI. (a) The relationship
between pulmonary artery occlusion pressure (PAOP) and extravascu-
lar lung water index (ELWI) in patients with sepsis and patients with
acute heart failure. (b) The relationship between PAOP and pulmonary
vascular permeability index (PVPI) in patients with sepsis and patients
with acute heart failure. No significant correlation exists between PAOP
and the other two variables in either group of patients. Dashed lines
indicate PAOP of 18 mm Hg, ELWI of 10 mL/kg, and PVPI of 3.0.
Available online />Page 9 of 10
(page number not for citation purposes)
Authors' contributions
SR was responsible for data collection, carried out the statis-
tical analysis, contributed to the interpretation of data, and
drafted and revised the manuscript. AR carried out the statis-
tical analysis, contributed to the interpretation of data, and
revised the manuscript. MM developed the study design, coor-
dinated data collection, helped to carry out the statistical anal-
ysis and interpretation of data, and revised the manuscript. All
authors read and approved the final manuscript.
Acknowledgements
AR was supported by a personal grant from the Siegenthaler Founda-
tion (Zurich, Switzerland). This study was performed in the University
Hospital of Zurich (Switzerland). The authors are indebted to the medi-
cal and nursing ICU staff for taking care of the patients.
References
1. Binanay C, Califf RM, Hasselblad V, O'Connor CM, Shah MR,
Sopko G, Stevenson LW, Francis GS, Leier CV, Miller LW: Eval-
uation study of congestive heart failure and pulmonary artery
catheterization effectiveness: the ESCAPE trial. JAMA 2005,
294:1625-1633.
2. Rhodes A, Cusack RJ, Newman PJ, Grounds RM, Bennett ED: A
randomised, controlled trial of the pulmonary artery catheter in
critically ill patients. Intensive Care Med 2002, 28:256-264.
3. Richard C, Warszawski J, Anguel N, Deye N, Combes A, Barnoud
D, Boulain T, Lefort Y, Fartoukh M, Baud F, Boyer A, Brochard L,
Teboul JL: Early use of the pulmonary artery catheter and out-
comes in patients with shock and acute respiratory distress
syndrome: a randomized controlled trial. JAMA 2003,
290:2713-2720.
4. Harvey S, Harrison DA, Singer M, Ashcroft J, Jones CM, Elbourne
D, Brampton W, Williams D, Young D, Rowan K: Assessment of
the clinical effectiveness of pulmonary artery catheters in
management of patients in intensive care (PAC-Man): a ran-
domised controlled trial. Lancet 2005, 366:472-477.
5. Wiener RS, Welch HG: Trends in the use of the pulmonary
artery catheter in the United States, 1993–2004. JAMA 2007,
298:423-429.
6. Nieminen MS, Bohm M, Cowie MR, Drexler H, Filippatos GS, Jon-
deau G, Hasin Y, Lopez-Sendon J, Mebazaa A, Metra M, Rhodes
A, Swedberg K, Priori SG, Garcia MA, Blanc JJ, Budaj A, Cowie
MR, Dean V, Deckers J, Burgos EF, Lekakis J, Lindahl B, Mazzotta
G, Morais J, Oto A, Smiseth OA, Garcia MA, Dickstein K, Albu-
querque A, Conthe P, et al.: Executive summary of the guide-
lines on the diagnosis and treatment of acute heart failure: the
Task Force on Acute Heart Failure of the European Society of
Cardiology. Eur Heart J 2005, 26:384-416.
7. Crexells C, Chatterjee K, Forrester JS, Dikshit K, Swan HJ: Opti-
mal level of filling pressure in the left side of the heart in acute
myocardial infarction. N Engl J Med 1973, 289:1263-1266.
8. Bindels AJ, Hoeven JG van der, Meinders AE: Pulmonary artery
wedge pressure and extravascular lung water in patients with
acute cardiogenic pulmonary edema requiring mechanical
ventilation. Am J Cardiol 1999, 84:1158-1163.
9. Lichtwarck-Aschoff M, Zeravik J, Pfeiffer UJ: Intrathoracic blood
volume accurately reflects circulatory volume status in criti-
cally ill patients with mechanical ventilation. Intensive Care
Med 1992, 18:
142-147.
10. Sakka SG, Bredle DL, Reinhart K, Meier-Hellmann A: Comparison
between intrathoracic blood volume and cardiac filling pres-
sures in the early phase of hemodynamic instability of patients
with sepsis or septic shock. J Crit Care 1999, 14:78-83.
11. Michard F, Alaya S, Zarka V, Bahloul M, Richard C, Teboul JL: Glo-
bal end-diastolic volume as an indicator of cardiac preload in
patients with septic shock. Chest 2003, 124:1900-1908.
12. Isakow W, Schuster DP: Extravascular lung water measure-
ments and hemodynamic monitoring in the critically ill: bed-
side alternatives to the pulmonary artery catheter. Am J
Physiol Lung Cell Mol Physiol 2006, 291:L1118-1131.
13. Monnet X, Anguel N, Osman D, Hamzaoui O, Richard C, Teboul JL:
Assessing pulmonary permeability by transpulmonary ther-
modilution allows differentiation of hydrostatic pulmonary
edema from ALI/ARDS. Intensive Care Med 2007, 33:448-453.
14. Della Rocca G, Costa GM, Coccia C, Pompei L, Di Marco P, Pie-
tropaoli P: Preload index: pulmonary artery occlusion pressure
versus intrathoracic blood volume monitoring during lung
transplantation. Anesth Analg 2002, 95:835-843.
15. Sakka SG, Klein M, Reinhart K, Meier-Hellmann A: Prognostic
value of extravascular lung water in critically ill patients. Chest
2002, 122:2080-2086.
16. Phillips CR, Chesnutt MS, Smith SM: Extravascular lung water in
sepsis-associated acute respiratory distress syndrome:
indexing with predicted body weight improves correlation with
severity of illness and survival. Crit Care Med 2008, 36:69-73.
17. Kuzkov VV, Kirov MY, Sovershaev MA, Kuklin VN, Suborov EV,
Waerhaug K, Bjertnaes LJ: Extravascular lung water determined
with single transpulmonary thermodilution correlates with the
severity of sepsis-induced acute lung injury. Crit Care Med
2006, 34:1647-1653.
18. Martin GS, Eaton S, Mealer M, Moss M: Extravascular lung water
in patients with severe sepsis: a prospective cohort study. Crit
Care 2005, 9:R74-82.
19. Goepfert MS, Reuter DA, Akyol D, Lamm P, Kilger E, Goetz AE:
Goal-directed fluid management reduces vasopressor and
catecholamine use in cardiac surgery patients. Intensive Care
Med 2007, 33:96-103.
20. Sakka SG, Reinhart K, Meier-Hellmann A: Comparison of pulmo-
nary artery and arterial thermodilution cardiac output in criti-
cally ill patients. Intensive Care Med 1999, 25:843-846.
21. Gust R, Gottschalk A, Bauer H, Bottiger BW, Bohrer H, Martin E:
Cardiac output measurement by transpulmonary versus con-
ventional thermodilution technique in intensive care patients
after coronary artery bypass grafting. J Cardiothorac Vasc
Anesth 1998, 12:519-522.
22. Sakka SG, Ruhl CC, Pfeiffer UJ, Beale R, McLuckie A, Reinhart K,
Meier-Hellmann A: Assessment of cardiac preload and
extravascular lung water by single transpulmonary thermodi-
lution. Intensive Care Med 2000, 26:180-187.
23. Levy MM, Fink MP, Marshall JC, Abraham E, Angus D, Cook D,
Cohen J, Opal SM, Vincent JL, Ramsay G: 2001 SCCM/ESICM/
ACCP/ATS/SIS International Sepsis Definitions Conference.
Intensive Care Med 2003, 29:530-538.
24. Le Gall JR, Lemeshow S, Saulnier F: A new Simplified Acute
Physiology Score (SAPS II) based on a European/North Amer-
ican multicenter study. JAMA 1993, 270:2957-2963.
25. Yelderman M: Continuous measurement of cardiac output with
the use of stochastic system identification techniques. J Clin
Monit 1990, 6:322-332.
26. Boldt J, Menges T, Wollbruck M, Hammermann H, Hempelmann
G: Is continuous cardiac output measurement using ther-
modilution reliable in the critically ill patient? Crit Care Med
1994, 22:1913-1918.
27. Meier P, Zierler KL: On the theory of the indicator-dilution
method for measurement of blood flow and volume. J Appl
Physiol 1954, 6:731-744.
28. Newman EV, Merrell M, Genecin A, Monge C, Milnor WR, McK-
eever WP: The dye dilution method for describing the central
circulation. An analysis of factors shaping the time-concentra-
tion curves. Circulation 1951, 4:735-746.
29. Carter SA, Swan HJ, Wood EH: Time and concentration compo-
nents of indicator-dilution curves recorded following central
Key messages
• Pulse contour cardiac output (PiCCO)-derived cardiac
output measurements parallel values obtained by pul-
monary artery catheter, even in critically ill medical
patients presenting with a low cardiac output.
• The PiCCO-derived cardiac function index and global
ejection fraction are valuable parameters of cardiac
function in patients with acute heart failure and severe
sepsis or septic shock.
Critical Care Vol 13 No 4 Ritter et al.
Page 10 of 10
(page number not for citation purposes)
injections of dye in normal human subjects. Circulation 1959,
19:430-439.
30. Combes A, Berneau JB, Luyt CE, Trouillet JL: Estimation of left
ventricular systolic function by single transpulmonary ther-
modilution. Intensive Care Med 2004, 30:1377-1383.
31. Katzenelson R, Perel A, Berkenstadt H, Preisman S, Kogan S,
Sternik L, Segal E: Accuracy of transpulmonary thermodilution
versus gravimetric measurement of extravascular lung water.
Crit Care Med 2004, 32:1550-1554.
32. Fincke R, Hochman JS, Lowe AM, Menon V, Slater JN, Webb JG,
LeJemtel TH, Cotter G: Cardiac power is the strongest hemody-
namic correlate of mortality in cardiogenic shock: a report
from the SHOCK trial registry. J Am Coll Cardiol 2004,
44:340-348.
33. Cotter G, Moshkovitz Y, Kaluski E, Milo O, Nobikov Y, Schnee-
weiss A, Krakover R, Vered Z: The role of cardiac power and sys-
temic vascular resistance in the pathophysiology and
diagnosis of patients with acute congestive heart failure. Eur
J Heart Fail 2003, 5:443-451.
34. Mendoza DD, Cooper HA, Panza JA: Cardiac power output pre-
dicts mortality across a broad spectrum of patients with acute
cardiac disease. Am Heart J 2007, 153:366-370.
35. Bland JM, Altman DG: Statistical methods for assessing agree-
ment between two methods of clinical measurement. Lancet
1986, 1:307-310.
36. Rödig G, Prasser C, Keyl C, Liebold A, Hobbhahn J: Continuous
cardiac output measurement: pulse contour analysis vs ther-
modilution technique in cardiac surgical patients. Br J Anaesth
1999, 82:525-530.
37. Goedje O, Hoeke K, Lichtwarck-Aschoff M, Faltchauser A, Lamm
P, Reichart B: Continuous cardiac output by femoral arterial
thermodilution calibrated pulse contour analysis: comparison
with pulmonary arterial thermodilution. Crit Care Med 1999,
27:2407-2412.
38. Della Rocca G, Costa MG, Pompei L, Coccia C, Pietropaoli P:
Continuous and intermittent cardiac output measurement:
pulmonary artery catheter versus aortic transpulmonary tech-
nique. Br J Anaesth 2002, 88:350-356.
39. Ostergaard M, Nielsen J, Rasmussen JP, Berthelsen PG: Cardiac
output – pulse contour analysis vs. pulmonary artery ther-
modilution.
Acta Anaesthesiol Scand 2006, 50:1044-1049.
40. Antonelli M, Levy M, Andrews PJ, Chastre J, Hudson LD, Manthous
C, Meduri GU, Moreno RP, Putensen C, Stewart T, Torres A:
Hemodynamic monitoring in shock and implications for man-
agement. International Consensus Conference, Paris, France,
27–28 April 2006. Intensive Care Med 2007, 33:575-590.
41. Ho BC, Bellomo R, McGain F, Jones D, Naka T, Wan L, Braitberg
G: The incidence and outcome of septic shock patients in the
absence of early-goal directed therapy. Crit Care 2006,
10:R80.
42. Perel A, Segal E: Management of sepsis. N Engl J Med 2007,
356:1178. author reply 1181–1172
43. Shapiro NI, Howell MD, Talmor D, Lahey D, Ngo L, Buras J, Wolfe
RE, Weiss JW, Lisbon A: Implementation and outcomes of the
Multiple Urgent Sepsis Therapies (MUST) protocol. Crit Care
Med 2006, 34:1025-1032.
44. Lichtwarck-Aschoff M, Leucht S, Kisch HW, Zimmermann G,
Blumel G, Pfeiffer UJ: Monitoring of right ventricular function
using a conventional slow response thermistor catheter.
Intensive Care Med 1994, 20:348-353.
45. Forrester JS, Diamond G, Chatterjee K, Swan HJ: Medical therapy
of acute myocardial infarction by application of hemodynamic
subsets (first of two parts). N Engl J Med 1976,
295:1356-1362.
46. Shell WE, DeWood MA, Peter T, Mickle D, Prause JA, Forrester
JS, Swan HJ: Comparison of clinical signs and hemodynamic
state in the early hours of transmural myocardial infarction.
Am Heart J 1982, 104:521-528.
47. Pinsky MR: Clinical significance of pulmonary artery occlusion
pressure. Intensive Care Med 2003, 29:175-178.
48. Boussat S, Jacques T, Levy B, Laurent E, Gache A, Capellier G,
Neidhardt A: Intravascular volume monitoring and extravascu-
lar lung water in septic patients with pulmonary edema. Inten-
sive Care Med 2002, 28:712-718.
49. Spohr F, Hettrich P, Bauer H, Haas U, Martin E, Bottiger BW:
Comparison of two methods for enhanced continuous circula-
tory monitoring in patients with septic shock. Intensive Care
Med 2007, 33:1805-1810.
50. Abraham E, Matthay MA, Dinarello CA, Vincent JL, Cohen J, Opal
SM, Glauser M, Parsons P, Fisher CJ Jr, Repine JE: Consensus
conference definitions for sepsis, septic shock, acute lung
injury, and acute respiratory distress syndrome: time for a
reevaluation. Crit Care Med 2000, 28:232-235.
51. Schuster DP: Identifying patients with ARDS: time for a differ-
ent approach. Intensive Care Med 1997, 23:1197-1203.
52. Dellinger RP, Levy MM, Carlet JM, Bion J, Parker MM, Jaeschke R,
Reinhart K, Angus DC, Brun-Buisson C, Beale R, Calandra T, Dhai-
naut JF, Gerlach H, Harvey M, Marini JJ, Marshall J, Ranieri M, Ram-
say G, Sevransky J, Thompson BT, Townsend S, Vender JS,
Zimmerman JL, Vincent JL: Surviving Sepsis Campaign: interna-
tional guidelines for management of severe sepsis and septic
shock: 2008. Crit Care Med 2008, 36:296-327.