Báo cáo y học: "Effect of fluid resuscitation on mortality and organ function in experimental sepsis model" pps
Bạn đang xem bản rút gọn của tài liệu. Xem và tải ngay bản đầy đủ của tài liệu tại đây (516.6 KB, 11 trang )
Open Access
Available online />Page 1 of 11
(page number not for citation purposes)
Vol 13 No 6
Research
Effect of fluid resuscitation on mortality and organ function in
experimental sepsis models
Sebastian Brandt
1
, Tomas Regueira
2
*, Hendrik Bracht
2
*, Francesca Porta
2
, Siamak Djafarzadeh
2
,
Jukka Takala
2
, José Gorrasi
2
, Erika Borotto
2
, Vladimir Krejci
1
, Luzius B Hiltebrand
1
,
Lukas E Bruegger
3
, Guido Beldi
3
, Ludwig Wilkens
5
, Philipp M Lepper
2
, Ulf Kessler
4
and
Stephan M Jakob
2
1
Department of Anaesthesia and Pain Therapy, Inselspital, Bern University Hospital and University of Bern, CH-3010 Bern, Switzerland
2
Department of Intensive Care Medicine, Inselspital, Bern University Hospital and University of Bern, CH-3010 Bern, Switzerland
3
Department of Visceral and Transplant Surgery, Inselspital, Bern University Hospital and University of Bern, CH-3010 Bern, Switzerland
4
Department of Pediatric Surgery, Inselspital, Bern University Hospital and University of Bern, CH-3010 Bern, Switzerl
5
Institute of Pathology, University of Bern, Murtenstrasse 31, CH-3010 Bern, Switzerland
* Contributed equally
Corresponding author: Stephan M Jakob,
Received: 31 Jul 2009 Revisions requested: 21 Sep 2009 Revisions received: 12 Oct 2009 Accepted: 23 Nov 2009 Published: 23 Nov 2009
Critical Care 2009, 13:R186 (doi:10.1186/cc8179)
This article is online at: />© 2009 Brandt et al.; licensee BioMed Central Ltd.
This is an open access article distributed under the terms of the Creative Commons Attribution License ( />),
which permits unrestricted use, distribution, and reproduction in any medium, provided the original work is properly cited.
Abstract
Introduction Several recent studies have shown that a positive
fluid balance in critical illness is associated with worse outcome.
We tested the effects of moderate vs. high-volume resuscitation
strategies on mortality, systemic and regional blood flows,
mitochondrial respiration, and organ function in two
experimental sepsis models.
Methods 48 pigs were randomized to continuous endotoxin
infusion, fecal peritonitis, and a control group (n = 16 each), and
each group further to two different basal rates of volume supply
for 24 hours [moderate-volume (10 ml/kg/h, Ringer's lactate, n
= 8); high-volume (15 + 5 ml/kg/h, Ringer's lactate and
hydroxyethyl starch (HES), n = 8)], both supplemented by
additional volume boli, as guided by urinary output, filling
pressures, and responses in stroke volume. Systemic and
regional hemodynamics were measured and tissue specimens
taken for mitochondrial function assessment and histological
analysis.
Results Mortality in high-volume groups was 87% (peritonitis),
75% (endotoxemia), and 13% (controls). In moderate-volume
groups mortality was 50% (peritonitis), 13% (endotoxemia) and
0% (controls). Both septic groups became hyperdynamic.
While neither sepsis nor volume resuscitation strategy was
associated with altered hepatic or muscle mitochondrial
complex I- and II-dependent respiration, non-survivors had lower
hepatic complex II-dependent respiratory control ratios (2.6 +/-
0.7, vs. 3.3 +/- 0.9 in survivors; P = 0.01). Histology revealed
moderate damage in all organs, colloid plaques in lung tissue of
high-volume groups, and severe kidney damage in endotoxin
high-volume animals.
Conclusions High-volume resuscitation including HES in
experimental peritonitis and endotoxemia increased mortality
despite better initial hemodynamic stability. This suggests that
the strategy of early fluid management influences outcome in
sepsis. The high mortality was not associated with reduced
mitochondrial complex I- or II-dependent muscle and hepatic
respiration.
Introduction
Severe sepsis and septic shock are major causes of death in
intensive care patients [1,2]. Most deaths from septic shock
can be attributed to either cardiovascular or multiorgan failure
[3]. The causes of organ dysfunction and failure are unclear,
but inadequate tissue perfusion, systemic inflammation, and
direct metabolic changes at the cellular level are all likely to
contribute [4-6].
Fluid resuscitation is a major component of cardiovascular
support in early sepsis. Although the need for fluid resuscita-
tion in sepsis is well established [7], the goals and compo-
ANOVA: analysis of variance; HES: hydroxyethyl starch; H&E: hematoxylin and eosin.
Critical Care Vol 13 No 6 Brandt et al.
Page 2 of 11
(page number not for citation purposes)
nents of this treatment are still a matter of debate. Several
recent studies have shown that a positive fluid balance in crit-
ical illness is strongly associated with a higher severity of
organ dysfunction and with worse outcome [8-14]. It is unclear
whether this is the primary consequence of fluid therapy per
se, or reflects the severity of illness.
We hypothesized that the fluid resuscitation strategy has an
impact on sepsis-related metabolic and cellular alterations,
and outcome in sepsis. To test this hypothesis, we used two
different basal rates of volume supply (to mimic 'restrictive' and
'wet' approaches), supplemented by additional volume boli,
when clinically relevant and commonly used physiological var-
iables such as urinary output or filling pressures decreased.
We measured the effects of these two volume approaches on
systemic and regional blood flows, organ function and mortal-
ity. As no experimental model can directly be extrapolated to
clinical sepsis and the effects of fluid resuscitation may be
model-dependent [15,16], two different sepsis models - fecal
peritonitis and endotoxemia - were studied.
Materials and methods
The study was performed in accordance with the National
Institutes of Health guidelines for the care and use of experi-
mental animals and with the approval of the Animal Care Com-
mittee of the Canton of Bern, Switzerland.
The experimental design included two factors: the model of
sepsis (control, peritonitis, endotoxemia) and the strategy of
fluid resuscitation (moderate volume or high volume). A full fac-
torial design with six experimental groups was used.
Animal preparation and experimental setting
Pigs of both sexes (weight: median 41 kg; range 38 to 44 kg)
were fasted overnight. They were then premedicated, anesthe-
tized with pentobarbital, intubated endotracheally and venti-
lated (volume control mode; Servo ventilator 900 C; Siemens-
Elema
®
, Solna, Sweden) with 5 cm H
2
O positive end-expira-
tory pressure. Anesthesia was maintained with pentobarbital
(7 mg/kg/h) and fentanyl (25 μg/kg/h during operation and 3
μg/kg/h afterwards), and pancuronium (1 mg/kg/h) was used
for muscle relaxation. A single dose of 1.5 g cefuroxime was
injected before surgery. An esophageal Doppler probe (Del-
tex
®
, Chichester, UK) was inserted, and catheters for pressure
measurement and blood sampling were placed into the
carotid, hepatic and pulmonary arteries, and into the jugular,
hepatic, portal, renal and mesenteric veins. Ultrasound Dop-
pler flow probes (Transonic
®
System Inc., Ithaca, NY, USA)
were positioned around the carotid, superior mesenteric,
splenic and hepatic arteries, and celiac trunk and portal vein.
Laser Doppler needle and surface probes (Optronics
®
,
Oxford, UK) were inserted into the liver and kidney, and fixed
on the surface of gastric and jejunal mucosa and the kidney.
More details on the surgical procedure are described in the
supplement [see Additional Data File 1].
Experimental protocol
After surgery, approximately 12 hours was allowed for hemo-
dynamic stabilization. During this period, Ringer's lactate at 10
ml/kg/h was infused to keep hemodynamic stability. The ani-
mals were then randomized into six groups (eight pigs in
each): control, fecal peritonitis, or endotoxin, each with either
high (15 ml/kg/hr Ringer's lactate and 5 ml/kg/hr hydroxyethyl
starch (HES) 130/04, 6% (Voluven
®
, Fresenius, Stans, Swit-
zerland)) or moderate volume fluid resuscitation (10 mL/kg/hr
Ringer's lactate).
In the peritonitis groups, 1 g per kg of autologous feces, dis-
solved in warmed glucose solution, was instilled in the abdom-
inal cavity. In the other groups, the same amount of sterile
glucose solution was instilled. The intraperitoneal drains were
clamped during the first six hours. In the endotoxin groups,
endotoxin (lipopolysaccharide from Escherichia coli 0111:B4,
20 mg/l in 5% dextrose; Sigma
®
, Steinheim, Germany) was
infused into the right atrium. The effect of endotoxin was
judged by the magnitude of pulmonary artery pressure. Initially,
endotoxin was infused at 0.4 μg/kg/h until mean pulmonary
arterial pressure reached 35 mmHg and the animals became
hypotensive. The endotoxin infusion was then stopped, and if
arterial hypotension persisted (mean arterial pressure below
60 mmHg), 50 ml of HES was administered. If an arterial blood
pressure of more than 55 mmHg could not be restored,
boluses of adrenaline (5 to 10 μg/bolus) were injected to pre-
vent acute right heart failure and death. Adrenaline was only
used to treat hypotension within one hour of the onset of pul-
monary artery hypertension. If mean pulmonary pressure sub-
sequently decreased below 30 mmHg, the endotoxin infusion
was restarted (0.1 μg/kg/h) and increased hourly by 30%, if
necessary, to maintain mean pulmonary artery pressure at 25
to 30 mmHg. After eight hours of endotoxin infusion, the infu-
sion rate was kept constant.
Throughout the experiment (including the postoperative stabi-
lization period), the volume status was evaluated clinically
every hour, and if signs of hypovolemia became evident (pul-
monary artery occlusion pressure ≤ 5 mmHg or urinary output
≤ 0.5 mL/kg/hour), additional 50 ml boluses of HES were
given regardless of study group. Fluid boluses were repeated
under stroke volume monitoring with esophageal Doppler for
as long as the stroke volume was increased by 10% or more.
For the validity of esophageal Doppler with respect to cardiac
output measurement by thermodilution see Dark and Singer
[17]. To maintain the differences between high- and moderate-
volume groups, maximal additional volume was restricted to
100 ml per hour in all groups. Vasopressors were not used. If
necessary, 50% glucose solution was administered to main-
tain blood glucose of 3.5 to 6 mmol/l, and the standard infu-
sion rate was adjusted to maintain unchanged basal volume
supply.
Available online />Page 3 of 11
(page number not for citation purposes)
The quadriceps muscle was biopsied at baseline, after six
hours, and at the end of the experiment, and the liver was biop-
sied at the end of the experiment, for mitochondrial function
measurement [see Additional Data File 1].
The animals were followed until 24 hours after randomization
or until death, if earlier. After 24 hours, the animals were euth-
anized with an overdose of potassium chloride. Blood sam-
pling, histological analysis and interpretation of causes of
mortality are described in the online supplement [see Addi-
tional Data File 1].
Statistical analysis
The SPSS 13.0 software package (SPSS Inc.
®
, Chicago, IL,
USA) was used for statistical analysis. Normal distribution was
assessed by the Kolmogorov-Smirnov test.
Survival proportions between the groups were analyzed with
the log rank test, followed by post-hoc log-rank tests for
groups 'low volume' vs. 'high volume' and for groups 'endotox-
emia' vs. 'fecal peritonitis' vs. 'controls'. Differences between
groups were assessed by multivariate analysis of variance for
repeated measures using one dependent variable, two
between-subject factors model (control, endotoxemia, peri-
tonitis) and volume (moderate, high) and one within-subject
factor (time). Significant time-volume and time-model interac-
tions were considered as effects of volume resuscitation and
experimental model, respectively. If significant interactions
occurred, analysis of variance (ANOVA) for repeated meas-
ures was performed in the individual involved groups to assess
where changes occurred.
Fluid input and balance were compared with one-way ANOVA.
The Tukey post-hoc test was performed to assess differences
between the models. For hepatic mitochondrial analysis, uni-
variate analysis of variance was used. Significant effects of the
fixed factors model and volume were further analyzed post hoc
with the independent t-test. For comparison of mitochondrial
function between survivors and non-survivors, an analysis of
variance for repeated measures was used for muscle mito-
chondria and an independent t-test for liver mitochondria. Sta-
tistical significance was considered at P < 0.05. In post-hoc
testing, the difference between groups with the lowest P value
(even when >0.05) was considered responsible for the
observed significant results in primary testing. Data are
expressed as mean ± standard deviation.
Results
Fluid balance
The three moderate-volume groups received an average of
11.0, and the high-volume groups 2.4 boli of additional vol-
ume. The total fluid balance was markedly higher in the high-
volume groups (P < 0.001; Figure 1). Both peritonitis groups
exhibited significantly higher fluid balances than their matching
other groups (P = 0.001).
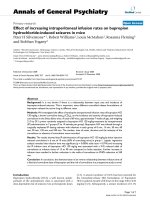
Mortality
Eight animals had to be excluded from the analysis due to
acute right-heart failure and death within minutes after the start
of endotoxin infusion (n = 7) and gut perforation with rapid
development of septic shock (n = 1). We found differences in
mortality (P < 0.001), with highest values in the peritonitis
high-volume (n = 7; 88%) and endotoxin high-volume (n = 6,
75%) groups. Mortality was higher in high- vs. low-volume
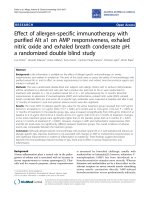
Figure 1
Continuous and bolus inputs and urine, gastric and ascites outputs for each groupContinuous and bolus inputs and urine, gastric and ascites outputs for each group. Total fluid administration; balance: high-volume groups vs. mod-
erate volume groups P = 0.001 (one-way analysis of variance). Diuresis (*) and additional hydroxyethyl starch (HES) boluses (§: peritonitis moder-
ate-volume P < 0.001 (Tukey).
Critical Care Vol 13 No 6 Brandt et al.
Page 4 of 11
(page number not for citation purposes)
groups, and in septic vs. control groups (P < 0.01, both), but
did not differ between endotoxemia and fecal peritonitis
groups. The respective median survival times were 17.5 and
16 hours. Mortality was 50% (n = 4) in the peritonitis moder-
ate-volume group and 12.5% (n = 1) in the endotoxin moder-
ate-volume group, with median survival times of 23.5 and 24
hours, respectively. One animal in the control high-volume
group died at 23.5 hours, while all moderate-volume control
pigs survived until the end of the experiment (Figure 2).
Systemic hemodynamics, oxygen transport and lactate
concentrations
Both the experimental model and volume management modi-
fied the hemodynamic response, that is, cardiac output, heart
rate, systemic and pulmonary artery pressures, and filling pres-
sures (Tables 1 and 2). The peritonitis groups became hypo-
tensive (P < 0.002) and the endotoxin groups transiently
hypertensive (P = 0.001). Cardiac output increased in both
septic groups (endotoxin: P = 0.002; peritonitis: P = 0.04;
Table 1). Mean pulmonary artery and pulmonary artery occlu-
sion pressures increased in all groups (both P < 0.001). At the
end of the experiment, pulmonary artery pressures were high-
est in both septic high-volume groups (P = 0.001), and pulmo-
nary artery occlusion pressures were highest in the peritonitis
high-volume group (P = 0.008). Mixed venous saturation
decreased in both peritonitis groups (P = 0.008; Table 2).
Arterial lactate concentration increased in endotoxin (P =
0.04) and in peritonitis pigs (P = 0.001; Table 2). Oxygen
transport data are indicated in the electronic supplement [see
Table S1 in Additional Data File 2].
Mitochondrial function
Sepsis had only limited effects on hepatic mitochondrial respi-
ration [see Table S2 in Additional Data File 2 and Figure S1 in
Additional Data File 3]. Complex I-dependent resting respira-
tion (state 4) was lower in endotoxin animals in comparison
with controls [see Figure S1 in Additional Data File 3], and the
complex I-dependent maximal ATP production was lower in
peritonitis moderate vs. high volume [see Table S2 in Addi-
tional Data File 2]. Hepatic vein lactate/pyruvate ratios were
not different between the groups [see Figure S2 in Additional
Data File 3].
Skeletal muscle mitochondrial respiration was not affected by
sepsis [see Table S3 in Additional Data File 2 and Figure S3
in Additional Data File 3]. Complex I-dependent maximal mito-
chondrial oxygen consumption (state 3) was higher in high-vol-
ume animals at six hours [see Figure S3 in Additional Data File
3]. Muscle ATP content decreased in septic moderate-volume
animals [see Table S3 in Additional Data File 2]. Muscle ATP/
ADP ratio was lower in peritonitis moderate vs. high-volume
groups [see Table S3 in Additional Data File 2].
Lungs
The oxygenation index (partial pressure of arterial oxygen to
fraction of inspired oxygen) decreased in all groups over the
course of the experiment, but most in the peritonitis groups (P
= 0.001; Table 3). The respiratory plateau pressure increased
in all groups, with the highest values in control and peritonitis
high-volume animals (P = 0.04; Table 3). The dynamic compli-
ance of the respiratory system decreased in all groups, without
differences related to volume or model. Lung histology
revealed the presence of colloid plaques and atelectases in all
groups of animals [see Figures S4 and S5 in Additional Data
File 3]. Colloid plaques tended to be more frequently present
in the high-volume groups (84%) in comparison with their
respective moderate-volume groups (59%). Atelectases were
present in 50% or more of the animals of all groups.
Figure 2
Survival curves of all experimental groupsSurvival curves of all experimental groups. log rank test: P < 0.001. The cause of death is also shown for each pig.
Available online />Page 5 of 11
(page number not for citation purposes)
Table 1
Systemic hemodynamics
Variable Group N Intra-operative Baseline 3 hours 6 hours 12 hours End Interactions P
Cardiac index
(ml/kg/min)
Time × model
effect:
0.02
C 10 ml/kg 8 n. a. 89 ± 14 88 ± 21 93 ± 22 100 ± 32 103 ± 24
C 20 ml/kg 8 n. a. 73 ± 24 88 ± 10 92 ± 11 96 ± 22 99 ± 14
E 10 ml/kg 7 n. a. 75 ± 17 69 ± 21 84 ± 25 98 ± 29 113 ± 32
E 20 ml/kg 8 n. a. 87 ± 19 83 ± 24 106 ± 33 130 ± 37 117 ± 38 ANOVArm E: 0.002
P 10 ml/kg 8 n. a. 86 ± 17 92 ± 28 105 ± 26 87 ± 26 94 ± 13
P 20 ml/kg 8 n. a. 82 ± 12 113 ± 31 103 ± 21 108 ± 24 133 ± 73 ANOVArm P: 0.04
Heart rate
(beats/min)
Time × model
effect:
0.001
C 10 ml/kg 8 116 ± 19 114 ± 38* 129 ± 40 138 ± 45 147 ± 42 138 ± 27 ANOVArm C: 0.04
C 20 ml/kg 8 126 ± 24 112 ± 25* 107 ± 18 124 ± 33 125 ± 29 135 ± 37
E 10 ml/kg 7 119 ± 20 99 ± 12* 114 ± 28 130 ± 28 153 ± 27 166 ± 20 ANOVArm E: 0.002
E 20 ml/kg 8 122 ± 16 111 ± 22* 99 ± 15 117 ± 25 137 ± 36 136 ± 33
P 10 ml/kg 8 115 ± 19 114 ± 12* 164 ± 24 186 ± 27 165 ± 37 148 ± 36 ANOVArm P: 0.001
P 20 ml/kg 8 117 ± 13 99 ± 11* 158 ± 37 175 ± 20 154 ± 35 156 ± 47
Stroke volume
index (ml/kg/beat)
Time × volume
effect:
0.03
C 10 ml/kg 8 n. a. 0.8 ± 0.2 0.7 ± 0.3 0.7 ± 0.3 0.7 ± 0.2 0.8 ± 0.3 ANOVArm
moderate-volume:
0.018
C 20 ml/kg 8 n. a. 0.7 ± 0.3 0.8 ± 0.1 0.8 ± 0.2 0.8 ± 0.2 0.8 ± 0.2
E 10 ml/kg 7 n. a. 0.8 ± 0.1 0.6 ± 0.2 0.7 ± 0.2 0.7 ± 0.3 0.7 ± 0.2
E 20 ml/kg 8 n. a. 0.8 ± 0.2 0.9 ± 0.3 0.9 ± 0.3 1.0 ± 0.4 1.0 ± 0.5
P 10 ml/kg 8 n. a. 0.8 ± 0.1 0.6 ± 0.2 0.6 ± 0.1 0.6 ± 0.3 0.7 ± 0.2
P 20 ml/kg 8 n. a. 0.8 ± 0.1 0.8 ± 0.3 0.6 ± 0.2 0.7 ± 0.2 0.9 ± 0.5
Mean arterial
pressure (mmHg)
Time × model
effect:
Time × volume
effect:
0.001
0.03
C 10 ml/kg 8 91 ± 13 71 ± 7
#
69 ± 14 72 ± 12 75 ± 5 72 ± 14
C 20 ml/kg 8 92 ± 5 69 ± 11
#
75 ± 15 77 ± 15 83 ± 15 76 ± 24 ANOVArm high-
volume:
0.001
E 10 ml/kg 7 97 ± 8 69 ± 8
#
86 ± 12 76 ± 14 78 ± 11 80 ± 11
E 20 ml/kg 8 99 ± 19 70 ± 13
#
105 ± 8 102 ± 16 86 ± 18 74 ± 23 ANOVArm E: 0.001
P 10 ml/kg 8 87 ± 13 69 ± 10
#
75 ± 14 64 ± 10 66 ± 15 49 ± 20
P 20 ml/kg 8 86 ± 16 74 ± 26
#
86 ± 23 83 ± 23 76 ± 27 61 ± 25 ANOVArm P: 0.002
Mean pulmonary
artery pressure
(mmHg)
Time × model
effect:
Time × volume
effect:
0.003
0.01
C 10 ml/kg 8 n. a. 17 ± 4 19 ± 6 18 ± 3 20 ± 4 25 ± 3 ANOVArm
moderate-volume:
0.001
C 20 ml/kg 8 n. a. 18 ± 4 20 ± 5 19 ± 5 23 ± 7 29 ± 6 ANOVArm C: 0.001
E 10 ml/kg 7 n. a. 17 ± 2 27 ± 7 25 ± 6 22 ± 5 26 ± 5 ANOVArm E: 0.001
E 20 ml/kg 7 n. a. 17 ± 3 33 ± 12 27 ± 6 29 ± 13 34 ± 11
P 10 ml/kg 8 n. a. 16 ± 3 23 ± 6 20 ± 3 21 ± 4 24 ± 3 ANOVArm P: 0.001
P 20 ml/kg 7 n. a. 18 ± 3 25 ± 5 25 ± 4 29 ± 6 36 ± 6 ANOVArm high-
volume:
0.001
Values are mean ± standard deviation. C = controls; E = endotoxin; P = peritonitis
early intraoperative vs. baseline * P < 0.0001,
#
P < 0.007
Critical Care Vol 13 No 6 Brandt et al.
Page 6 of 11
(page number not for citation purposes)
Kidney
Renal artery blood flow decreased in both peritonitis groups
(P = 0.024) [see Table S4 in Additional Data File 2]. Urinary
output was highest in control high-volume and endotoxin high-
volume groups (Figure 1). In contrast, peritonitis high-volume
pigs produced less urine, comparable to control moderate-vol-
ume pigs. The lowest diuresis was observed in peritonitis
moderate-volume pigs (Figure 1; P < 0.001). Base excess
decreased in both peritonitis groups but not in the other
groups (P = 0.001) [see Table S1 in Additional Data File 2],
while serum creatinine decreased in controls (P = 0.007) and
high-volume groups (P = 0.04; Table 4).
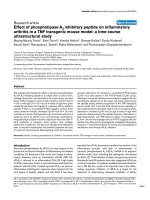
Histology revealed severe damage in five of six endotoxin high-
volume animals (83%) and in 30% to 40% of the animals in the
endotoxin and peritonitis moderate-volume groups (Figure 3).
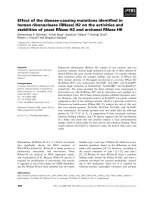
Storage of starch (HES) in the tissues was detectable as a
purple fluid in H&E-stained tissue sections, as confirmed by
Table 2
Filling pressures, mixed venous oxygen saturation and arterial lactate concentrations
Variable Group N Baseline 3 hours 6 hours 12 hours End Interactions P
Central venous pressure
(mmHg)
C 10 ml/kg 8 4 ± 2 4 ± 2 5 ± 2 5 ± 1 7 ± 2 ANOVArm moderate-
volume:
0.001
C 20 ml/kg 8 4 ± 2 6 ± 2 5 ± 2 7 ± 4 10 ± 5 ANOVArm C: 0.001
E 10 ml/kg 7 4 ± 2 4 ± 2 5 ± 2 5 ± 2 6 ± 3 ANOVArm E: 0.001
E 20 ml/kg 8 3 ± 2 6 ± 3 7 ± 3 7 ± 2 9 ± 1
P 10 ml/kg 8 3 ± 2 3 ± 1 4 ± 1 6 ± 2 7 ± 2 ANOVArm P: 0.001
P 20 ml/kg 8 5 ± 3 6 ± 3 8 ± 4 10 ± 3 14 ± 3 ANOVArm high-volume: 0.001
Pulmonary artery occlusion
pressure (mmHg)
C 10 ml/kg 8 4 ± 2 5 ± 2 5 ± 2 5 ± 2 8 ± 2 ANOVArm: 0.001
C 20 ml/kg 8 5 ± 3 6 ± 3 6 ± 2 7 ± 4 10 ± 5 ANOVArm: 0.013
E 10 ml/kg 7 5 ± 1 5 ± 2 5 ± 2 5 ± 2 7 ± 4 ANOVArm: 0.10
E 20 ml/kg 7 5 ± 3 9 ± 5 7 ± 4 8 ± 5 10 ± 3 ANOVArm: 0.018
P 10 ml/kg 8 4 ± 1 4 ± 1 5 ± 2 6 ± 2 8 ± 2 ANOVArm: 0.001
P 20 ml/kg 7 7 ± 2 7 ± 2 8 ± 3 10 ± 2 17 ± 8 ANOVArm: 0.008
Mixed venous saturation (%) Time × model effect: 0.009
C 10 ml/kg 8 55 ± 6 54 ± 11 55 ± 1 55 ± 8 57 ± 7
C 20 ml/kg 8 49 ± 7 59 ± 5 59 ± 4 60 ± 1 55 ± 18
E 10 ml/kg 7 49 ± 6 51 ± 5 55 ± 6 57 ± 3 55 ± 8 ANOVArm E: 0.013
E 20 ml/kg 7 49 ± 5 49 ± 11 60 ± 8 66 ± 2 56 ± 11
P 10 ml/kg 8 53 ± 7 59 ± 4 58 ± 7 55 ± 6 47 ± 13 ANOVArm P: 0.008
P 20 ml/kg 7 46 ± 1 57 ± 12 56 ± 14 57 ± 9 43 ± 24
Arterial lactate (mmol/l) Time × model effect: 0.046
C 10 ml/kg 8 0.6 ± 0.2 0.5 ± 0.2 0.7 ± 0.5 0.6 ± 0.1 0.7 ± 0.2
C 20 ml/kg 8 0.6 ± 0.1 0.6 ± 0.2 0.6 ± 0.1 0.6 ± 0.1 1.0 ± 1.0
E 10 ml/kg 7 0.7 ± 0.1 1.2 ± 0.7 0.9 ± 0.4 0.8 ± 0.3 0.9 ± 0.5 ANOVArm E: 0.04
E 20 ml/kg 8 0.7 ± 0.1 1.0 ± 0.3 0.9 ± 0.3 1.0 ± 0.2 1.0 ± 0.3
P 10 ml/kg 8 0.6 ± 0.2 1.4 ± 0.6 1.5 ± 0.6 1.1 ± 0.4 1.5 ± 0.6 ANOVArm P: 0.001
P 20 ml/kg 8 0.8 ± 0.6 1.1 ± 0.6 1.1 ± 0.6 1.1 ± 0.3 1.4 ± 0.6
Values are mean ± standard deviation. C = controls; E = endotoxin; P = peritonitis
Available online />Page 7 of 11
(page number not for citation purposes)
positive Periodic acid-Schiff staining. This fluid was mainly
found in dilated tubules. There was no predilection for one of
the groups (Figure 4).
Liver
Hepatic artery blood flow was mainly influenced by the model,
with flows increasing to highest levels in the endotoxin groups
(P = 0.006) [see Table S4 in Additional Data File 2]. Serum
alanine aminotransferase decreased in all high-volume groups
and stayed stable in moderate-volume groups (P = 0.001;
Table 4). Histology revealed accentuated sinusoidal struc-
tures, both local and diffuse vacuolization, and pericentral
necrosis [see Figure S6 in Additional Data File 3]. Generalized
sinusoidal dilatation was seen only in endotoxin animals, while
other histological abnormalities were present in all groups
(including controls) in various degrees, showing a tendency to
model-specific histological patterns.
Heart
The serum levels of creatine kinase isoenzyme increased in all
high-volume groups and stayed stable in moderate-volume
pigs (time × volume P = 0.006; Table 4).
Discussion
The main finding of this study was that high-volume fluid resus-
citation including HES increased mortality in sepsis. The
increased mortality was observed in both models of fecal peri-
tonitis and endotoxemia. Both these established large-animal
sepsis models share many of the features of clinical sepsis,
including hypovolemia if untreated, normo- or hyperdynamic
Table 3
Respiratory parameters
Variable Group N Baseline 3 hours 6 hours 12 hours End Interactions P
Dynamic compliance Time effect: 0.001
C 10 ml/kg 8 28 ± 6 25 ± 8 26 ± 7 25 ± 8 17 ± 5
C 20 ml/kg 8 30 ± 7 25 ± 8 26 ± 6 21 ± 5 14 ± 5
E 10 ml/kg 7 31 ± 7 27 ± 5 28 ± 6 24 ± 5 18 ± 4
E 20 ml/kg 8 32 ± 3 25 ± 3 24 ± 3 22 ± 5 22 ± 5
P 10 ml/kg 8 28 ± 2 24 ± 6 20 ± 3 20 ± 2 15 ± 2
P 20 ml/kg 8 32 ± 8 25 ± 6 21 ± 3 18 ± 2 14 ± 6
Plateau pressure
(cmH
2
O)
Time × volume effect: 0.043
C 10 ml/kg 8 18 ± 2 19 ± 2 20 ± 3 19 ± 4 24 ± 4
C 20 ml/kg 8 18 ± 2 20 ± 2 20 ± 2 22 ± 4 28 ± 8
E 10 ml/kg 7 16 ± 3 18 ± 4 18 ± 4 17 ± 4 22 ± 6 ANOVArm moderate-
volume:
0.001
E 20 ml/kg 7 15 ± 5 19 ± 7 21 ± 6 18 ± 6 21 ± 7
P 10 ml/kg 8 17 ± 3 19 ± 3 20 ± 4 22 ± 2 24 ± 5
P 20 ml/kg 7 16 ± 4 19 ± 6 22 ± 5 22 ± 6 28 ± 6 ANOVArm high-volume: 0.001
Oxygenation index
(mmHg/%)
Time × model effect: 0.026
C 10 ml/kg 8 434 ± 67 394 ± 92 384 ± 97 346 ± 67 212 ± 97 ANOVArm C: 0.001
C 20 ml/kg 8 456 ± 48 412 ± 80 424 ± 48 347 ± 106 236 ± 122
E 10 ml/kg 7 477 ± 33 418 ± 44 401 ± 57 352 ± 101 208 ± 116 ANOVArm E: 0.001
E 20 ml/kg 7 447 ± 44 313 ± 88 291 ± 102 252 ± 110 170 ± 139
P 10 ml/kg 8 449 ± 29 356 ± 54 300 ± 69 317 ± 99 217 ± 106 ANOVArm P: 0.001
P 20 ml/kg 8 412 ± 61 292 ± 104 247 ± 74 193 ± 112 63 ± 12
Values are mean ± standard deviation. C = controls; E = endotoxin; P = peritonitis
Critical Care Vol 13 No 6 Brandt et al.
Page 8 of 11
(page number not for citation purposes)
circulation with volume resuscitation, high mortality, and signs
of progressive organ dysfunction despite cardiovascular and
respiratory support.
Despite major differences in volume supply, differences in
hemodynamic responses between the groups were either
modest or appeared late: the most prominent difference was
progressive pulmonary artery hypertension and increased car-
diac filling pressures in the high-volume groups, especially in
peritonitis. We did not perform echocardiography, so direct
evaluation of myocardial function was not possible. In particu-
lar the severity of right ventricular dysfunction may have been
underestimated. The increased cardiac enzymes in all high-vol-
ume groups support the concept that relevant myocardial
damage occurred. Fluid loading in septic animals has been
shown to induce a large reduction in vascular tone, which
could be attenuated by inhibition of nitric oxide synthesis [18].
It is conceivable to argue that high amounts of volume can pro-
mote vascular leak and interstitial edema in septic states by
releasing nitric oxide and/or other vasodilating agents. This
Table 4
Laboratory parameters
Variable Group N Baseline End Interactions P
Creatinine kinase - MB (U/L) Time × volume effect: 0.006
Control 10 ml/kg 8 0.9 ± 0.1 1.0 ± 0.2
Control 20 ml/kg 8 0.9 ± 0.1 1.2 ± 0.2 ANOVArm high-volume: 0.001
Endotoxin 10 ml/kg 8 1.0 ± 0.2 1.0 ± 0.2
Endotoxin 20 ml/kg 7 1.0 ± 0.2 1.1 ± 0.3
Peritonitis 10 ml/kg 8 1.1 ± 0.2 1.1 ± 0.3
Peritonitis 20 ml/kg 8 0.8 ± 0.3 1.3 ± 0.2
Creatinine (μmol/L) Time × model effect:
Time × volume effect:
0.014
0.029
Control 10 ml/kg 8 87 ± 18 78 ± 17 ANOVArm Control: 0.007
Control 20 ml/kg 8 99 ± 13 74 ± 24 ANOVArm high-volume: 0.04
Endotoxin 10 ml/kg 8 86 ± 21 79 ± 16
Endotoxin 20 ml/kg 7 85 ± 15 74 ± 10
Peritonitis 10 ml/kg 8 81 ± 10 114 ± 31
Peritonitis 20 ml/kg 8 82 ± 17 76 ± 36
ALAT (U/L) Time × volume effect: 0.001
Control 10 ml/kg 8 18.1 ± 4.3 14.8 ± 4.5
Control 20 ml/kg 8 20.5 ± 10.5 11.3 ± 10.6 ANOVArm high-volume: 0.001
Endotoxin 10 ml/kg 8 17 ± 5.2 15.1 ± 4.3
Endotoxin 20 ml/kg 7 19 ± 5.7 11.4 ± 2.4
Peritonitis 10 ml/kg 8 16.9 ± 6.4 16.7 ± 11.2
Peritonitis 20 ml/kg 8 19.5 ± 9.2 11.3 ± 5
ASAT (U/L)
Control 10 ml/kg 8 84 ± 31 60 ± 27
Control 20 ml/kg 8 114 ± 57 76 ± 23
Endotoxin 10 ml/kg 8 96 ± 23 86 ± 44
Endotoxin 20 ml/kg 7 136 ± 84 117 ± 23
Peritonitis 10 ml/kg 8 104 ± 43 129 ± 88
Peritonitis 20 ml/kg 8 101 ± 50 100 ± 55
Values are mean ± standard deviation. ALAT = alanine aminotransferase; ASAT = aspartate aminotransferase.
Available online />Page 9 of 11
(page number not for citation purposes)
effect would be even more exaggerated when filling pressures
increase as an effect of cardiac dysfunction. In our study, lung
dysfunction, reflected in impaired oxygenation index and
mechanics, was the cause of approximately every third death
in the high-volume septic groups and none in the moderate-
volume groups. Renal perfusion was also predominantly
affected in the high-volume septic animals; especially in peri-
tonitis, despite high cardiac output and relatively well-pre-
served mean arterial pressure.
The criteria for and targets of fluid management in sepsis are
controversial. In clinical sepsis, recent guidelines - based
mainly on expert opinions (Surviving Sepsis Campaign) - have
recommended fluid administration to restore cardiac filling
pressures to at least 12 mmHg during mechanical ventilation
[19]. In mechanically ventilated patients or patients with
known pre-existing decreased ventricular compliance, central
venous pressure targets of 12 to 15 mmHg have been sug-
gested [20]. In clinical sepsis trials where fluid was adminis-
tered to optimize hemodynamics, central venous pressures of
up to 22 mmHg have been reached [21]. In the present study,
only the high-volume groups reached levels recommended by
the Surviving Sepsis campaign, with the high-volume peritoni-
tis group exceeding these levels, and these were also the
groups with the highest mortality rates. Although our approach
of two different basal rates of volume supply can be criticized,
it should be noted that even animals in the high-volume groups
received additional fluid boluses as a result of the appearance
of clinical signs of hypovolemia. In clinical sepsis trials, the
total amount of fluid given is rarely indicated. It is evident that
high targets for filling pressures will result in large amounts of
administered fluids when capillary leakage is present, and the
administered fluid does not translate into a significant increase
in venous return. For example, in the study by Rivers and col-
leagues [7], patients received a mean (± standard deviation)
of 5 (± 3) liters of fluid within the first six hours. In other patient
groups, including patients with multiorgan failure and sepsis,
patients received 13 to 30 liters of fluid for resuscitation within
24 hours [22,23]. There is growing evidence that large
amounts of fluids may be harmful, especially in septic patients
[11,24,25], but also in other patient groups [22]. Our results
point in the same direction.
Many of the experimental sepsis studies, including the present
one, have used substantially larger doses of HES than is rec-
ommended in the clinical setting. Recent trials in clinical sep-
sis have found a dose-related association between HES and
renal failure in sepsis [26]. Although a different HES solution
was used in the present study, we cannot exclude that HES
influenced the outcomes due to its pharmacological proper-
ties. Nevertheless, urinary output increased and creatinine
concentrations decreased in both control and endotoxin high-
volume groups. Furthermore, histology revealed major abnor-
malities in the endotoxin high-volume group but not in the peri-
tonitis high-volume group.
Mitochondrial dysfunction has been suspected to contribute
to mortality in sepsis. We found that neither the models of sep-
sis nor the volume resuscitation strategy resulted in altered
hepatic or muscle mitochondrial complex I- and II-dependent
respiration. We cannot exclude sepsis-induced impairment of
mitochondrial function by mechanisms not tracked by our
methods [27-29]. Nevertheless, normal arterial lactate con-
centrations and hepatic vein lactate/pyruvate ratios in all
Figure 3
Histogram showing kidney histology and severity of damageHistogram showing kidney histology and severity of damage
Figure 4
Histogram showing kidney histology and distribution of colloid plaquesHistogram showing kidney histology and distribution of colloid plaques
Critical Care Vol 13 No 6 Brandt et al.
Page 10 of 11
(page number not for citation purposes)
groups do not seem to suggest major mitochondrial respira-
tion abnormality either. Recently, energetic failure of peripheral
blood mononuclear cells in sepsis has been implicated in the
modulation of immune response [30]. Nevertheless, how vol-
ume overload potentially aggravates early immune suppres-
sion remains unclear.
The relevance of our results for clinical sepsis deserves con-
sideration. Although both sepsis models have many similarities
with clinical sepsis, there are important differences, both in the
models per se and in the treatments tested. First, both models
included major abdominal surgery before induction of sepsis.
The impact of recent surgery on metabolic demands and
blood flow will inevitably be superimposed on the effects of
sepsis. Second, the volume support was started at the same
time that sepsis was induced, whereas clinical sepsis is typi-
cally associated with a delay in starting the treatment. Third,
early antibiotics improve the outcome of clinical sepsis, but
this was not included in our treatment. Fourth, hypotension not
responsive to fluids alone is treated with vasoactive agents in
clinical sepsis. As we did not use any inotropes or vasopres-
sors, this clearly limits the extrapolation of our results to clinical
sepsis.
Conclusions
We conclude that aggressive volume resuscitation initially
maintains systemic hemodynamics and regional blood flow in
experimental endotoxemia and fecal peritonitis. However, it
markedly increases mortality. Supplemental fluids should be
used only as long as tissue perfusion can be improved. Future
experiments should more closely mimic the natural course and
treatment of sepsis.
Competing interests
The authors declare that they have no competing interests.
Authors' contributions
SMJ and JT designed the study, supervised the experiments,
and revised the manuscript. SB, HB, FP, VK, JG, VK, and LBH
conducted the experiments, including anesthesia. SB drafted
the manuscript. TR performed the statistical analysis. TR, FP,
SD, and EB performed the mitochondrial experiments. SD and
UK performed the remaining laboratory analyses. LEB and GB
performed surgery and revised the manuscript. PL supervised
all laboratory analysis and revised the manuscript. LW per-
formed all histological analyses. All authors read and approved
the final manuscript.
Additional files
Acknowledgements
This research was supported by grant 3200BO/102268, made availa-
ble by the Swiss National Fund, Bern, Switzerland. We thank Ms.
Colette Boillat and Ms. Alice Zosso (Department of Pediatric Surgery,
Inselspital, Bern University Hospital and University of Bern) for technical
assistance, especially regarding histology, and Ms. Jeannie Wurz
(Department of Intensive Care Medicine) for editing the manuscript.
References
1. Dombrovskiy VY, Martin AA, Sunderram J, Paz HL: Rapid increase
in hospitalization and mortality rates for severe sepsis in the
United States: a trend analysis from 1993 to 2003. Crit Care
Med 2007, 35:1244-1250.
2. Weycker D, Akhras KS, Edelsberg J, Angus DC, Oster G: Long-
term mortality and medical care charges in patients with
severe sepsis. Crit Care Med 2003, 31:2316-2323.
3. Ruokonen E, Takala J, Kari A, Alhava E: Septic shock and multi-
ple organ failure. Crit Care Med 1991, 19:1146-1151.
4. Abraham E, Singer M: Mechanisms of sepsis-induced organ
dysfunction. Crit Care Med 2007, 35:2408-2416.
5. Vincent JL, De Backer D: Microvascular dysfunction as a cause
of organ dysfunction in severe sepsis. Crit Care 2005, 9(Suppl
4):S9-12.
Key messages
• Aggressive volume resuscitation increases mortality in
experimental sepsis.
• Mitochondrial complex I- or II-dependent muscle and
hepatic respiration is maintained after 24 hours of endo-
toxemia and fecal peritonitis.
The following Additional files are available online:
Additional file 1
A Word file containing a table that lists additional
methods, along with related references.
See />supplementary/cc8179-S1.rtf
Additional file 2
A Word file containing four tables. Table S1 lists acid-
base-balance and oxygen transport parameters. Table
S2 gives hepatic mitochondrial ATP/ADP and ADP/
oxygen ratios and calculated maximal ATP production
obtained from mitochondrial respiration analysis. Table
S3 lists skeletal muscle ATP content obtained from
biopsies and muscle ATP/ADP ratios. Table S4 gives
details of regional blood flows.
See />supplementary/cc8179-S2.rtf
Additional file 3
A PDF file containing six figures. Figure S1 is a
comparison of complex I- and II-dependent hepatic
mitochondrial respiration between the groups. Figure S2
shows lactate/pyruvate ratios in the hepatic vein. Figure
S3 is a comparison of complex I- and II-dependent
muscle mitochondrial respiration between the groups.
Figure 4 shows lung histology: colloid plaques. Figure
S5 shows lung histology: atelectasis. Figure S6 shows
liver histology.
See />supplementary/cc8179-S3.pdf
Available online />Page 11 of 11
(page number not for citation purposes)
6. Russell JA, Singer J, Bernard GR, Wheeler A, Fulkerson W, Hud-
son L, Schein R, Summer W, Wright P, Walley KR: Changing pat-
tern of organ dysfunction in early human sepsis is related to
mortality. Crit Care Med 2000, 28:3405-3411.
7. Rivers E, Nguyen B, Havstad S, Ressler J, Muzzin A, Knoblich B,
Peterson E, Tomlanovich M: Early goal-directed therapy in the
treatment of severe sepsis and septic shock. N Engl J Med
2001, 345:1368-1377.
8. Arlati S, Storti E, Pradella V, Bucci L, Vitolo A, Pulici M: Decreased
fluid volume to reduce organ damage: a new approach to burn
shock resuscitation? A preliminary study. Resuscitation 2007,
72:371-378.
9. Klein MB, Hayden D, Elson C, Nathens AB, Gamelli RL, Gibran
NS, Herndon DN, Arnoldo B, Silver G, Schoenfeld D, Tompkins
RG: The association between fluid administration and out-
come following major burn: a multicenter study. Ann Surg
2007, 245:622-628.
10. Sakka SG, Klein M, Reinhart K, Meier-Hellmann A: Prognostic
value of extravascular lung water in critically ill patients. Chest
2002, 122:2080-2086.
11. Sakr Y, Vincent JL, Reinhart K, Groeneveld J, Michalopoulos A,
Sprung CL, Artigas A, Ranieri VM: High tidal volume and posi-
tive fluid balance are associated with worse outcome in acute
lung injury. Chest 2005, 128:3098-3108.
12. Schuller D, Mitchell JP, Calandrino FS, Schuster DP: Fluid bal-
ance during pulmonary edema. Is fluid gain a marker or a
cause of poor outcome? Chest 1991, 100:1068-1075.
13. Vincent JL, Sakr Y, Sprung CL, Ranieri VM, Reinhart K, Gerlach H,
Moreno R, Carlet J, Le G Jr, Payen D: Sepsis in European inten-
sive care units: results of the SOAP study. Crit Care Med 2006,
34:344-353.
14. Wiedemann HP, Wheeler AP, Bernard GR, Thompson BT, Hayden
D, deBoisblanc B, Connors AFJ, Hite RD, Harabin AL: Compari-
son of two fluid-management strategies in acute lung injury. N
Engl J Med 2006, 354:2564-2575.
15. Deitch EA: Animal models of sepsis and shock: a review and
lessons learned. Shock 1998, 9:1-11.
16. Fink MP, Heard SO: Laboratory models of sepsis and septic
shock.
J Surg Res 1990, 49:186-196.
17. Dark PM, Singer M: The validity of trans-esophageal Doppler
ultrasonography as a measure of cardiac output in critically ill
adults. Intensive Care Med 2004, 30:2060-2066.
18. Losser MR, Forget AP, Payen D: Nitric oxide involvement in the
hemodynamic response to fluid resuscitation in endotoxic
shock in rats. Crit Care Med 2006, 34:2426-2431.
19. Dellinger RP, Levy MM, Carlet JM, Bion J, Parker MM, Jaeschke R,
Reinhart K, Angus DC, Brun-Buisson C, Beale R, Calandra T, Dhai-
naut JF, Gerlach H, Harvey M, Marini JJ, Marshall J, Ranieri M, Ram-
say G, Sevransky J, Thompson BT, Townsend S, Vender JS,
Zimmerman JL, Vincent JL: Surviving Sepsis Campaign: interna-
tional guidelines for management of severe sepsis and septic
shock: 2008. Crit Care Med 2008, 36:296-327.
20. Bendjelid K, Romand JA: Fluid responsiveness in mechanically
ventilated patients: a review of indices used in intensive care.
Intensive Care Med 2003, 29:352-360.
21. De Backer D, Heenen S, Piagnerelli M, Koch M, Vincent JL: Pulse
pressure variations to predict fluid responsiveness: influence
of tidal volume. Intensive Care Med 2005, 31:517-523.
22. Balogh Z, McKinley BA, Cocanour CS, Kozar RA, Valdivia A, Sail-
ors RM, Moore FA: Supranormal trauma resuscitation causes
more cases of abdominal compartment syndrome. Arch Surg
2003, 138:637-642. discussion 642-643
23. Lee LA, Nathens AB, Sires BS, McMurray MK, Lam AM: Blindness
in the intensive care unit: possible role for vasopressors?
Anesth Analg 2005, 100:192-195.
24. Payen D, de Pont AC, Sakr Y, Spies C, Reinhart K, Vincent JL: A
positive fluid balance is associated with a worse outcome in
patients with acute renal failure. Crit Care 2008, 12:R74.
25. Sevransky JE, Martin GS, Shanholtz C, Mendez-Tellez PA, Pronov-
ost P, Brower R, Needham DM: Mortality in sepsis versus non-
sepsis induced acute lung injury. Crit Care 2009, 13:R150.
26. Brunkhorst FM, Engel C, Bloos F, Meier-Hellmann A, Ragaller M,
Weiler N, Moerer O, Gruendling M, Oppert M, Grond S, Olthoff D,
Jaschinski U, John S, Rossaint R, Welte T, Schaefer M, Kern P,
Kuhnt E, Kiehntopf M, Hartog C, Natanson C, Loeffler M, Reinhart
K: Intensive insulin therapy and pentastarch resuscitation in
severe sepsis. N Engl J Med
2008, 358:125-139.
27. Vary TC: Increased pyruvate dehydrogenase kinase activity in
response to sepsis. Am J Physiol 1991, 260:E669-674.
28. Goldfarb RD, Marton A, Szabo E, Virag L, Salzman AL, Glock D,
Akhter I, McCarthy R, Parrillo JE, Szabo C: Protective effect of a
novel, potent inhibitor of poly(adenosine 5'-diphosphate-
ribose) synthetase in a porcine model of severe bacterial sep-
sis. Crit Care Med 2002, 30:974-980.
29. Crouser ED, Julian MW, Huff JE, Struck J, Cook CH: Carbamoyl
phosphate synthase-1: a marker of mitochondrial damage and
depletion in the liver during sepsis. Crit Care Med 2006,
34:2439-2446.
30. Belikova I, Lukaszewicz AC, Faivre V, Damoisel C, Singer M, Payen
D: Oxygen consumption of human peripheral blood mononu-
clear cells in severe human sepsis. Crit Care Med 2007,
35:2702-2708.
31. Knuesel R, Takala J, Brander L, Haenggi M, Bracht H, Porta F,
Jakob SM: Membrane microdialysis: Evaluation of a new
method to assess splanchnic tissue metabolism. Crit Care
Med 2006, 34:2638-2645.
32. Hoppel CL, Kerr DS, Dahms B, Roessmann U: Deficiency of the
reduced nicotinamide adenine dinucleotide dehydrogenase
component of complex I of mitochondrial electron transport.
Fatal infantile lactic acidosis and hypermetabolism with skel-
etal-cardiac myopathy and encephalopathy. J Clin Invest 1987,
80:71-77.
33. Johnson D: Isolation of liver and kidney mitochondria. In Meth-
ods in Enzymology Edited by: Estabrook RW, Pullman ME. New
York: Academic Press; 1967:94-96.
34. Ankarcrona M, Dypbukt JM, Bonfoco E, Zhivotovsky B, Orrenius S,
Lipton SA, Nicotera P: Glutamate-induced neuronal death: a
succession of necrosis or apoptosis depending on mitochon-
drial function. Neuron 1995, 15:961-973.
35. Krahenbuhl S, Stucki J, Reichen J: Mitochondrial function in car-
bon tetrachloride-induced cirrhosis in the rat. Qualitative and
quantitative defects. Biochem Pharmacol 1989, 38:1583-1588.
![Báo cáo Y học: Effect of adenosine 5¢-[b,c-imido]triphosphate on myosin head domain movements Saturation transfer EPR measurements without low-power phase setting ppt](https://media.store123doc.com/images/document/14/rc/vd/medium_vdd1395606111.jpg)