Báo cáo y học: " Clinical review: Scoring systems in the critically ill" ppsx
Bạn đang xem bản rút gọn của tài liệu. Xem và tải ngay bản đầy đủ của tài liệu tại đây (171.45 KB, 9 trang )
Introduction
Scoring systems used in critically ill patients can be
broadly divided into those that are specifi c for an organ
or disease (for example, the Glasgow Coma Scale (GCS))
and those that are generic for all ICU patients. In this
article, we focus on the generic scores, which can broadly
be divided into scores that assess disease severity on
admission and use it to predict outcome (for example,
Acute Physiology and Chronic Health Evaluation
(APACHE), Simplifi ed Acute Physiology Score (SAPS),
Mortality Probability Model (MPM)), scores that assess
the presence and severity of organ dysfunction (for
example, Multiple Organ Dysfunction Score (MODS),
Sequential Organ Failure Assessment (SOFA)), and
scores that assess nursing workload use (for example,
era peutic Intervention Scoring System (TISS), Nine
Equiva lents of Nursing Manpower Use Score (NEMS)).
e objective of this review is to give the intensivist
without any particular knowledge or expertise in this
area an overview of the current status of these
instruments and their possible applications. For a more
detailed explanation of the development, application and
limitations of these models, the reader is referred to a
recent review [1].
Outcome prediction scores
e original outcome prediction scores were developed
more than 25 years ago to provide an indication of the
risk of death of groups of ICU patients; they were not
designed for individual prognostication. Patient demo-
graphics, disease prevalence, and intensive care practice
have changed considerably since [2], and statistical and
computational techniques have also progressed. As a
result, all three of the major scores in this category have
been recently updated to ensure their continued accuracy
in today’s ICU (Table1).
Acute Physiology and Chronic Health Evaluation
e original APACHE score was developed in 1981 to
classify groups of patients according to severity of illness
and was divided into two sections: a physiology score to
assess the degree of acute illness; and a preadmission
evaluation to determine the chronic health status of the
patient [3]. In 1985, the original model was revised and
simplifi ed to create APACHE II [4], now the world’s most
widely used severity of illness score. In APACHE II, there
are just 12 physiological variables, compared to 34 in the
original score. e eff ects of age and chronic health status
are incorporated directly into the model, weighted
according to their relative impact, to give a single score
with a maximum of 71. e worst value recorded during
the fi rst 24 hours of a patient’s admission to the ICU is
used for each physiological variable. e principal
diagnosis leading to ICU admission is added as a category
weight so that the predicted mortality is computed based
on the patient’s APACHE II score and their principal
diagnosis at admission. e reason for ICU admission is,
therefore, an important variable in predicting mortality,
even when previous health status and the degree of acute
physiological dysfunction are similar.
APACHE III was developed in 1991 [5] and was
validated and further updated in 1998 [6]. Equations for
Abstract
General illness severity scores are widely used in the
ICU to predict outcome, characterize disease severity
and degree of organ dysfunction, and assess resource
use. In this article we review the most commonly used
scoring systems in each of these three groups. We
examine the history of the development of the initial
major systems in each group, discuss the construction
of subsequent versions, and, when available, provide
recent comparative data regarding their performance.
Importantly, the di erent types of scores should be
seen as complementary, rather than competitive and
mutually exclusive. It is possible that their combined
use could provide a more accurate indication of
disease severity and prognosis. All these scoring
systems will need to be updated with time as ICU
populations change and new diagnostic, therapeutic
and prognostic techniques become available.
© 2010 BioMed Central Ltd
Clinical review: Scoring systems in the critically ill
Jean-Louis Vincent*
1
and Rui Moreno
2
REVIEW
*Correspondence:
1
Department of Intensive Care, Erasme University Hospital, Route de Lennik 808,
1070 Brussels, Belgium
Full list of author information is available at the end of the article
Vincent and Moreno Critical Care 2010, 14:207
/>© 2010 BioMed Central Ltd
predicting risk-adjusted ICU length of stay were also
developed using the APACHE III model [7]. Most
recently, APACHE IV was developed using a database of
over 100,000 patients admitted to 104 ICUs in 45
hospitals in the USA in 2002/2003, and remodeling
APACHE III with the same physiological variables and
weights but diff erent predictor variables and refi ned
statistical methods [8]. APACHE IV again provides ICU
length of stay prediction equations, which can provide
benchmarks for the assessment and comparison of ICU
effi ciency and resource use [9].
Simpli ed Acute Physiology Score
SAPS, developed and validated in France in 1984, used 13
weighted physiological variables and age to predict risk of
death in ICU patients [10]. Like the APACHE scores,
SAPS was calculated from the worst values obtained
during the fi rst 24 hours of ICU admission. In 1993, Le
Gall and colleagues [11] used logistic regression analysis
to develop SAPS II, which includes 17 variables: 12
physiological variables, age, type of admission, and 3
variables related to underlying disease. e SAPS II score
was validated using data from consecutive admissions to
137 ICUs in 12 countries [11].
In 2005, a completely new SAPS model, the SAPS 3,
was created. Complex statistical techniques were used to
select and weight variables using a database of 16,784
patients from 303 ICUs in 35 countries [12]. e SAPS 3
score includes 20 variables divided into three subscores
related to patient characteristics prior to admission, the
circumstance of the admission, and the degree of
physiological derangement within 1 hour (in contrast to
the 24-hour time window in the SAPS II model) before or
after ICU admission. e total score can range from 0 to
217. Unlike the other scores, SAPS 3 includes customized
equations for prediction of hospital mortality in seven
geographical regions: Australasia; Central, South America;
Central, Western Europe; Eastern Europe; North Europe;
Southern Europe, Mediterranean; and North America. It
should be noted that the sample size for development of
some of these equations was relatively small, which may
compromise their prognostic accuracy. e SAPS 3 score
has been shown to exhibit good discrimination,
calibration, and goodness of fi t [12]. SAPS 3 has also been
used to examine variability in resource use between ICUs
using the standardized resource use parameter based on
the length of stay in the ICU adjusted for severity of acute
illness [13].
Mortality Probability Model
e fi rst MPM, developed from data from patients in one
ICU, consisted of an admission model using seven
admission variables, and a 24-hour model using seven
24-hour variables [14]. A revised MPM, MPM II, was
Vincent and Moreno Critical Care 2010, 14:207
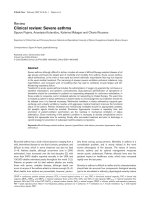
/>Table 1. Comparison of general outcome prediction models
APACHE SAPS APACHE II MPM
a
APACHE III SAPS II MPM II
b
SAPS 3 APACHE IV MPM III
Characteristics [3] [10] [4] [14] [5] [11] [15] [12] [8] [17]
Year 1981 1984 1985 1985 1991 1993 1993 2005 2006 2007
Countries 1 1 1 1 1 12 12 35 1 1
ICUs 2 8 13 1 40 137 140 303 104 135
Patients 705 679 5,815 2,783 17,440 12,997 19,124 16,784 110,558 124,855
Selection of Panel Panel Panel Multiple Multiple Multiple Multiple Multiple Multiple Multiple
variables and of of of logistic logistic logistic logistic logistic logistic logistic
their weights experts experts experts regression regression regression regression regression regression regression
Variables
Age No Yes Yes Yes Yes Yes Yes Yes Yes Yes
Origin No No No No Yes No No Yes Yes No
Surgical status No No Yes Yes Yes Yes Yes Yes Yes Yes
Chronic Yes No Yes Yes Yes Yes Yes Yes Yes Yes
health status
Physiology Yes Yes Yes Yes Yes Yes Yes Yes Yes Yes
Acute diagnosis No No Yes No Yes No Yes Yes Yes Yes
Number of variables 34 14 17 11 26 17 15
c
20 142 16
d
Score Yes Yes Yes No Yes Yes No Yes Yes No
Mortality prediction No No Yes Yes Yes Yes Yes Yes Yes Yes
a
These models are based on previous versions, developed by the same authors.
b
The numbers presented are those for the admission component of the model
(MPM
0
II).
c
MPM
24
II uses only 13 variables.
d
Plus 7 interaction terms. APACHE, Acute Physiology and Chronic Health Evaluation; SAPS, Simpli ed Acute Physiology
Score; MPM, Mortality Probability Model. Adapted from [64] with permission.
Page 2 of 9
developed in 1993 using logistic regression techniques on
a large database of 12,610 ICU patients from 12 countries
[15]. MPM II also consists of two scores: MPM
0
,
the
admission model, which contains 15 variables; and MPM
24
the 24-hour model, which contains 5 of the admission
variables and 8 additional variables and is designed for
patients who stay in the ICU for more than 24 hours.
Unlike the APACHE and SAPS systems where variables
are weighted, in MPM II each variable (except age, which
is entered as the actual age in years), is designated as
present or absent and given a score of 1 or 0 accordingly.
A logistic regression equation is then used to provide a
probability of hospital mortality. e authors also
developed a Weighted Hospital Days scale (WHD-94) by
subjectively assigning weights to days in the ICU and to
hospital days after ICU discharge from the fi rst ICU stay,
and an equation to predict an ICU’s mean WHD-94, thus
providing an index of resource utilization [16].
MPM
0
has recently been updated using a database of
124,885 patients from 135 ICUs in 98 hospitals (all in
North America except for one in Brazil) collected in 2001
to 2004 [17]. MPM
0
-III uses 16 variables, including 3
physiological parameters, obtained within 1 hour of ICU
admission to estimate mortality probability at hospital
discharge; the MPM
0
characterization is, therefore, based
on patient condition largely before ICU care begins. e
WHD-94 predictive equation has also been updated [18].
Discussion
Several studies have compared the diff erent outcome
prediction scoring systems. For example, in a study of
10,393 patients from Scottish ICUs, Livingston and
colleagues [19] compared the APACHE II and III, an
APACHE II using United Kingdom-derived coeffi cients
(UK APACHE II), SAPS II, and MPM
0
and MPM
24
. ese
authors reported that all models showed good discri mi-
nation, although observed mortality was signifi cantly
diff erent from that predicted by all models. SAPS II had
the best performance overall, but APACHE II had better
calibration. In a retrospective study of 11,300 patients
from 35 hospitals in California, Kuzniewicz and
colleagues [20] recently used logistic regression to
re-estimate the coeffi cients for the APACHE IV, MPM
0
-
III and SAPS II scores and applied the new equations to
assess risk-adjusted mortality rates. ese authors noted
that discrimination and calibration were adequate for all
models, with discrimination of APACHE IV slightly
better than that of the other two scores (area under the
receiver operating characteristic curve 0.892 for
APACHE IV, 0.873 for SAPS II, and 0.809 for MPM
0
III,
P<0.001).
In addition to using a more geographically hetero-
geneous database for development, the SAPS 3 model
attempted to address any geographic variation by
provid ing separate customized equations of diff erent
geographical regions. Nevertheless, local customization
may still help improve the calibration of these scores in
individual countries or regions as demonstrated for the
APACHE III in Cleveland, Ohio [21], or more recently for
the SAPS 3 score in Austria [22]. In a retrospective
analysis of prospectively collected data from a surgical
ICU, Sakr and colleagues [23] reported that the discri mi-
native ability of SAPS 3 was similar to that of APACHE II
and SAPS II (area under the receiver operating charac-
teristic curve 0.80 for APACHE II, 0.83 for SAPS II, and
0.84 for SAPS 3). All three scores had poor calibration,
which improved after customization to the local popu-
lation. In the UK, investigators have developed a new
scoring system specifi cally for use in UK ICU patients
[24]. is score uses elements of the APACHE, SAPS,
and MPM systems and was developed using the large
Intensive Care National Audit and Research Centre
(ICNARC) database and calibrated for adult critically ill
patients admitted to ICUs in the UK. It performed better
than SAPS II, APACHE II and III, and MPM II [24], but
has not been compared to the latest versions of these
scores.
When using these instruments, in addition to the issues
related to local customization and regular updates
discussed above, a few important limitations should be
kept in mind. First, all general outcome prediction
models can only at their best predict the behavior of a
group of patients that exactly matches the patients in the
development population. For example, the APACHE and
MPM scores were largely based on North American
popu lations and the SAPS score on European patients,
while SAPS 3 developers used a database that included a
geographically more heterogeneous group of patients
[12]. In addition, in most of the scores, specifi c
populations were excluded from the original databases
(for example, patients with burns, patients aged less than
16 or 18 years, patients with a very short length of ICU
stay, and so on).
Second, the accuracy of any scoring system is highly
dependent on the quality of the input. To be used
correctly, the defi nitions, time of data collection, rules for
missing data, and so on must exactly match those applied
when building the model. e reported reliability of the
systems (intra- and inter-observer) must also be taken
into account.
ird, there is an inherent bias in many of the derived
equations used to predict mortality in that they are
created from a limited population of patients from ICUs
that are specifi cally interested in measuring (and
improving) ICU performance.
Fourth, the outcome used in all these instruments is
the vital status at hospital discharge; consequently, the
use of other outcome measures (such as the vital status at
Vincent and Moreno Critical Care 2010, 14:207
/>Page 3 of 9
ICU discharge) will compromise the accuracy of the
predictive equations. Nevertheless, some models have
additional equations to assess use of resources, usually
measured as risk-adjusted, weighted, ICU- or hospital
days [9,13,18].
Fifth, the statistical methodology used to assess
calibration of a predictive model, most commonly the
Hosmer-Lemeshow statistic, may be infl uenced by
various factors, including the number of covariates being
assessed, the manner in which observations with equal
probabilities of outcome are sorted, and the sample size
(both small and large) [25]. Interpretation of the accuracy
of predictive models should, therefore, include some
knowledge of the statistical tests used. Diff erent statistical
techniques may be required for the larger models
increasingly used to develop predictive models, such as
the use of calibration graphs and, more recently, the Cox
test of calibration and related statistics [26].
Sixth, despite the fact that predictive models have been
developed in large populations, in almost all cases when
they are applied to new populations calibration deterior-
ates, although discrimination hardly changes. Two recent
examples of this eff ect were given in validation studies of
SAPS 3 in Austria and in Italy [22,27].
Seventh, the use of automatic patient data management
systems can, by changing the sampling rate for the
physiological variables, change the accuracy of the model.
Bosman and colleagues [28] reported that predicted
mortality was greater with data management charting
than with manual charting for APACHE II, SAPS II, and
MPM II.
Organ dysfunction scores
Organ failure scores are primarily designed to describe
the degree of organ dysfunction rather than to predict
survival. e severity of organ dysfunction varies widely
among individuals and within an individual over time
and organ failure scores must be able to take both time
and severity into account. Many organ dysfunction scores
have been developed over the past few decades, but we
will limit our discussion to three of the scores most
commonly used in general ICU patients: the Logistic
Organ Dysfunction System (LODS) [29], MODS [30],
and SOFA [31] (Table2).
Logistic Organ Dysfunction Score
e LODS was developed using a database of 13,152
admissions to 137 ICUs in 12 countries [29]. Using
multiple logistic regression, 12 variables were selected to
represent the function of six organ systems (neurologic,
cardiovascular, renal, pulmonary, hematologic, hepatic).
e worst value for each variable in the fi rst 24 hours of
admission is recorded, and for each system, a score of 0
(no dysfunction) to 5 (maximum dysfunction) is awarded.
Unlike the MODS and SOFA scores, LODS is a weighted
system: for the respiratory and coagulation systems, the
maximum score allowed is 3, and for the liver the
maximum score is 1. LODS values, therefore, can range
from 0 to 22.
e LODS lies somewhere between a mortality predic-
tion score and an organ failure score as it combines a
global score summarizing the total degree of organ
dysfunction across the organ systems, and a logistic
regression equation that can be used to convert the score
into a probability of mortality. Within organ systems,
greater severity of organ dysfunction was consistently
associated with higher mortality [32], and a LODS of 22
was associated with a mortality of 99.7% [29]. e LODS
was not initially validated for repeated use during the ICU
stay, but in a study of 1,685 patients in French ICUs, the
Vincent and Moreno Critical Care 2010, 14:207
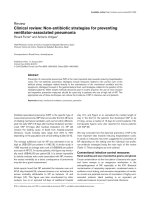
/>Table 2. Comparison of three organ dysfunction scores
Characteristics LODS [29] MODS [30] SOFA [31]
Year of publication 1996 1995 1996
Selection of variables and their weights Multiple logistic regression Literature review and logistic Panel of experts
regression
Variables used to assess organ dysfunction
Neurologic Glasgow Coma Scale Glasgow Coma Scale Glasgow Coma Scale
Cardiovascular Heart rate, systolic blood Pressure-adjusted heart rate Mean arterial blood pressure,
pressure vasopressor use
Renal Serum urea or urea nitrogen, Serum creatinine Serum creatinine, urine output
creatinine, urine output
Respiratory PaO
2
/FiO
2
ratio, mechanical PaO
2
/FiO
2
ratio PaO
2
/FiO
2
ratio, mechanical
ventilation ventilation
Hematologic White blood cell count, Platelet count Platelet count
platelet count
Hepatic Serum bilirubin, prothrombin time Serum bilirubin Serum bilirubin
LODS, Logistic Organ Dysfunction Score; MODS, Multiple Organ Dysfunction Score; SOFA, Sequential Organ Dysfunction Score.
Page 4 of 9
LODS was accurate in characterizing the progression of
organ dysfunction during the fi rst week of ICU stay [33].
Multiple Organ Dysfunction Score
e development of the MODS was based on a literature
review of 30 publications that had characterized organ
dysfunction [30,34]. Seven organ systems were then
selected for further consideration (respiratory, cardio-
vascular, renal, hepatic, hematological, central nervous
system, gastrointestinal), and variables for each organ
system were chosen according to a set of ‘ideal descriptor’
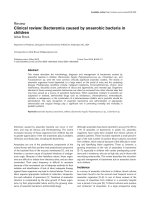
criteria (Table 3). No accurate descriptor of gastro-
intestinal function could be identifi ed, so this system was
not included in the fi nal model. For the cardiovascular
system, Marshall and colleagues [30] created a composite
variable, the pressure-adjusted heart rate (heart rate ×
central venous pressure/mean arterial pressure); in
patients without a central line, this variable is assumed to
be normal. For each of the six organs, the fi rst parameters
of the day are used to calculate the score and a score of 0
(normal) to 4 (most dysfunction) is awarded, giving a
total maximum score of 24. e score was developed in
336 patients admitted to one surgical ICU and validated
in 356 patients admitted to the same ICU [30]. Although
not designed to predict ICU mortality, increasing MODS
values do correlate with ICU outcome [30]. ICU mortality
also increases with increasing numbers of failing organ
systems [30,35]. e delta MODS, defi ned as the
diff erence between the MODS at admission and the
maximum score, may be more predictive of outcome
than individual scores [30].
Sequential Organ Failure Assessment
e SOFA was developed in 1994 during a consensus
conference [31]. Six organ systems (respiratory, cardio-
vascular, renal, hepatic, central nervous, coagulation)
were selected based on a review of the literature, and the
function of each is scored from 0 (normal function) to 4
(most abnormal), giving a possible score of 0 to 24. Unlike
the MODS score in which the fi rst value of each day is
used, for the SOFA score, the worst value on each day is
recorded. Another key diff erence is in the cardiovascular
component; instead of the composite variable, the SOFA
score uses a treatment-related variable (dose of vaso-
pressor agents). is is not ideal, as treatment protocols
vary among institutions, among patients and over time,
but it is diffi cult to avoid, especially for the cardiovascular
system.
e SOFA was initially validated in a mixed, medical-
surgical ICU population [31,36] and has since been
validated and applied in various patient groups [37-39].
In a prospective analysis of 1,449 patients, a maximum
total SOFA score greater than 15 correlated with a
mortality rate of 90% [40]. Changes in SOFA score over
time are also useful in predicting outcome. In a
prospective study of 352 ICU patients, an increase in
SOFA score during the fi rst 48 hours in the ICU,
independent of the initial score, predicted a mortality
rate of at least 50%, while a decrease was associated with
an ICU mortality rate of just 27% [41]. In a prospective
observational study of 1,340 patients with multiple organ
dysfunction syndrome, Cabrè and colleagues [42]
reported 100% mortality for patients with age over
60years, a total maximum SOFA greater than 13 on any
of the fi rst 5 days of ICU admission, minimum SOFA
greater than 10 at all times, and a positive or unchanged
SOFA trend over the fi rst 5 days of ICU admission.
Discussion
Several studies have directly compared the various organ
dysfunction scoring systems. Pettilä and colleagues [43]
reported comparable discriminative power of APACHE
III, LODS, SOFA, and MODS to predict hospital
mortality in a single center study. Peres Bota and
colleagues [44] reported no signifi cant diff erences between
MODS and SOFA for mortality prediction in 949 general
ICU patients. However, when using the cardio vascular
component, outcome prediction was better for the SOFA
score at all time intervals compared to the MODS, a
fi nding confi rmed by other studies [45]. In a multicenter
study, Timsit and colleagues [33] reported good accuracy
and internal consistency for both the SOFA and LODS.
However, in a Canadian study of 1,436 ICU patients [45],
SOFA and MODS had only a modest ability to
discri minate
between survivors and non-survivors. More recently, SOFA
was reported to have superior discrimi native ability for
Vincent and Moreno Critical Care 2010, 14:207
/>Table 3. ‘Ideal’ descriptors of organ dysfunction in ICU
patients
Simple and inexpensive
Routinely available in all ICUs
Reliable (intra and inter-observer)
Objective (that is, observer independent)
Speci c to the function of the organ in question
Therapy independent
Sequential (available at ICU admission or shortly thereafter and then at xed
periods of time)
Not a ected by transient, reversible abnormalities associated with
therapeutic or practical interventions
Re ect acute dysfunction of the organ in question but not chronic
dysfunction
Reproducible in large, heterogeneous groups of ICU patients
Reproducible in several types of ICUs from di erent regions of the globe
Abnormal in one direction only
Using continuous rather than dichotomous variables
Modi ed from [34].
Page 5 of 9
hospital mortality and unfavorable neurologic outcome
compared to MODS in patients with brain injury [46].
Severity assessment based on nursing workload use
The Therapeutic Intervention Scoring System (TISS)
TISS was originally developed in 1974 to assess severity
of illness and compare patient care based on the
measurement of nursing workload [47]. e original
score included 57 therapeutic activities with points
assigned for each activity conducted during a 24-hour
period; higher values were given for more specialized or
time-consuming activities. In 1983, the score was
updated and expanded to include 76 items [48]. However,
TISS-76 was criticized for being too time-consuming and
cumbersome, and in 1996, a simplifi ed version was
devised using advanced statistical analysis [49]. TISS-28
includes just 28 items, divided into 7 groups: basic
activities, ventilatory support, cardiovascular support,
renal support, neurological support, metabolic support,
and specifi c interventions. e scoring is weighted to
give a total score of 78. TISS-28 was validated in 22
Dutch ICUs [49] and in 19 ICUs in Portugal [50].
According to this system, each nurse can provide care for
46.35 TISS-28 points per shift, with each TISS-28 point
requiring 10.6 minutes of each nurse’s shift. is
information can be useful for planning the allocation of
nursing manpower, to evaluate the effi cacy in the use of
nursing workload use and to objectively classify ICUs
based on the amount (and not the complexity) of care
provided [51].
Nine Equivalents of Nursing Manpower Use Score
NEMS was derived from the TISS-28 with the aim of
creating a simpler system that would be more widely
used [52]. Nursing activities are separated into nine
categories: basic monitoring, intravenous medication,
mechanical ventilatory support, supplementary venti la-
tory care, single vasoactive medication, multiple vaso-
active medication, dialysis techniques, specifi c inter-
ventions in the ICU, specifi c interventions outside the
ICU. Each of these is awarded weighted points, giving a
maximum score of 56. NEMS has been validated in large
cohorts of ICU patients and is easy to use with almost no
interrater variability [53]. Again, this system can be used to
evaluate the effi cacy of nursing workload use at the ICU
level so as to objectively classify ICUs based on the amount
(and not only on the complexity) of care provided [51].
Nursing Activities Score
Based on the TISS-28, the Nursing Activities Score
(NAS) includes several additional nursing activities not
necessarily related to the severity of illness of the patients
[54]. e list of items was developed by consensus. e
average time consumption of the activities was
deter mined from a 1-week observational cross-sectional
study and the results compared with those of the TISS-28
items in a cohort of 99 ICUs in 15 countries. At the end
of this process, a total of fi ve new items and 14 sub-items
describing nursing activities in the ICU (for example,
monitoring, care of relatives, administrative tasks) were
added to the TISS-28 list. e new activities accounted
for 60% of the average nursing time; and in the
development study, NAS activities accounted for 81% of
the nursing time (versus 43% in TISS-28) [54].
Discussion
ese scores have been used mainly to assess nurse
staffi ng in the ICU, although higher scores are associated
with worse outcomes [55,56]. All the scores are limited
by the items included, and can be prone to subjective
interpretation and infl uenced by patient case-mix, local
admission and discharge policies, and local management
protocols. Use of these scores to compare units may,
therefore, be diffi cult; however, within a unit they can
provide a valuable indication of changing workload
needs. ese scores may also be used to estimate overall
costs for groups of ICU patients, although they are less
reliable on an individual patient basis [57]. Instruments,
such as the Work Utilization Ratio, which evaluates the
total number of points actually scored divided by the
total possible points, have been proposed to evaluate the
eff ectiveness of the use of nursing workload resources
[51]. A recent position statement by the European
Federa tion of Critical Care Nursing Associations recom-
mends that all units use such a system on a regular basis
to monitor the effi ciency of the use of nursing manpower
[58].
Other uses of scoring systems
In addition to their use in outcome prediction, organ
function assessment, and nursing workload evaluation
discussed above, scoring systems have several other
potential uses, including use in clinical trials for case-mix
comparisons and use in the assessment and comparison
of ICU quality and performance.
Clinical trials
Scoring systems are increasingly being incorporated into
clinical trial design. Outcome prediction scores, such as
APACHE and SAPS, have been used for some time to
compare patient populations in clinical trials and even
for the identifi cation of eligible patients for inclusion. e
analysis of results from one recent randomized controlled
study [59], which showed improved outcomes in patients
with higher APACHE II scores, led to the drug under
investigation, drotrecogin alfa (activated), being licensed
in the United States for use only in patients with severe
sepsis who are at a high risk of death, that is, those with
Vincent and Moreno Critical Care 2010, 14:207
/>Page 6 of 9
an APACHE II score above 25. However, this is a
controversial approach and these scores were not
designed for this purpose [60].
e realization that mortality alone is inadequate as an
outcome measure for interventional studies in ICU
patients has led many trials, especially in sepsis, to
include an organ dysfunction score as part of ongoing
patient assessment so that eff ects on morbidity can also
be evaluated. Increased economic pressure has also led to
greater concerns about cost-eff ectiveness of new and
established interventions and nursing workload scores
are also being incorporated into clinical trial design,
particularly for interventions likely to impact on nursing
workload.
Assessment of ICU performance
Costs of care for an ICU patient have been estimated as
being three times the costs of care for a general ward
patient [61]. Monitoring ICU performance is, therefore,
increasingly important in the fi ght to control hospital
expenses. While crude mortality data may off er some
global guidance as to ICU performance, adjusting
mortality rates according to disease severity, by using
outcome prediction scores to calculate the standardized
mortality ratio, can help improve quality assessment.
Such severity-adjusted indicators can be used to assess
performance of a single ICU over time or to compare
several or more units. However, this approach has several
limitations, including potential eff ects of pre-ICU
admission factors, implications of diff erent ICU discharge
policies [62], and eff ects of diff erent patient case-mix and
hence disease severity between units or in the same unit
at diff erent times [63]. Nevertheless, there are large
variations in risk-adjusted mortality rates among hospi-
tals [20] and repeated quality assessment may help
determine the reasons underlying these diff erences and
enable programs to be developed to improve
perfor mance.
Conclusions
General illness severity scores are widely used in the ICU
to assess resource use, predict outcome, and characterize
disease severity and degree of organ dysfunction. All the
scores were developed to be used in mixed groups of ICU
patients and their accuracy in subgroups of patients can
be questioned; disease-specifi c scoring systems are
increasingly being developed. As ICU populations
change and new diagnostic, therapeutic and prognostic
techniques become available, all the scoring systems will
need to be updated. Importantly, the diff erent scoring
systems have diff erent purposes and measure diff erent
parameters; we believe they should be seen as comple-
menting each other, rather than competing with one
another. For example, outcome prediction models cannot
be used to assess the severity of individual organ
dysfunctions or to monitor patient progress over time.
Although organ dysfunction scores correlate with
outcomes, this is not what they were developed for and
outcome prediction should be left to scores such as the
APACHE and SAPS systems. e workload scores
complete the picture by off ering information on how the
patient’s disease will impact on staffi ng requirement and
resource use. We envisage that, increasingly, all patients
will be initially evaluated using a general outcome predic-
tion model computed on admission or within the fi rst 24
hours, then by repeated organ failure (for example,
SOFA) and nursing workload (for example, TISS-28)
scores during their ICU stay. When used together, these
three approaches could provide a more accurate
indication of disease severity and prognosis, which could
be of help both to the clinician in charge of the patient
and to the manager involved in resource allocation and
performance assessment.
Abbreviations
APACHE = Acute Physiology and Chronic Health Evaluation; LODS = Logistic
Organ Dysfunction Score; MODS = Multiple Organ Dysfunction Score;
MPM= Mortality Probability Model; NAS = Nursing Activities Score; NEMS=
Nine Equivalents of Nursing Manpower Use Score; SAPS = Simpli ed Acute
Physiology Score; SOFA = Sequential Organ Failure Assessment; TISS =
Therapeutic Intervention Scoring System; WHD-94 = Weighted Hospital Days
scale.
Author details
1
Department of Intensive Care, Erasme University Hospital, Route de Lennik
808, 1070 Brussels, Belgium.
2
Department of Intensive Care, Hospital de St
Antonio dos Capuchos, Centro Hospitalar de Lisboa Central, EPE, 1169-050
Lisbon, Portugal.
Competing interests
The authors declare that they have no competing interests.
Published: 26 March 2010
References
1. Moreno RP: Outcome prediction in intensive care: why we need to
reinvent the wheel. Curr Opin Crit Care 2008, 14:483-484.
2. Moreno R, Jordan B, Metnitz P: The changing prognostic determinants in
the critically ill patient. In 2007 Yearbook of Intensive care and Emergency
Medicine. Edited by Vincent JL. Heidelberg: Springer; 2007:899-907.
3. Knaus WA, Zimmerman JE, Wagner DP, Draper EA, Lawrence DE: APACHE-
acute physiology and chronic health evaluation: a physiologically based
classi cation system. Crit Care Med 1981, 9:591-597.
4. Knaus WA, Draper EA, Wagner DP, Zimmerman JE: APACHE II: A severity of
disease classi cation system. Crit Care Med 1985, 13:818-829.
5. Knaus WA, Wagner DP, Draper EA, Zimmerman JE, Bergner M, Bastos PG, Sirio
CA, Murphy DJ, Lotring T, Damiano A, Harrell FE: The APACHE III prognostic
system: Risk prediction of hospital mortality for critically ill hospitalized
adults. Chest 1991, 100:1619-1636.
6. Zimmerman JE, Wagner DP, Draper EA, Wright L, Alzola C, Knaus WA:
Evaluation of acute physiology and chronic health evaluation III
predictions of hospital mortality in an independent database. Crit Care
Med 1998, 26:1317-1326.
7. Knaus WA, Wagner DP, Zimmerman JE, Draper EA: Variations in mortality
and length of stay in intensive care units. Ann Intern Med 1993, 118:753-761.
8. Zimmerman JE, Kramer AA, McNair DS, Malila FM: Acute Physiology and
Chronic Health Evaluation (APACHE) IV: hospital mortality assessment for
today’s critically ill patients. Crit Care Med 2006, 34:1297-1310.
9. Zimmerman JE, Kramer AA, McNair DS, Malila FM, Sha er VL: Intensive care
unit length of stay: Benchmarking based on Acute Physiology and
Vincent and Moreno Critical Care 2010, 14:207
/>Page 7 of 9
Chronic Health Evaluation (APACHE) IV. Crit Care Med 2006, 34:2517-2529.
10. Le Gall J-R, Loirat P, Alperovitch A, Glaser P, Granthil C, Mathieu D, Mercier P,
Thomas R: A simpli ed acute physiology score for ICU patients. Crit Care
Med 1984, 12:975-977.
11. Le Gall J-R, Lemeshow S, Saulnier F: A new simpli ed acute physiology
score (SAPS II) based on a European/North American multicenter study.
JAMA 1993, 270:2957-2963.
12. Moreno RP, Metnitz PG, Almeida E, Jordan B, Bauer P, Campos RA, Iapichino G,
Edbrooke D, Capuzzo M, Le Gall JR: SAPS 3 - from evaluation of the patient
to evaluation of the intensive care unit. Part 2: Development of a
prognostic model for hospital mortality at ICU admission. Intensive Care
Med 2005, 31:1345-1355.
13. Rothen HU, Stricker K, Einfalt J, Bauer P, Metnitz PG, Moreno RP, Takala J:
Variability in outcome and resource use in intensive care units. Intensive
Care Med 2007, 33:1329-1336.
14. Lemeshow S, Teres D, Pastides H, Avrunin JS, Steingrub JS: A method for
predicting survival and mortality of ICU patients using objectively derived
weights. Crit Care Med 1985, 13:519-525.
15. Lemeshow S, Teres D, Klar J, Avrunin JS, Gehlbach SH, Rapoport J: Mortality
Probability Models (MPM II) based on an international cohort of intensive
care unit patients. JAMA 1993, 270:2478-2486.
16. Rapoport J, Teres D, Lemeshow S, Gehlbach S: A method for assessing the
clinical performance and cost-e ectiveness of intensive care units: a
multicenter inception cohort study. Crit Care Med 1994, 22:1385-1391.
17. Higgins TL, Teres D, Copes WS, Nathanson BH, Stark M, Kramer AA: Assessing
contemporary intensive care unit outcome: an updated Mortality
Probability Admission Model (MPM0-III). Crit Care Med 2007, 35:827-835.
18. Nathanson BH, Higgins TL, Teres D, Copes WS, Kramer A, Stark M: A revised
method to assess intensive care unit clinical performance and resource
utilization. Crit Care Med 2007, 35:1853-1862.
19. Livingston BM, MacKirdy FN, Howie JC, Jones R, Norrie JD: Assessment of the
performance of ve intensive care scoring models within a large Scottish
database. Crit Care Med 2000, 28:1820-1827.
20. Kuzniewicz MW, Vasilevskis EE, Lane R, Dean ML, Trivedi NG, Rennie DJ, Clay T,
Kotler PL, Dudley RA: Variation in ICU risk-adjusted mortality: impact of
methods of assessment and potential confounders. Chest 2008,
133:1319-1327.
21. Sirio CA, Shepardson LB, Rotondi AJ, Cooper GS, Angus DC, Harper DL,
Rosenthal GE: Community-wide assessment of intensive care outcomes
using a physiologically based prognostic measure: implications for critical
care delivery from Cleveland Health Quality Choice. Chest 1999,
115:793-801.
22. Metnitz B, Schaden E, Moreno R, Le Gall JR, Bauer P, Metnitz PG: Austrian
validation and customization of the SAPS 3 Admission Score. Intensive Care
Med 2009, 35:616-622.
23. Sakr Y, Krauss C, Amaral AC, Rea-Neto A, Specht M, Reinhart K, Marx G:
Comparison of the performance of SAPS II, SAPS 3, APACHE II, and their
customized prognostic models in a surgical intensive care unit. Br J
Anaesth 2008, 101:798-803.
24. Harrison DA, Parry GJ, Carpenter JR, Short A, Rowan K: A new risk prediction
model for critical care: the Intensive Care National Audit & Research
Centre (ICNARC) model. Crit Care Med 2007, 35:1091-1098.
25. Kramer AA, Zimmerman JE: Assessing the calibration of mortality
benchmarks in critical care: The Hosmer-Lemeshow test revisited. Crit Care
Med 2007, 35:2052-2056.
26. Miller ME, Hui SL, Tierney WM: Validation techniques for logistic regression
models. Stat Med 1991, 10:1213-1226.
27. Poole D, Rossi C, Anghileri A, Giardino M, Latronico N, Radrizzani D, Langer M,
Bertolini G: External validation of the Simpli ed Acute Physiology Score
(SAPS) 3 in a cohort of 28,357 patients from 147 Italian intensive care
units. Intensive Care Med 2009, 35:1916-1924.
28. Bosman RJ, Oudemane van Straaten HM, Zandstra DF: The use of intensive
care information systems alters outcome prediction. Intensive Care Med
1998, 24:953-958.
29. Le Gall JR, Klar J, Lemeshow S, Saulnier F, Alberti C, Artigas A, Teres D, ICU
Scoring Group.: The logistic organ dysfunction system: A new way to
assess organ dysfunction in the intensive care unit. JAMA 1996,
276:802-810.
30. Marshall JC, Cook DJ, Christou NV, Bernard GR, Sprung CL, Sibbald WJ:
Multiple organ dysfunction score: A reliable descriptor of a complex
clinical outcome. Crit Care Med 1995, 23:1638-1652.
31. Vincent JL, Moreno R, Takala J, Willatts S, de Mendonça A, Bruining H, Reinhart
CK, Suter PM, Thijs LG: The SOFA (Sepsis-related Organ Failure Assessment)
score to describe organ dysfunction/failure. Intensive Care Med 1996,
22:707-710.
32. Metnitz PG, Lang T, Valentin A, Steltzer H, Krenn CG, Le Gall JR: Evaluation of
the logistic organ dysfunction system for the assessment of organ
dysfunction and mortality in critically ill patients. Intensive Care Med 2001,
27:992-998.
33. Timsit JF, Fosse JP, Troche G, De Lassence A, Alberti C, Garrouste-Org,
Bornstain C, Adrie C, Cheval C, Chevret S: Calibration and discrimination by
daily Logistic Organ Dysfunction scoring comparatively with daily
Sequential Organ Failure Assessment scoring for predicting hospital
mortality in critically ill patients. Crit Care Med 2002, 30:2003-2013.
34. Marshall JC: Multiple organ dysfunction syndrome. In Clincial Trials for the
Treatment of Sepsis. Edited by Sibbald WJ, Vincent JL. Heidelberg: Springer-
Verlag; 1995:122-138.
35. Cook R, Cook D, Tilley J, Lee K, Marshall J: Multiple organ dysfunction:
baseline and serial component scores. Crit Care Med 2001, 29:2046-2050.
36. Moreno R, Vincent JL, Matos A, de Mendonça A, Cantraine F, Thijs J, Takala J,
Sprung C, Antonelli M, Bruining H, Willatts S: The use of maximum SOFA
score to quantify organ dysfunction/failure in intensive care. Results of a
prospective, multicentre study. Intensive Care Med 1999, 25:686-696.
37. Ceriani R, Mazzoni M, Bortone F, Gandini S, Solinas C, Susini G, Parodi O:
Application of the sequential organ failure assessment score to cardiac
surgical patients. Chest 2003, 123:1229-1239.
38. Lorente JA, Vallejo A, Galeiras R, Tomicic V, Zamora J, Cerda E, De La Cal MA,
Esteban A: Organ dysfunction as estmated by the SOFA score is related to
outcome in critically ill burned patients. Shock 2009, 31:125-131.
39. Vosylius S, Sipylaite J, Ivaskevicius J: Sequential organ failure assessment
score as the determinant of outcome for patients with severe sepsis. Croat
Med J 2004, 45:715-720.
40. Vincent JL, de Mendonça A, Cantraine F, Moreno R, Takala J, Suter P, Sprung C,
Colardyn FC, Blecher S: Use of the SOFA score to assess the incidence of
organ dysfunction/failure in intensive care units: Results of a multicentric,
prospective study. Crit Care Med 1998, 26:1793-1800.
41. Lopes Ferreira F, Peres Bota D, Bross A, Melot C, Vincent JL: Serial evaluation
of the SOFA score to predict outcome. JAMA 2001, 286:1754-1758.
42. Cabrè L, Mancebo J, Solsona JF, Saura P, Gich I, Blanch L, Carrasco G, Martin
MC: Multicenter study of the multiple organ dysfunction syndrome in
intensive care units: the usefulness of Sequential Organ Failure
Assessment scores in decision making. Intensive Care Med 2005, 31:927-933.
43. Pettilä V, Pettila M, Sarna S, Voutilainen P, Takkunen O: Comparison of
multiple organ dysfunction scores in the prediction of hospital mortality
in the critically ill. Crit Care Med 2002, 30:1705-1711.
44. Peres BD, Melot C, Lopes FF, Nguyen B, V, Vincent JL: The Multiple Organ
Dysfunction Score (MODS) versus the Sequential Organ Failure
Assessment (SOFA) score in outcome prediction. Intensive Care Med 2002,
28:1619-1624.
45. Zygun DA, Laupland KB, Fick GH, Sandham JD, Doig CJ: Limited ability of
SOFA and MOD scores to discriminate outcome: a prospective evaluation
in 1,436 patients. Can J Anaesth 2005, 52:302-308.
46. Zygun D, Berthiaume L, Laupland K, Kortbeek J, Doig C: SOFA is superior to
MOD score for the determination of non-neurologic organ dysfunction in
patients with severe traumatic brain injury: a cohort study. Crit Care 2006,
10:R115.
47. Cullen DJ, Civetta JM, Briggs BA, Ferrara LC: Therapeutic intervention
scoring system: a method for quantitative comparison of patient care. Crit
Care Med 1974, 2:57-60.
48. Keene AR, Cullen DJ: Therapeutic intervention scoring system: Update
1983. Crit Care Med 1983, 11:1-3.
49. Miranda DR, de Rijk A, Schaufeli W: Simpli ed Therapeutic Intervention
Scoring System: the TISS-28 items - results from a multicenter study. Crit
Care Med 1996, 24:64-73.
50. Moreno R, Morais P: Validation of the simpli ed therapeutic intervention
scoring system on an independent database. Intensive Care Med 1997,
23:640-644.
51. Moreno R, Reis MD: Nursing sta in intensive care in Europe: the mismatch
between planning and practice. Chest 1998, 113:752-758.
52. Reis MD, Moreno R, Iapichino G: Nine equivalents of nursing manpower use
score (NEMS). Intensive Care Med 1997, 23:760-765.
53. Rothen HU, Kung V, Ryser DH, Zurcher R, Regli B: Validation of “nine
Vincent and Moreno Critical Care 2010, 14:207
/>Page 8 of 9
equivalents of nursing manpower use score” on an independent data
sample. Intensive Care Med 1999, 25:606-611.
54. Miranda DR, Nap R, de Rijk A, Schaufeli W, Iapichino G: Nursing activities
score. Crit Care Med 2003, 31:374-382.
55. Padilha KG, Sousa RM, Kimura M, Miyadahira AM, da Cruz DA, Vattimo MF,
Fusco SR, de Campos ME, Mendes EM, Mayor ER: Nursing workload in
intensive care units: a study using the Therapeutic Intervention Scoring
System-28 (TISS-28). Intensive Crit Care Nurs 2007, 23:162-169.
56. Padilha KG, de Sousa RM, Queijo AF, Mendes AM, Reis MD: Nursing Activities
Score in the intensive care unit: analysis of the related factors. Intensive Crit
Care Nurs 2008, 24:197-204.
57. Dickie H, Vedio A, Dundas R, Treacher DF, Leach RM: Relationship between
TISS and ICU cost. Intensive Care Med 1998, 24:1009-1017.
58. European Federation of Critical Care Nursing Associations: Position
Statement on Workforce Requirements Within European Critical Care
Nursing. 2007 [ />Statement%20Workforce%20EfCCNa%202007.pdf]
59. Bernard GR, Vincent JL, Laterre PF, LaRosa SP, Dhainaut JF, Lopez-Rodriguez A,
Steingrub JS, Garber GE, Helterbrand JD, Ely EW, Fisher CJ Jr: E cacy and
safety of recombinant human activated protein C for severe sepsis. N Engl
J Med 2001, 344:699-709.
60. Vincent JL, Opal SM, Marshall JC: Ten reasons why we should NOT use
severity scores as entry criteria for clinical trials or in our treatment
decisions. Crit Care Med 2010, 38:283-287.
61. Cooper LM, Linde-Zwirble WT: Medicare intensive care unit use: analysis of
incidence, cost, and payment. Crit Care Med 2004, 32:2247-2253.
62. Kahn JM, Kramer AA, Rubenfeld GD: Transferring critically ill patients out of
hospital improves the standardized mortality ratio: a simulation study.
Chest 2007, 131:68-75.
63. Glance LG, Osler T, Shinozaki T: E ect of varying the case mix on the
standardized mortality ratio and W statistic: A simulation study. Chest
2000, 117:1112-1117.
64. Moreno R, Metnitz P: Tools for the evaluation of patients and intensive care
units. In Principles of Diagnosis and Management in the Adult. Edited by Parrillo
JE, Dellinger RP. Philadelphia: Mosby, Elsevier; 2008:1547-1565.
Vincent and Moreno Critical Care 2010, 14:207
/>doi:10.1186/cc8204
Cite this article as: Vincent J-L, Moreno R: Scoring systems in the critically ill.
Critical Care 2010, 14:207.
Page 9 of 9