Báo cáo y học: "PEEP titration guided by ventilation homogeneity: a feasibility study using electrical impedance tomography" ppt
Bạn đang xem bản rút gọn của tài liệu. Xem và tải ngay bản đầy đủ của tài liệu tại đây (639.88 KB, 8 trang )
Zhao et al. Critical Care 2010, 14:R8
/>Open Access
RESEARCH
© 2010 Zhao et al.; licensee BioMed Central Ltd. This is an open access article distributed under the terms of the Creative Commons
Attribution License ( which permits unrestricted use, distribution, and reproduction in
any medium, provided the original work is properly cited.
Research
PEEP titration guided by ventilation homogeneity:
a feasibility study using electrical impedance
tomography
Zhanqi Zhao*
1,2
, Daniel Steinmann
2
, Inéz Frerichs
3
, Josef Guttmann
2
and Knut Möller
1
Abstract
Introduction: Lung protective ventilation requires low tidal volume and suitable positive end-expiratory pressure
(PEEP). To date, few methods have been accepted for clinical use to set the appropriate PEEP. The aim of this study was
to test the feasibility of PEEP titration guided by ventilation homogeneity using the global inhomogeneity (GI) index
based on electrical impedance tomography (EIT) images.
Methods: In a retrospective study, 10 anesthetized patients with healthy lungs mechanically ventilated under volume-
controlled mode were investigated. Ventilation distribution was monitored by EIT. A standardized incremental PEEP
trial (PEEP from 0 to 28 mbar, 2 mbar per step) was conducted. During the PEEP trial, "optimal" PEEP level for each
patient was determined when the air was most homogeneously distributed in the lung, indicated by the lowest GI
index value. Two published methods for setting PEEP were included for comparison based on the maximum global
dynamic compliance and the intra-tidal compliance-volume curve.
Results: No significant differences in the results were observed between the GI index method (12.2 ± 4.6 mbar) and
the dynamic compliance method (11.4 ± 2.3 mbar, P > 0.6), or between the GI index and the compliance-volume curve
method (12.2 ± 4.9 mbar, P > 0.6).
Conclusions: According to the results, it is feasible and reasonable to use the GI index to select the PEEP level with
respect to ventilation homogeneity. The GI index may provide new insights into the relationship between lung
mechanics and tidal volume distribution and may be used to guide ventilator settings.
Introduction
Under the condition of general anesthesia during
mechanical ventilation, patients are sedated and the alve-
oli in the dependent lung regions may collapse regardless
of the recruitment state of the lungs. In the presence of
lung injury, such as acute respiratory distress syndrome
(ARDS), dependent lung regions are essentially nonaer-
ated, while non-dependent regions remain partially aer-
ated [1]. Under certain conditions both collapse of the
dependent regions and overinflation of the non-depen-
dent ones may occur, which may increase the risk of ven-
tilator-induced lung injury [2]. Lung protective
ventilation requires low tidal volume and a suitable posi-
tive end-expiratory pressure (PEEP) level to minimize
ventilator-induced lung injury. PEEP was introduced to
maintain the open atelectatic areas and thereby reduce
the risk of hypoxemia and cyclic recruitment/derecruit-
ment. Although the application of PEEP is widely used in
clinical practice, it remains under debate as to how to
titrate the adequate PEEP level for individuals [1].
Increase of PEEP further prevents derecruitment in the
dependent areas but may lead to overdistension in the
non-dependent areas as well. To find a balance between
these two aspects is one goal of setting PEEP.
The information provided by global parameters of lung
function, such as blood gas values, dynamic respiratory
mechanics indices and slope of the static pressure-vol-
ume (P/V) curve does not consider regional inhomogene-
ity of the lung, and therefore may be sometimes
misleading [3].
* Correspondence:
1
Department of Biomedical Engineering, Furtwangen University, Jakob-
Kienzle-Strasse 17, D-78054 Villingen-Schwenningen, Germany
Zhao et al. Critical Care 2010, 14:R8
/>Page 2 of 8
Computed tomography (CT) has a very good spatial
resolution [4] and is able to show the distribution of the
tissue density in the chest, thereby providing primarily
morphological data. Unfortunately, its application for
bedside monitoring is limited due to radiation exposure
of patients and complex handling (e.g. large equipment).
Electrical impedance tomography (EIT), as a noninva-
sive and radiation-free technique, has the potential for
monitoring the regional lung aeration and dynamic visu-
alization of regional ventilation distribution at the bed-
side. Thus, EIT may be helpful in adaptive titration of
PEEP and, consequently, could play an important role in
the individualization of protective ventilation strategies.
The reliability of EIT has already been proven in several
studies [5-7]. The applications of EIT for selecting PEEP
were recently proposed by Erlandsson and colleagues on
morbidly obese patients [8] and Luepschen and col-
leagues in an animal study of lavage-induced lung failure
[9].
A global inhomogeneity (GI) index based on EIT was
recently developed to quantify the tidal volume distribu-
tion within the lung [10]. The aim of this study was to test
the feasibility of optimizing PEEP with respect to ventila-
tion homogeneity using the GI index. A retrospective
study was performed and two other PEEP selection meth-
ods based on the analysis of lung mechanics, namely the
maximum global dynamic compliance [11] and the com-
pliance-volume curve method [12] were included for
comparison.
Materials and methods
Patients and protocol
Ten sedated patients with healthy lungs (American Soci-
ety of Anesthesiology (ASA) criteria I or ASA II; 7 male, 3
female; (mean ± standard deviation (SD)) age 30 ± 10
years; height 179 ± 8 cm; weight 77 ± 9 kg) were mechan-
ically ventilated in volume-controlled mode (10 ml/kg
body weight, ventilation frequency 12 min
-1
, inspira-
tion:expiration ratio 1:1.5, fraction of inspired oxygen
(FiO
2
) 1.0) for orthopedic surgery [10]. EIT measurement
was performed before the surgical procedure. Exclusion
criteria included age less than 18 years, pregnancy and
lactation, history or clinical signs of lung disease, and any
contraindication to the use of EIT (pacemaker, automatic
implantable cardioverter defibrillator, and implantable
pumps). The study was approved by the local ethics com-
mittee. Written informed consent was obtained from all
patients prior to the study.
Anesthesia was induced by bolus injection of propofol
and fentanyl, and was maintained by continuous infusion
of propofol. Muscle relaxation was achieved with vecuro-
nium bromide. After tracheal intubation (endotracheal
tube inner diameter 7.0 for women and 8.0 for men) and
confirmation of correct position of the tube, patients
were mechanically ventilated with Evita4Lab (Dräger
Medical, Lübeck, Germany). A standardized incremental
PEEP trial [13] was performed before surgical procedure
when all patients were in supine position. PEEP was
increased from 0 to 28 mbar in steps of 2 mbar. Each
PEEP level was maintained for 10 breaths. To standardize
lung volume history, the maneuver was preceded by a
zero end-expiratory pressure (ZEEP) ventilation phase
lasting five minutes.
Data collection and analysis
An EIT electrode belt, which carries 16 electrodes with a
width of 40 mm, was placed around the thorax in the fifth
intercostal space and one reference electrode was placed
at the patients' abdomen. The EIT electrode belt was con-
nected to an EIT monitor for online visualization (EIT
Evaluation KIT 2, Dräger Medical, Lübeck, Germany).
EIT data were generated by application of electrical alter-
nating current (50 kHz, 5 mA peak-to-peak) in a sequen-
tial rotating process and measurement of the resulting
surface potential differences between neighboring elec-
trode pairs was performed. EIT images (each consists of
32 × 32 pixels) were subsequently generated with a newly
developed reconstruction algorithm based on a modified
'finite element model' [3]. The images were continuously
recorded at 20 Hz and stored. As electrocautery inter-
feres with data acquisition of the prototype EIT device
used in this study, the EIT electrode belt was removed
shortly before surgery.
Airway pressure and gas flow rate were continuously
recorded at 125 Hz. Volume was calculated as integral of
gas flow rate after its correction for offset and drifts.
These data were stored as ASCII files for synchronization
with the EIT data. During the PEEP trial, we assumed
that the respiratory signals reached their steady state after
five breaths, because the step increase of PEEP levels was
small. Data of five consecutive breathing cycles at the end
of each PEEP level were pooled together in order to mini-
mize the noise level in the signals.
The GI index was recently introduced by our group
[10]. For every breathing cycle a so-called tidal image was
generated. Each pixel of these tidal images represents the
difference of impedance between end-inspiration and
end-expiration. The median value of these tidal differ-
ences is calculated for the lung area in each tidal image.
The sum of the absolute differences between the median
value and every pixel value is considered to indicate the
variation of the tidal volume distribution in the whole
lung region. In order to make the GI index universal and
secure inter-patient comparability, it is normalized by
dividing it by the sum of the impedance values within the
lung area:
Zhao et al. Critical Care 2010, 14:R8
/>Page 3 of 8
where DI denotes the value of the differential imped-
ance in the tidal images; DI
xy
is the pixel in the identified
lung area; DI
lung
are all pixels in the lung area under
observation.
The identification of the lung area is a prerequisite for
the GI calculation. A novel, EIT based lung area estima-
tion method has been newly proposed [10,14]. In short,
the areas found according to the functional EIT [5,15,16]
by certain threshold [17] binarization are mirrored (left
to right) and combined by means of a boolean "or"-opera-
tion. The cardiac-related area, which is distinguished in
the frequency domain, is subsequently subtracted. As a
result a quasi-symmetric left and right lung area is gener-
ated that includes all detectable lung area and that
excludes the cardiac-related area.
The maximum global dynamic compliance is one of the
most accepted parameters for setting PEEP [11,18,19]. It
was included in the present study for comparison and
compliance was calculated using the least-square-fit
method [20].
Mols and colleagues suggested that the intra-tidal com-
pliance-volume curve is able to indicate the ongoing
recruitment and overdistension of alveoli in the lung [12].
Using the SLICE method, six consecutive volume-depen-
dent compliances are obtained for a tidal breath [21]. The
shapes of these curves are classified into mainly three
groups: (1) a decrease in slope indicates overdistension;
(2) an increase in slope indicates recruitment; (3) a quasi-
horizontal compliance-volume curve indicates a suitable
PEEP setting [12]. As comparison, the method, called
compliance-volume curve method in the following, was
also included in the present study.
Statistical analysis
Statistical analysis was performed with the MATLAB
software package (MATLAB 7.2 statistic toolbox, The
MathWorks Inc., Natick, MA, USA). The Lilliefors test
was used to evaluate the distribution of all data. For nor-
mally distributed data, results are presented as mean ±
SD. Paired-sample t-test was applied in this case to assess
the significance of differences in choosing PEEP levels for
individuals (GI index vs. dynamic compliance; GI index
vs. compliance-volume curve). A P value less than 0.05
was considered statistically significant. Due to the small
amount of subjects in the study, significance levels were
adjusted to maintain a statistical power above 80% in
order to reduce the type II error. Furthermore, signifi-
cance levels were corrected for multiple comparisons
using Holm's sequential Bonferroni method. For not nor-
mally distributed data, results are expressed as median
(interquartile range). Results were compared using the
Bland-Altman analysis [22].
Results
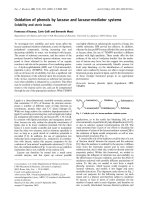
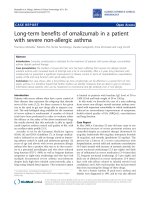
Tidal volume distribution in EIT images (i.e. tidal images)
at PEEP levels 6, 14 and 22 mbar are compared in Figure
1. With increased PEEP, the lung was further dilated.
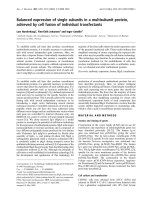
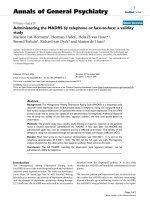
In Figure 2, a typical relation between the GI value and
PEEP is depicted. Starting at ZEEP, the GI index first
decreased with the increase of PEEP indicating that venti-
lation was more homogenously distributed. A single min-
imum value of the GI index was found at a middle range
of PEEP levels. With further increase in PEEP the GI
index rose steadily (Figure 2). Such a curve with only sin-
gle minimum value of the GI index was observed in every
patient. At PEEP levels corresponding with the minimum
GI
DI
xy
Median DI
lung
x y lung
DI
xy
x y lung
=
−
()
∈
∑
∈
∑
,
,
(1)
Tidal ventilation distribution in EIT images at different PEEP levels
Figure 1 Tidal ventilation distribution in EIT images at different PEEP levels. (a) 6 mbar. (b) 14 mbar. (c) 22 mbar. The tidal images were the dif-
ferences of relative impedance between end-inspiration and end-expiration in electrical impedance tomography (EIT) images. High ventilated regions
are marked in red, while low ventilated regions are marked in blue. PEEP = positive end-expiratory pressure.
PEEP = 6 mbar
PEEP = 14 mbar
PEEP = 22 mbar
0
10
20
30
40
50
60
a
c
b
Zhao et al. Critical Care 2010, 14:R8
/>Page 4 of 8
GI index values (12.2 ± 4.6 mbar) the air is most homoge-
nously distributed in the lungs.
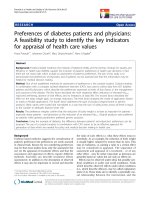
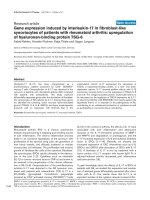
For comparison in Figure 3, the PEEP level is depicted
for the same individual as in Figure 2 when the global
dynamic compliance reached its maximum. A quasi-pla-
teau phase in the compliance-pressure curve was found
in every patient. In a range of 8 mbar (4 PEEP steps), the
maximum relative change of compliance was only 2%
(1%; in relation to maximum compliance).
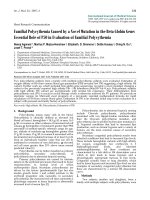
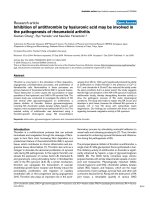
According to the intra-tidal compliance-volume curves
calculated with the SLICE method, another optimal PEEP
level with respect to lung mechanics was obtained for
every patient. Figure 4 shows typical intra-tidal compli-
ance-volume curves in the same patient as in Figures 2
and 3. Positive slope (upwards direction) of the compli-
ance-volume curves at a low PEEP indicates ongoing
recruitment in inflation, while a negative slope (down-
wards direction) indicates overdistension of alveoli. PEEP
is optimized when quasi-constant compliance within
tidal breath is obtained [12].
Figure 5 shows the comparison of these methods in a
box plot and Bland-Altman plots (GI index vs. dynamic
compliance; GI index vs. compliance-volume curve). No
significant differences in the results were found between
the GI index method (12.2 ± 4.6 mbar) and the dynamic
compliance method (11.4 ± 2.3 mbar, P > 0.6), or between
the GI index and the compliance-volume method (12.2 ±
4.9 mbar, P > 0.6). Considering the quasi-plateau phases
in compliance-pressure curves, the large differences
between the results obtained with the GI index and the
dynamic compliance method in some patients were
explainable. No bias of results was observed in the Bland-
Altman analysis.
A typical curve of (right) GI index of one patient (left) during a standardized PEEP trial
Figure 2 A typical curve of (right) GI index of one patient (left) during a standardized PEEP trial. The x axis displays the number of breathing
cycles, counted once the maneuver started. A minimum value of the global inhomogeneity (GI) index indicated the optimal positive end-expiratory
pressure (PEEP) with respect to ventilation homogeneity. Paw = pressure at airway opening.
0 20 40 60 80 100 120 140
0
5
10
15
20
25
30
35
40
45
50
Paw [mbar]
breathing cycles
0 20 40 60 80 100 120 140
0.3
0.35
0.4
0.45
0.5
0.55
0.6
0.65
breathing cycles
GI index
PEEP=14mbar
Dynamic compliance calculated using the least-square-fit method
for the same patient as in Figure 1
Figure 3 Dynamic compliance calculated using the least-square-
fit method for the same patient as in Figure 1. Dashed-line indi-
cates the optimized positive end-expiratory pressure (PEEP) level with
respect to lung mechanics at 14 mbar where the compliance (C)-pres-
sure curve reaches its maximum. A quasi-plateau phase in the curve is
observed where the maximum relative change of compliance for 8
mbar pressure range is only 2% (relative to the maximum compliance
value).
0 5 10 15 20 25 30
40
45
50
55
60
65
70
75
80
C [ml/mbar]
PEEP [mbar]
PEEP=14 mbar
2%
Zhao et al. Critical Care 2010, 14:R8
/>Page 5 of 8
Discussion
In this study, we investigated the feasibility of our
approach to optimize PEEP with respect to the homoge-
neity of pulmonary ventilation distribution using the GI
index. In a previous study [10], we have demonstrated
that the EIT-based GI index quantified the tidal volume
distribution within the lung and showed good reliability
and inter-patient comparability. Alveolar recruitment
with less overdistension of the lung tissue would actually
lead to a more homogeneous pulmonary air distribution.
The feasibility of the GI index as a new tool in PEEP opti-
mization was confirmed by the present retrospective
study. The results were comparable with the global
dynamic compliance method [11] and the intra-tidal
compliance-volume curves produced by the SLICE
method [12].
The shape of intra-tidal dynamic compliance calculated with the SLICE method in the same patient as in Figures 1 and 2
Figure 4 The shape of intra-tidal dynamic compliance calculated with the SLICE method in the same patient as in Figures 1 and 2. An up-
ward slope indicates recruitment, a downward slope indicates overdistension and a quasi-horizontal shape indicates that neither the recruitment nor
the overdistension effect is dominant. Positive end-expiratory pressure (PEEP) is optimized at 14 mbar in this patient according to the shape of the
compliance (C)-volume curve.
0 200 400 600 800
40
50
60
70
80
90
PEEP = 14 mbar
0 200 400 600 800
40
50
60
70
80
90
PEEP = 10 mbar
0 200 400 600 800
40
50
60
70
80
90
PEEP = 18 mbar
0 200 400 600 800
40
50
60
70
80
90
PEEP = 22 mbar
0 200 400 600 800
40
50
60
70
80
90
PEEP = 26 mbar
0 200 400 600 800
40
50
60
70
80
90
PEEP = 2 mbar
0 200 400 600 800
40
50
60
70
80
90
PEEP = 6 mbar
C [ml/mbar]
volume [ml]
Comparison of the optimal PEEP determined with the GI index, dynamic compliance and compliance-volume curve method
Figure 5 Comparison of the optimal PEEP determined with the GI index, dynamic compliance and compliance-volume curve method. Left
= box plot. The boxes mark the quartiles while the whiskers extend from the box out to the most extreme data value within 1.5 times the interquartile
range of the sample. Middle = Bland-Altman plot comparing global inhomogeneity (GI) and dynamic compliance method (C
dyn
). Right = Bland-Alt-
man plot comparing GI and the intra-tidal compliance-volume curve calculated by the SLICE method (C_V). The numbers above the * indicate the
number of overlapping results. The dashed line at the middle depicts the mean value of the whole data set. The other two dashed lines represent
mean ± 1.96 times standard deviation.
0 5 10 15 20
−8
−6
−4
−2
0
2
4
6
8
(C_V + GI) / 2 [mbar]
C_V − GI [mbar]
6 8 10 12 14
−10
−5
0
5
10
(C
dyn
+ GI) / 2 [mbar]
C
dyn
− GI [mbar]
GI V_C
5
10
15
20
PEEP [mbar]
C
dyn
3
2
3
Zhao et al. Critical Care 2010, 14:R8
/>Page 6 of 8
Although differences of air distribution in the lung can
be observed in EIT images on a qualitative level (Figure
1), it is difficult to identify a superior PEEP level with
respect to homogeneity of ventilation distribution. One
reason is that the 'colourful' EIT-images only show the
relative impedance values whereas the GI index quanti-
fies the variation of the tidal volume distribution.
The results of all these three methods showed consider-
able inter-patient variation, which suggests the use of an
individualized PEEP selection process. It has to be noted
that the dynamic compliance and the compliance-volume
curve method focus on the mechanics of the respiratory
system, while the GI index focuses on a different aspect,
namely the homogeneity of ventilation distribution. We
have found no significant differences among the optimal
PEEP values selected by these three methods, which indi-
cates that homogeneity of air distribution in the lung has
been somehow related to the global lung mechanics (at
least to dynamic compliance). In the analysis of dynamic
compliance, due to the quasi-plateau phase in the compli-
ance-pressure curves (Figure 3), it is difficult to claim that
the PEEP level where C = C
max
is superior to the level
where C = C
max
× 98%. The difference between these two
PEEP levels can be as large as 8 mbar. The PEEP selection
using the compliance-volume curves is an enhancement
of the dynamic compliance method. However, categoriz-
ing the compliance-volume curves is somehow complex
and not intuitive. Therefore, another parameter to select
PEEP in a different aspect is still needed. In addition, the
GI index is superior to dynamic lung mechanics in spon-
taneously breathing patients where reliable lung mechan-
ics are difficult to obtain.
The quasi-static P/V curve has also been used to indi-
vidualize the setting of a proper PEEP level. But how to
generate and analyze the P/V curve is still under intense
debate [18]. To set PEEP at the lower inflection point plus
2 cmH
2
O was shown to be appropriate by Takeuchi and
colleagues in a lavage-injured sheep ARDS model [23].
But there is no physiological interpretation to support it
and the lower inflection point may be difficult to identify
accurately [24], especially in patients with a wide distri-
bution of opening pressures. New findings indicate that it
may be better to derive PEEP from the upper inflection
point of the deflation limb of the P/V curve [25]. In order
to obtain quasi-static P/V curves, a normal ventilation
process has to be interrupted in order to perform respira-
tory maneuvers, such as low-flow or super-syringe infla-
tion. These maneuvers may be harmful to the patients
due to hyper-inflation.
Besides using lung mechanics, there are other studies
on open-lung PEEP selection using blood gas analysis
[26-29] and imaging techniques [8,9,30], both of which
are difficult to implement as a continuous bedside moni-
toring tool. Blood gas analysis provides a way to titrate
PEEP but it is an invasive and discontinuous method.
Recently, more and more studies on PEEP selection use
imaging techniques. CT is the gold standard for assess-
ment of tidal volume distribution in injured lungs [4].
Thus verification studies were normally based on CT
examinations. However, CT is not an adequate method to
monitor mechanical ventilation therapy due to radiation
and the size of the device.
Using EIT instead of CT for bedside assessment of tidal
volume distribution is a new trend. As the EIT images
alone cannot be used objectively, quantifications were
normally performed by calculating the ratio between dif-
ferent arbitrarily defined regions of interest [2,31-33].
Erlandsson and colleagues titrated PEEP to maintain a
horizontal end-expiratory global relative impedance
value, i.e. a stable end-expiratory lung volume, and
claimed that such PEEP was optimal [8]. Although the
partial pressure of oxygen (PaO
2
)/FiO
2
ratio and compli-
ance finally increased in these patients (not the maxima
of PaO
2
/F
I
O
2
), there was no indication that these PEEP
levels were optimal. Besides, how to identify the horizon-
tal baseline has not explained in the literature. Luepschen
and colleagues [9] modified the centre of gravity index
from Frerichs and colleagues [16,34] to evaluate func-
tional lung opening and overdistension of the lung tissue
[9]. Unfortunately, we found more than one single mini-
mum with their method on our data. This may be due to
the differences in state of the lungs (healthy vs. lavage) or
the differences in species (human vs. animal). Luepschen
and colleagues also found that significant differences
between dependent and non-dependent tidal volume loss
and gain may reliably indicate recruitment and derecruit-
ment of lung tissue [9]. But because they divided the EIT
images into only two parts - a dorsal and a ventral -
changes within each part were not detectable, leading to a
coarse-grained method.
Unlike the global lung mechanics and static P/V curve,
which are restricted to information integrating all lung
regions [3], the GI index describes the inhomogeneity of
tidal volume distribution in a cross-sectional lung plane
where the EIT belt was placed in detail up to 32 × 32
regions. At the same time, with the help of a robust lung
area determination method [10,14], the inhomogeneity
analysis is restricted only to the lung region. Cardiac-
related area and thorax area are excluded [10,14]. In addi-
tion, the GI index is a completely maneuver-free tool
although in the present study an incremental PEEP trial
was used. Without running the risk of inducing lung
overinflation and ventilator-induced lung injury, PEEP
may be adjusted according to the GI value. By adding
small changes of PEEP, the gradient of the GI value indi-
cates the direction of beneficial PEEP alteration.
Zhao et al. Critical Care 2010, 14:R8
/>Page 7 of 8
Although a potential link between the homogeneity of
air distribution in the lungs and dynamic respiratory
mechanics is foreseen, a reference method to verify the
homogeneity, such as CT, was missing in the study due to
ethical reasons. Concrete evidence must be found to
prove this relation or further validation with CT is
needed before clinical application. Not only the lung
mechanics but also the hemodynamic effect of PEEP may
influence the decision of PEEP selection. It is reasonable
to combine all these aspects (parameters) when titrating
PEEP. The weights of different parameters are worth
examining. Another drawback of the present study is that
only patients with healthy lungs were recruited in the
study. After this feasibility study, a further investigation
on ALI/ARDS patients is essential. PEEP selection based
on GI index or lung mechanics analysis may exhibit a dif-
ferent relation in patients suffering from severe respira-
tory insufficiency.
Conclusions
In the present study, we found that a PEEP level, at which
the lung was most homogenously ventilated, always
existed during a standardized incremental PEEP trial.
Such PEEP level is optimal with respect to ventilatory
homogeneity and can be identified using the GI index.
Moreover, the GI index may provide new insights into the
relation between lung mechanics and tidal volume distri-
bution. In further clinical evaluations it may be used to
guide ventilator settings in combination with other
aspects such as gas exchange and lung mechanics.
Key messages
• The PEEP selection is a process depending on the
individual properties of a patient and his or her dis-
ease state. Different aspects, such as blood gas, respi-
ratory system mechanics and ventilatory
homogeneity, need to be considered at the bedside.
• Evaluation of EIT data allows the incorporation of
the patient's state of respiratory homogeneity into
therapeutical decision-making at the bedside.
• It is feasible and reasonable to titrate the PEEP level
with respect to ventilatory homogeneity based on
EIT.
• Lung mechanics and tidal volume distribution are
related. However, the relation may vary among differ-
ent lung diseases.
Abbreviations
ARDS: acute respiratory distress syndrome; ASA: american society of anesthesi-
ology classification; CT: computed tomography; DI: the value of the differential
impedance in the tidal images; DI
lung
: all pixels in the lung area under observa-
tion; DI
xy
: the pixel in the identified lung area; EIT: electrical impedance tomog-
raphy; GI: global inhomogeneity; PaO
2
: partial pressure of arterial oxygen;
PEEP: positive end-expiratory pressure; P/V: pressure-volume curve; SD: stan-
dard deviation; ZEEP: zero end-expiratory pressure.
Competing interests
The authors declare that they have no competing interests.
Authors' contributions
ZZ designed the study, analyzed the data and drafted the manuscript. DS car-
ried out the data measurement. IF revised the manuscript critically. JG gave
valuable advices and contributed to writing. KM contributed to study design,
data analysis and writing. All authors read and approved the final manuscript.
Acknowledgements
This work was supported by Bundesministerium für Bildung und Forschung
(Grant 1781X08 MOTiF-A), and Dräger Medical, Lübeck. The results of this study
have been presented in part at the European Biomedical Engineering Con-
gress (EMBEC 2008) in Antwerp, Belgium.
Author Details
1
Department of Biomedical Engineering, Furtwangen University, Jakob-
Kienzle-Strasse 17, D-78054 Villingen-Schwenningen, Germany,
2
Department of Anesthesiology and Critical Care Medicine, Section for
Experimental Anesthesiology, University Medical Center, Hugstetter Strasse 49,
D-79095 Freiburg, Germany and
3
Department of Anesthesiology and Intensive Care Medicine, University
Medical Center of Schleswig-Holstein Campus Kiel, Arnold-Heller-Strasse 3, D-
24105 Kiel, Germany
References
1. Rouby JJ, Lu Q, Goldstein I: Selecting the right level of positive end-
expiratory pressure in patients with acute respiratory distress
syndrome. Am J Respir Crit Care Med 2002, 165:1182-1186.
2. Victorino JA, Borges JB, Okamoto VN, Matos GF, Tucci MR, Caramez MP,
Tanaka H, Sipmann FS, Santos DC, Barbas CS, Carvalho CR, Amato MB:
Imbalances in regional lung ventilation: a validation study on electrical
impedance tomography. Am J Respir Crit Care Med 2004, 169:791-800.
3. Putensen C, Wrigge H, Zinserling J: Electrical impedance tomography
guided ventilation therapy. Curr Opin Crit Care 2007, 13:344-350.
4. Gattinoni L, Caironi P, Valenza F, Carlesso E: The role of CT-scan studies
for the diagnosis and therapy of acute respiratory distress syndrome.
Clin Chest Med 2006, 27:559-570.
5. Frerichs I, Hinz J, Herrmann P, Weisser G, Hahn G, Dudykevych T, Quintel
M, Hellige G: Detection of local lung air content by electrical
impedance tomography compared with electron beam CT. J Appl
Physiol 2002, 93:660-666.
6. Hinz J, Neumann P, Dudykevych T, Andersson LG, Wrigge H, Burchardi H,
Hedenstierna G: Regional ventilation by electrical impedance
tomography: a comparison with ventilation scintigraphy in pigs. Chest
2003, 124:314-322.
7. Marquis F, Coulombe N, Costa R, Gagnon H, Guardo R, Skrobik Y:
Electrical impedance tomography's correlation to lung volume is not
influenced by anthropometric parameters. J Clin Monit Comput 2006,
20:201-207.
8. Erlandsson K, Odenstedt H, Lundin S, Stenqvist O: Positive end-
expiratory pressure optimization using electric impedance
tomography in morbidly obese patients during laparoscopic gastric
bypass surgery. Acta Anaesthesiol Scand 2006, 50:833-839.
9. Luepschen H, Meier T, Grossherr M, Leibecke T, Karsten J, Leonhardt S:
Protective ventilation using electrical impedance tomography. Physiol
Meas 2007, 28:S247-260.
10. Zhao Z, Moller K, Steinmann D, Frerichs I, Guttmann J: Evaluation of an
electrical impedance tomography-based global inhomogeneity index
for pulmonary ventilation distribution. Intensive Care Med 2009,
35:1900-1906.
11. Suarez-Sipmann F, Bohm SH, Tusman G, Pesch T, Thamm O, Reissmann H,
Reske A, Magnusson A, Hedenstierna G: Use of dynamic compliance for
open lung positive end-expiratory pressure titration in an
experimental study. Crit Care Med 2007, 35:214-221.
Received: 27 October 2009 Revisions Requested: 4 December 2009
Revised: 10 December 2009 Accepted: 30 January 2010 Published: 30
January 2010
This article is available from: 2010 Zhao et al.; licensee BioMed Central L td. This is an open access article distributed under the te rms of the Creative Commons Attribution License ( s/by/2.0), which permits unrestricted use, distribution, and reproduction in any medium, provided the original work isproperly cited.Critica l Care 2010, 14:R8
Zhao et al. Critical Care 2010, 14:R8
/>Page 8 of 8
12. Mols G, Brandes I, Kessler V, Lichtwarck-Aschoff M, Loop T, Geiger K,
Guttmann J: Volume-dependent compliance in ARDS: proposal of a
new diagnostic concept. Intensive Care Med 1999, 25:1084-1091.
13. Stahl CA, Moller K, Schumann S, Kuhlen R, Sydow M, Putensen C,
Guttmann J: Dynamic versus static respiratory mechanics in acute lung
injury and acute respiratory distress syndrome. Crit Care Med 2006,
34:2090-2098.
14. Zhao Z, Möller K, Steinmann D, Guttmann J: Determination of lung area
in EIT images. In Proc 3rd International Conference on Bioinformatics and
Biomedical Engineering Beijing, China: IEEE; 2009:1-4.
15. Hahn G, Frerichs I, Kleyer M, Hellige G: Local mechanics of the lung tissue
determined by functional EIT. Physiol Meas 1996, 17(Suppl
4A):A159-166.
16. Frerichs I, Hahn G, Golisch W, Kurpitz M, Burchardi H, Hellige G:
Monitoring perioperative changes in distribution of pulmonary
ventilation by functional electrical impedance tomography. Acta
Anaesthesiol Scand 1998, 42:721-726.
17. Pulletz S, van Genderingen HR, Schmitz G, Zick G, Schadler D, Scholz J,
Weiler N, Frerichs I: Comparison of different methods to define regions
of interest for evaluation of regional lung ventilation by EIT. Physiol
Meas 2006, 27:S115-127.
18. LaFollette R, Hojnowski K, Norton J, DiRocco J, Carney D, Nieman G: Using
pressure-volume curves to set proper PEEP in acute lung injury. Nurs
Crit Care 2007, 12:231-241.
19. Caramez MP, Kacmarek RM, Helmy M, Miyoshi E, Malhotra A, Amato MB,
Harris RS: A comparison of methods to identify open-lung PEEP.
Intensive Care Med 2009, 35:740-747.
20. Iotti GA, Braschi A, Brunner JX, Smits T, Olivei M, Palo A, Veronesi R:
Respiratory mechanics by least squares fitting in mechanically
ventilated patients: applications during paralysis and during pressure
support ventilation. Intensive Care Med 1995, 21:406-413.
21. Guttmann J, Eberhard L, Fabry B, Zappe D, Bernhard H, Lichtwarck-Aschoff
M, Adolph M, Wolff G: Determination of volume-dependent respiratory
system mechanics in mechanically ventilated patients using the new
SLICE method.
Technol Health Care 1994, 2:175-191.
22. Bland JM, Altman DG: Statistical methods for assessing agreement
between two methods of clinical measurement. Lancet 1986,
1:307-310.
23. Takeuchi M, Goddon S, Dolhnikoff M, Shimaoka M, Hess D, Amato MB,
Kacmarek RM: Set positive end-expiratory pressure during protective
ventilation affects lung injury. Anesthesiology 2002, 97:682-692.
24. Harris RS, Hess DR, Venegas JG: An objective analysis of the pressure-
volume curve in the acute respiratory distress syndrome. Am J Respir
Crit Care Med 2000, 161:432-439.
25. Albaiceta GM, Taboada F, Parra D, Luyando LH, Calvo J, Menendez R, Otero
J: Tomographic study of the inflection points of the pressure-volume
curve in acute lung injury. Am J Respir Crit Care Med 2004,
170:1066-1072
.
26. Tugrul S, Akinci O, Ozcan PE, Ince S, Esen F, Telci L, Akpir K, Cakar N:
Effects of sustained inflation and postinflation positive end-expiratory
pressure in acute respiratory distress syndrome: focusing on
pulmonary and extrapulmonary forms. Crit Care Med 2003, 31:738-744.
27. Luecke T, Herrmann P, Kraincuk P, Pelosi P: Computed tomography scan
assessment of lung volume and recruitment during high-frequency
oscillatory ventilation. Crit Care Med 2005, 33(3 Suppl):S155-162.
28. Borges JB, Okamoto VN, Matos GF, Caramez MP, Arantes PR, Barros F,
Souza CE, Victorino JA, Kacmarek RM, Barbas CS, Carvalho CR, Amato MB:
Reversibility of lung collapse and hypoxemia in early acute respiratory
distress syndrome. Am J Respir Crit Care Med 2006, 174:268-278.
29. Girgis K, Hamed H, Khater Y, Kacmarek RM: A decremental PEEP trial
identifies the PEEP level that maintains oxygenation after lung
recruitment. Respir Care 2006, 51:1132-1139.
30. Grant CA, Fraser JF, Dunster KR, Schibler A: The assessment of regional
lung mechanics with electrical impedance tomography: a pilot study
during recruitment manoeuvres. Intensive Care Med 2009, 35:166-170.
31. Kunst PW, Bohm SH, Vazquez de Anda G, Amato MB, Lachmann B,
Postmus PE, de Vries PM: Regional pressure volume curves by electrical
impedance tomography in a model of acute lung injury. Crit Care Med
2000, 28:178-183.
32. Meier T, Luepschen H, Karsten J, Leibecke T, Grossherr M, Gehring H,
Leonhardt S: Assessment of regional lung recruitment and
derecruitment during a PEEP trial based on electrical impedance
tomography. Intensive Care Med 2008, 34:543-550.
33. Odenstedt H, Lindgren S, Olegard C, Erlandsson K, Lethvall S, Aneman A,
Stenqvist O, Lundin S: Slow moderate pressure recruitment maneuver
minimizes negative circulatory and lung mechanic side effects:
evaluation of recruitment maneuvers using electric impedance
tomography. Intensive Care Med 2005, 31:1706-1714.
34. Frerichs I, Dargaville PA, van Genderingen H, Morel DR, Rimensberger PC:
Lung volume recruitment after surfactant administration modifies
spatial distribution of ventilation. Am J Respir Crit Care Med 2006,
174:772-779.
doi: 10.1186/cc8860
Cite this article as: Zhao et al., PEEP titration guided by ventilation homoge-
neity: a feasibility study using electrical impedance tomography Critical Care
2010, 14:R8