báo cáo hóa học:" Preferences of diabetes patients and physicians: A feasibility study to identify the key indicators for appraisal of health care values" doc
Bạn đang xem bản rút gọn của tài liệu. Xem và tải ngay bản đầy đủ của tài liệu tại đây (369.35 KB, 7 trang )
RESEARC H Open Access
Preferences of diabetes patients and physicians:
A feasibility study to identify the key indicators
for appraisal of health care values
Franz Porzsolt
1*
, Johannes Clouth
2
, Marc Deutschmann
3
, Hans-J Hippler
4
Abstract
Background: Evidence-based medicine, the Institute of Medicine (IOM) and the German Institute for Quality and
Efficiency in Health Care (IQWiG), support the inclusion of patients’ preferences in health care decisions. In fact
there are not many trials which include an assessment of patient’s preferences. The aim of this study is to
demonstrate that preferences of physic ians and of patients can be assessed and that this information may be
helpful for medical decision making.
Method: One of the established methods for assessment of preferences is the conjoint analysis. Conjoint analysis,
in combination with a computer assisted telephone interview (CATI), was used to collect data from 827 diabetes
patients and 60 physicians, which describe the preferences expressed as levels of four factors in the management
and outcome of the disease. The first factor described the main treatment effect (reduction of elevated Hb
A1c
,
improved well-being, absence of side effects, and no limitations of daily life). The second factor described the
effect on the body weight (gain, no change, reduction). The third factor analyzed the mode of application (linked
to meals or flexible application). The fourth factor addressed the type of pro duct (original brand or generic
product). Utility values were scaled and normalized in a way that the sum of utility points across all levels is equal
to the number of attributes (factors) times 100.
Results: The preference weights confirm that the reduction of body weight is at least as important for patients -
especially obese patients - and physicians as the reduction of an elevated Hb
A1c
. Original products were preferred
by patients while general practitioners preferred generic products.
Conclusion: Using the example of diabetes, the difference between patients’ and physicians’ preferences can be
assessed. The use of a conjoint analysis in combination with CATI seems to be an effective approach for
generation of data which are needed for policy and medical decision making in health care.
Background
Evidence based medicine suggests the consideration of
patient’s preferences but preferences are rarely assessed
in clinical trials. Reason for not considering preferences
may be that most studies focus only the assessment but
not yet the appraisal of treatment effects and that the
assessment and appraisal of effects require different
methods. Scientists can describe treatment effects
(assessment). In addition to the description of observed
effects it may also be important to rec ord and desc ribe
the value of such effects i.e. what these effects mean to
somebody. As an example, the reduction of body weight
is usually higher valuated by women than by men. This
step of evaluation, i.e. putting a value to a certain effect
may be considered as appraisal. The separation of
assessment and appraisal of a treatment - or of any
other effect - may be rather important as decisions are
generally based on values but not only on effects [1].
Effects may be observed under ideal, but possibly arti-
ficial conditions or under real world c onditions. Trials
which describe observed effects under ideal conditions
(i.e., which describe efficacy), may be called explanatory
trials [2-4]. These trials aim to identify a potentially cau-
sal relationship between the intervention and the
* Correspondence:
1
Clinial Economics, University of Ulm, 89073 Ulm, Germany
Full list of author information is available at the end of the article
Porzsolt et al. Health and Quality of Life Outcomes 2010, 8:125
/>© 2010 Porzsolt et al; licensee BioMed Central Ltd. This is an Open Access article distributed under the terms of the Creative Commons
Attribution License (http://creativecommons .org/licenses/by/2.0), which permits unrestr icted use, distribution, an d reproduction in
any medium, provided the original work is properly cited.
observed outcome. Trials which describe effectiveness
through observed effects under real world conditions
may be called pragmatic trials [2-4]. We consider these
trials to identify effects which can also be detected
under real world conditions. Confounders such as co-
morbidity, co-treatments, stress factors and interperso-
nal relationship influence the outcome and are therefore
eliminated in efficacy trials but not in effectiveness stu-
dies. Efficacy and effectiveness are two extremes of a
continuum. In fact, there is a whole spectrum of expla-
natory and pragmatic trials [5].
The second level of reporting is related to the apprai-
sal of the effect of the health service. Appraisal means
that an individual ascribes a value to the observed effect.
Values are based on preferences, preferences can be
measured and preferences should definitely be consid-
ered in health care decisions [6]. Appraisals should ide-
ally be confined to studies which are completed under
real word conditions. A possible sequence of reporting
the effects and of their meanings is shown in Table 1.
Two assessments which were made under ideal and real
world conditions should precede the appraisals from
various per spectives, e.g., f rom the p erspective of
patients or doctors (Table 1).
Hypotheses can be tested under ideal conditions. It is
more difficult if not impossible to test hypotheses by
data which were recorded under real world conditions
[7]. The appraisal of health care services, i.e., the
description of the value or benefit or utility of services,
is difficult to falsify because these appraisals depend on
individ uals’ preferences [8]. The validity of the methods
used to describe the value, benefit, or utility of a health
care service, such as Time-Trade-Off, Standard Gamble,
and Quality Adjusted Life Years, is discussed controver-
sially because these methods include the preferences of
the raters and require assumptions which are sometimes
not met in real world conditions [7,9,10], like in older
patients with diabetes [11].
We have rece ntly addressed the problem of different
preferences of health care providers and health care
users [12] by comparing patients’ decisions with the
recommendations of international guidelines for neo-
adjuvant or adjuvant radiotherapy in the treatment of
colorectal cancer. Although the treatment decisions
(with or without radiotherapy) of both patients and pro-
fessionals were based in our experiment on the same set
of clinical trials, 85% of the patients refused the radio-
therapy which was recommended in the guidelines. Sur-
vival was the same with and without radiotherapy, but
fecal incontinence, a functional indicator, was consider-
ably less frequent in the group without radiotherapy,
while the reduction of the tumor size, i.e., a structural
indicator, was more frequent in the group with radio-
therapy. This example shows that health care providers
and health care users express different preferences when
they are confronted with identical information and are
asked to decide according to their preferences. There-
fore, preferences of both doctors and patients should be
carefully analyzed when policy or clinical decisions are
made.
The conjoint analysis is a wel l established method to
identify preferences. This method was used in t he UK,
the Netherlands and the USA in several health care pro-
jects [13-17]. The aim of this paper is to identify the
factors which are important for treatment decisions of
diabetes type I and II in Germany and to compare the
preferences of patients and doctors in this setting with
policy decisions.
Methods
Selection of the target population
A sample of 1006 diabetic patients, aged 14 years or
older, was identified from a previous general survey on
27,000 German households. Of these 1006 diabetes
patients, 827 agreed to and were able to complete a
computer assisted telephone interview (CATI). P art of
this interview was a conjoint measurement module
which included the four factors which were identified in
the focus group.
Identification of key factors and factor levels for the
conjoint measurement procedure
To identify the important aspects of diabetes treatment
for patients its outcomes were discussed in a focus
Table 1 Possible sequences for reporting the effects of health care services
Level of assessment Level of appraisal
Experimental clinical trials
conducted under ideal, but
possibly artificial conditions
1
st
step Explanatory trial describing possible causal
effects of an action under ideal conditions, i.e.,
describing the efficacy
Not useful
Descriptive studies conducted
under day-to-day, real world
conditions
2
nd
step Pragmatic trial describing the effects of an
action under real world conditions, i.e., describing
the effectiveness
3
rd
step Assessment of individual preferences under
real world conditions, i.e. describing the value
perceived by an individual
Two assessments under ideal (step 1) and real world cond itions (step 2) at the level of assessment are followed by the appraisal of real world results (step 3)
from various perspectives. As the available information is growing from step 1 to step 3, it is justified to value health care services the higher the more steps of
this sequence were completed. Desired effects which can be detected only under idea l conditions of a clinical trial, but not under real world conditio ns will be
valued lower than desire d effects which can be detected also under real world conditions.
Porzsolt et al. Health and Quality of Life Outcomes 2010, 8:125
/>Page 2 of 7
group of ten diabetes patients. This focus group sug-
gested four importan t factors for patients’ decisions in
the management of type 1 or type 2 diabetes. Two of
the four factors were related to the effects of treatment,
i.e., the main treatment effect and the effect of treat-
ment on body weight. Two other factors were related to
the mode of application and the type of product. These
factors and the factor levels were used for the following
conjoint procedure.
Four steps to complete the conjoint measurement
The participants of the study had to complete four steps
of the conjoint measurement to describe their prefer-
ences for a particular treatment. Each treatment was
characterized by fo ur factors. Within each factor, two to
four factor levels could be selected. The four factors and
the factor levels are shown in Table 2.
First, participants wer e asked to rank the offered l evels
for each of the four factors. Second, several pairs of factor
levels were presented to the participants to assess the
weight of the factors. For that, the participants had to
express the importance (from absolutely important to not
important at all) they considered to the difference of two
particular levels, i.e., to a decrease of body weight com-
pared to an increase of body weight. Third, virtual pairs of
drugs were crea ted by combining different levels of three
factors (e.g., option “A": generic drug, causing weight gain,
flexible application or alternatively option “B": original
drug, causing weight loss, application linked to meals).
The participants had to express their preference on a
four item scale (strongly prefer “A”,prefer“A”,prefer
“B”, strongly prefer “B”) for one of these options. Fourth,
to confirm the validity of the calculated result, the parti-
cipants were asked to describe the probability of using a
virtual drug which was characterized by selected levels
of the four levels (e.g., causing weight loss, reducing ele-
vated Hb
A1c
, flexible time of application, original drug).
As the number of all possible combinations of factor
levels is too high to be tested, the ideal combinations of
factor levels were based on the responses to the preced-
ing questions.
Estimation of weights of factor levels
The data collection, as well as the estimation of utility
weights, was done with the Adaptive Conjoint Analysis
(ACA) software 1997 (Sawtooth Software, Inc., Sequim,
Washington, USA). Like the most established
approaches in conjoint analysis the ACA is based on a
main-effects model. Due to the exclusion of attribute
interactions, measuring of utilities for attributes takes
place in a standard-all-else-equal context. Utility values
werescaledandnormalizedbythismethodinsucha
way that the sum of utility points across all levels is
equal to the number of attributes (factors) times 100. As
there are four attributes in our model (main treatment
effect, effect on body weight, mode of application and
product type) the total amount of weight-points are 400.
Depending on the reported preferences during the inter-
view, these 400 points were itemized by established mul-
tiple regression analysis over the 11 factor levels in
order to calculate utility values for all levels for each
respondent by least square estimation. Finally, average
utility weights were calculated and compared for differ-
ent subpopulations of patients or their physicians,
respectively.
Results
Characteristics of the patients and physicians
The telephone interview was completed by 827 patients,
46.9% of whom were male. Of these patients, 21% were
Table 2 Factor and factor levels as ranked by patients
Factors Factor levels Weights of factor levels
All patients Normal body weight Mild over-weight Adipositas I Adipositas II+III
Main treatment effect Reduction of elevated Hb
A1c
48.4 48.9 47.6 49.7 44.7
Improved well-being 37.5 34.7 35.6 40.4 40.5
Absence of side effects 43.0 43.6 44.6 43.5 37.2
No limitations of daily life 41.3 40.6 42.8 40.7 36.0
Effect on body weight Weight gain 15.7 20.7 15.0 12.6 11.4
No change 55.8 65.8 55.7 50.1 56.3
Weight loss 54.9 36.5 53.8 65.0 76.2
Mode of application Flexible time of application 30.4 29.2 32.2 29.8 28.5
Application linked to meals 22.6 26.9 21.9 22.2 20.7
Type of product Original product 36.2 37.3 36.9 33.2 35.0
Generic product 14.3 15.8 13.9 12.8 13.5
Left side: Factors and factor levels which had to be ranked by the study participants. Right side: The weight of factor levels in the total patient population (n =
827) and in subpopulations of patients with normal body weight (22.6%), mild overweight (40.4%), obesity type I (25.8%) and obesity type II+III (11.2%) is shown.
Differences in preferences among patient groups are highlighted.
Porzsolt et al. Health and Quality of Life Outcomes 2010, 8:125
/>Page 3 of 7
aged 14-29, 5.7% were aged 30-49, and 92.3% were aged
over 49. In 59% of diabe tes patients, the annual net
household income was below € 20.000, in 30% of
patients, the annual net household income was between
€ 20.000 and € 30.000, and 11% of patient households
had annual net income higher than € 30.000. The aver-
age annual net income of all households in Germany is
€ 33.700.
Type 1 diabetes was diagnosed in 9% of patients, type
2 diabetes was diagnosed in 89% of patients, and 2% of
patients couldn’t be allocated. The sex distribution was
similar in type 1 and type 2 patients. Obesity type II and
III were observed in 5% of patients with type 1 diabetes,
but was found in 12% of patients with type 2 diabetes.
No obesity was observed in 51% of patients with type 1
and in 20% of patients with type 2 diabetes. The dia-
betes was treated with oral medication in 47% of
patients; 29% of patients were treated with insulin, 14%
of patients were treated with combined oral and insulin
therapies, and 11% of patients did not receive either oral
or insulin treatment. Diabetes was known for 1-5 years
in 38% o f patients, for 6-10 years in 25% of patients, for
11-15 years in 13% of patients, and for 15+ years in 23%
of patients.
To prevent a possible selection bias, the patient char-
acteristics of the total sample of the selected diabetic
patients (n = 1006) were compared with those of the
subgroup of patients who agreed to and were able to
complete the conjoint measurement questions (n =
827). The maximal absolute difference in the reported
patient characteristics was 0.3% which renders a bias
non-responders rather unlikely (data not shown).
Sixty physicians, including 30 general practitioners and
30 diabetes specia lists were also included in the study.
Their average number of years of professional experi-
ence was 22.5 and 22.9 years, respectively. The general
practitioners had an average of 171 diabetes patients in
their practices and the diabetes specialists had an aver-
age of 331 diabetes patients in theirs.
Weight of factor levels
The weights of the levels of the four factors based on
assessments in 827 patients were calculated for the entire
group, as w ell as for subgroups, according to the ty pe of
diabetes, gender, age, treatment, body weight, and for
combinations of these characteristics. A selection of
these data is included in Table 2 where the weights of
factor levels according to body weight are shown.
This database offers the possibility to compare the
preferences within one group of patients or among
groups of patients. Patients consistently valued the main
treatment effects higher than the modes of application
and weight loss was more important for obese patients
than for non-obese patients (Table 2).
Data assessed in 60 physicians are shown in Table 3.
In the physician group, the main treat ment effects were
not always valued higher than the modes of application
as in the patient group. It is also shown that general
practitioners clearly preferred generic products over ori-
ginal products. This difference was not seen in diabetes
specialists.
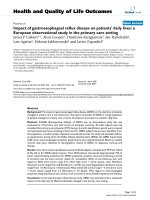
The compari son of patients and physician assessments
demonstrated that the reduction of Hb
A1c
and the
reduction of body weight were more impor tant for phy-
sicians than for patient s. Patients clearly preferred origi-
nal products, while physicians generally seemed to
prefer generic products (Figure 1). The more detailed
analysis in Table 2 demonstrates that the physicians’
preference of generic products was confined to general
practitioners.
Discussion
There is an increased awareness of the need to involve
patients in policy and clinical decision making as psy-
chological factors like risk aversion [18] and perception
of information are important variables which influence
decisions, as well as final outcomes [19]. This applies
especially to pa tients with chronic conditions, like dia-
betes mellitus [20,21]. Thes e psychological factors are
expressed as preferences which may be assessed by a
conjoint analysis.
This study investigated the feasibility of a conjoint
measurement for assessment of preferences in diabetic
patients in Germany. It should be emphasized that our
study refers to patient preferences but not to treatment
decisions. Patient preferences may play an important
role in the trade off of different properties of a therapy
but not all therapies may cover the patients’ preferences.
The obtained information is rather important as the
consideration of patients’ preferences was requested as
part of evidence-based decisi ons [6]. A second aspect of
preferences is related to the selection of the appropriate
study endpoints f or description of patients’ benefit.
These endpoints should consider the patients’ prefer-
ences, in addition to medical and economic aspects. The
obvious difference between physicians’ and patients’ pre-
ferences has been demonstrated in this and other [12]
studies. These differences can lead to conflicting result
as exemplified in the paradox outcome of treating a
schizophrenic patient (personal communication). The
added value of such a treatment may be questionable
when the patient realizes after successful treatment that
he or she has neither a job, nor money, nor a partner.
From the physician’s point of view, the symptoms of the
disease may have been treated successfully. From the
patient’s point of view, it remains unclear if the optimal
quality of life could be achieved just by reduction of the
symptoms of the disease. A corresponding result was
Porzsolt et al. Health and Quality of Life Outcomes 2010, 8:125
/>Page 4 of 7
seen in our study. According to the assessed preferences
of both patients and physicians, weight loss is at least as
important as the reduction of an elevated HB
A1c
(Tables
2 and 3). This means that weight loss and reduction of
an elevated HB
A1c
may be used as equivalent endpoints
in pragmatic trials, which is not really the case. We
expected that the focus groups would include mortality,
morbidity and functional status as important outcomes.
As none of these items were mentioned by the focus
groups it seems that patients’ short term goals and goals
that are frequently discussed at consultations are more
important than remote health goals and less frequently
discussed aspects.
Our study also demonstrated that physicians and
patients prefer different types of products. Patients pre-
fer origina l brands, while general practiti oners - but not
diabetes specialists - prefer generic products. This differ-
ence in preferences is explained by policy decisions in
Germany. Practitioners who are under budget control
and prescribe most of the treatments prefer to prescribe
the less expensive products. Specialists who mainly
recommend, but do not have to prescribe the treat-
ments, expressed no preference for original or generic
brands. The patients’ preference for the original brand is
most likely explained by the initial use of original pro-
ducts and the discomfort associated with the change of
Table 3 Factor and factor levels as ranked by physicians
Factors Factor levels Weights of factor levels
All physicians General practitioners Diabetes specialists
Main treat-ment effect Reduction of elevated Hb
A1c
61.3 63.7 58.8
Improved well being 43.8 53.7 33.9
Absence of side effects 30.0 30.6 29.4
No limitations of daily life 28.4 28.5 28.2
Effect on body weight Weight gain 7.1 8.6 5.6
No change 57.9 54.8 60.9
Weight loss 71.3 68.4 74.2
Mode of application Flexible time of application 16.0 12.5 19.4
Application linked to meals 29.9 28.9 30.8
Type of product Original product 17.1 3.7 30.6
Generic product 37.3 46.5 28.2
Table 3. Factors and factor levels ranked by the general practitioners and diabetes specialists are shown. Differences in preferences are highlighted.
Figure 1 Factor level analysis. Factor levels of the four factors, main treatment effect, effect on body weight, mode of application, and type of
product assessed in 827 diabetes patients and 60 physicians are shown.
Porzsolt et al. Health and Quality of Life Outcomes 2010, 8:125
/>Page 5 of 7
treatment from the original to generic products. This
change is usually induced by physicians who have to
consider the cost-effectiveness. Unfortunately, cost-effec-
tiveness analysis can include only a limited number of
aspects but may be improved if the factors which are
important for decisions have been identified in advance.
Health services will improve if the main patients’ pro-
blems are addressed and if appropriate answers can be
given to solve these problems. Accordingly, the German
Advisory Council on the Assessment of Developments
in the Health Care System (Sachverständigenrat) recom-
mended in its 2007 report to consider scientific methods
for selection of the appropriate endpoints [22]. The con-
joint analysis may be a useful tool for identifying the
patient’s problems and preferences.
It is difficult to predict if the results of this study will
also apply to patients in other cultures because the iden-
tification process in the focus group was based on a
rather small sample and the method for selecting the
factors was not too robust as a large number of tests
was completed but the results of only some tests were
interesting enough to be reported. In fact, this study did
not test a hypothesis but rather generated a hypothesis.
Theseweakpointsofthestudymaybeimprovedin
subsequent trials.
The conjoint analysis is not the only method to make
preference-based decisions. Other methods such as the
discrete choice analysis, which involves choice s between
two or more discrete alternatives, or the rationa l choi ce
theory, may also be a valuable method to support health
policy decisions. It should be remembered that all of
these methods are based on individual decisions which
cannot be falsified. This does not mean that data which
cannot be falsified are less valuable than data that can.
The two types of data just represent two types of deci-
sion making. We rec ommended considering both types
of data for policy decisions in health care.
The report of the Institute of Medicine on Compara-
tive Effectiveness Research [23] requested that patients’
preferences wee included in heal th care decisions. This
request supports our model, which is based on the levels
of assessment and appraisal as shown in Table 1. The
appraisal of health care services presumes that prefer-
ences can be measured and can be made available to
the policy and decision makers. The CATI technique
seems to guarantee the fast and effective generation of
these data. In our study, 827 of 1006 eligible patients
(82%) completed the telephone interview. A biased
selection of the 827 patients is rather unlikely, as the
patient characteristics of this population were very simi-
lar to the characteristics of all eligible patients (data not
shown) . The costs of this technique have to be balanced
against the fast decision that can be made and the con-
sequences which can be derived for the patients, health
care providers, and manufacturers. The inclusion of
patients’ preferences in the process of poli cy and clinical
decision making reflects the new area of evaluation and
interpretation in health care. The methods used in this
report may become important tools in this new area.
Conclusion
Thereissufficientevidencethatconjointanalysisisan
efficient method to analyze data which are needed f or
evidence-based decision making in health care. Impor-
tantaspectsforpolicydecisionsindiabetesmellitus
from physicians’,aswellaspatients’, point of view are
the reduction of an elevated HB
A1c
, as well as the reduc-
tion of obesity. Original brands are preferred by
patients, while gen eric brands are preferred by general
practitioners. This approach is interesting for future
attempts where patients’ preferences will have to be
included in health policy and clinical decisions.
List of abbreviations
ACA: adaptive Conjoint Analysis (ACA); CATI: computer assisted telephone
interview; Hb
A1c
: hemoglobin A subtype 1c.
Author details
1
Clinial Economics, University of Ulm, 89073 Ulm, Germany.
2
Lilly
Deutschland GmbH, 61352 Bad Homburg, Germany.
3
BIK-MARPLAN
Intermedia GmbH, 63065 Offenbach, Germany.
4
SRH University of Applied
Sciences, 75365 Calw, Germany.
Authors’ contributions
FP developed the concept of the publication and wrote the draft of the
manuscript. JC initiated the study and developed the details of the study
together with HJH. MD and HJH completed the study. All authors
participated in the discussion and interpretation of the results as well as in
the preparation of the final manuscript which was also approved by all
authors.
Competing interests
Franz Porzsolt is a consultant of Lilly Deutschland GmbH, initiator of the
Wilsede Workshop for Outcomes Research and member of the jury of the
Quality of Life Award. The Wilsede Workshop as well as the Quality of Life
Award are sponsored by Lilly Deutschland GmbH. Johannes Clouth is
manager of health economics at Lilly Deutschland GmbH. Marc
Deutschmann and Hans-J. Hippler are working with BIK-MARPLAN
Intermedia GmbH.
Received: 29 March 2010 Accepted: 4 November 2010
Published: 4 November 2010
References
1. Gray JA Muir: Evidence-based policy making - is about taking decisions
based on evidence and the needs and values of the population. BMJ
2004, 329:988-989.
2. Laurence C, Gialamas A, Yelland L, Bubner T, Ryan P, Willson K,
Glastonbury B, Gill J, Shephard M, Beilby J, for members of the PoCT Trial
Management Committee: A pragmatic cluster randomised controlled trial
to evaluate the safety, clinical effectiveness, cost effectiveness and
satisfaction with point of care testing in a general practice setting -
rationale, design and baseline characteristics. Trials 2008, 9:50.
3. Friedman LM, Furberg CD, DeMets DL: Fundamentals of Clinical Trials. 2
edition. Boston: PSG, Inc; 1985.
4. Godwin M, Ruhland L, Casson I, MacDonald S, Delva D, Birtwhistle R,
Lam M, Seguin R: Pragmatic controlled clinical trials in primary care: the
Porzsolt et al. Health and Quality of Life Outcomes 2010, 8:125
/>Page 6 of 7
struggle between external and internal validity. BMC Med Res Methodol
2003, 3:28.
5. Thorpe KE, Zwarenstein M, Oxman AD, Treweek S, Furberg CD, Altman DG,
Tunis S, Bergel E, Harvey I, Magid DJ, Chalkidou K: A pragmatic-explanatory
continuum indicator summary (PRECIS): a tool to help trial designers. J
Clin Epidemiol 2009, 62:464-475.
6. Straus SE, Richardson WS, Glasziou P, Haynes RB: Evidence-Based Medicine.
How to practice and teach EBM Edinburgh: Elsevier Churchill Livingstone;
2005.
7. Porzsolt F, Pressel H, Maute-Stephan C, KIndervater R, Geldmacher J,
Meierkord S, Sigle JM, Eisemann M: Appraisal of healthcare: from patient
value to societal benefit. J Publ Health 2009.
8. Pindyck RS, Rubinfeld DL: Microeconomics. 6 edition. New Jersey: Prentice
Hall; 2005.
9. Beresniak A, Russell AS, Haraoui B, Bessette L, Bombardier C, Duru G:
Advantages and limitations of utility assessment methods in rheumatoid
arthritis. J Rheumatol 2007, 34:2193-2200.
10. Kymes SM, Lee BS: Preference-based quality of life measures in people
with visual impairment. Optom Vis Sci 2007, 84:809-816.
11. Huang ES, Shook M, Jin L, Chin MH, Meltzer DO: The impact of patient
preferences on the cost-effectiveness of intensive glucose control in
older patients with new-onset diabetes. Diabetes Care 2006, 29:259-64.
12. Kornmann M, Porzsolt F: Treatment preferences of physicians and lay
persons: lessons from a study analysing neoadjuvant treatment of rectal
carcinoma. J Clin Oncol 2008, 26:2866-4868.
13. Phillips KA, Maddala T, Johnson FR: Measuring preferences for health care
interventions using conjoint analysis: an application to HIV testing.
Health Serv Res 2002, 37:1681-1705.
14. Ratcliffe J, Van Haselen R, Buxton M, Hardy K, Colehan J, Partridge M:
Assessing patients’ preferences for characteristics associated with
homeopathic and conventional treatment of asthma: a conjoint analysis
study. Thorax 2002, 57:503-508.
15. Ross M, Avery A, Foss A: Views of older people on cataract surgery
options: an assessment of preferences by conjoint analysis. Qual Saf
Health Care 2003, 12:13-17.
16. Ryan M, Farrar S: Using conjoint analysis to elicit preferences for health
care. BMJ 2000, 320:1530-1533.
17. Stiggelbout AM, de Vogel-Voogt E, Noordijk EM, Vliet Vlieland TP: Individual
quality of life: adaptive conjoint analysis as an alternative for direct
weighting? Qual Life Res 2008, 17:641-649.
18. Kahneman D, Tversky A: An analysis of decision under risk. Prospect theory
Econometrica 1979, 47
:263-291.
19. Ortendahl M: Shared decision-making based on different features of risk
in the context of diabetes mellitus and rheumatoid arthritis. Ther Clin
Risk Manag 2007, 3:1175-1180.
20. Chin MH, Drum ML, Jin L, Shook ME, Huang ES, Meltzer DO: Variation in
treatment preferences and care goals among older patients with
diabetes and their physicians. Med Care 2008, 46:275-286.
21. Montori VM, Gafni A, Charles C: A shared treatment decision-making
approach between patients with chronic conditions and their clinicians:
the case of diabetes. Health Expect 2006, 9:25-36.
22. Sachverständigenrat zur Begutachtung der gesamtwirtschaftlichen
Entwicklung des Statistischen Bundesamts: Das Erreichte nicht verspielen.
Jahresgutachten; 2007 [ />download/gutachten/jg07_ges.pdf].
23. Committee on Comparative Effectiveness Research Prioritization, Institute of
Medicine: Initial National Priorities for Comparative Effectiveness Research
Washington, DC: Institute of Medicine; 2009.
doi:10.1186/1477-7525-8-125
Cite this article as: Porzsolt et al.: Preferences of diabetes patients and
physicians: A feasibility study to identify the key indicators for appraisal
of health care values. Health and Quality of Life Outcomes 2010 8:125.
Submit your next manuscript to BioMed Central
and take full advantage of:
• Convenient online submission
• Thorough peer review
• No space constraints or color figure charges
• Immediate publication on acceptance
• Inclusion in PubMed, CAS, Scopus and Google Scholar
• Research which is freely available for redistribution
Submit your manuscript at
www.biomedcentral.com/submit
Porzsolt et al. Health and Quality of Life Outcomes 2010, 8:125
/>Page 7 of 7