Báo cáo y học: "Re-inspiration of CO2 from ventilator circuit: effects of circuit flushing and aspiration of dead space up to high respiratory rate" pot
Bạn đang xem bản rút gọn của tài liệu. Xem và tải ngay bản đầy đủ của tài liệu tại đây (705.33 KB, 8 trang )
De Robertis et al. Critical Care 2010, 14:R73
/>Open Access
RESEARCH
BioMed Central
© 2010 De Robertis et al.; licensee BioMed Central Ltd. This is an open access article distributed under the terms of the Creative Com-
mons Attribution License ( which permits unrestricted use, distribution, and reproduc-
tion in any medium, provided the original work is properly cited.
Research
Re-inspiration of CO
2
from ventilator circuit: effects
of circuit flushing and aspiration of dead space up
to high respiratory rate
Edoardo De Robertis*
2
, Leif Uttman
1
and Björn Jonson
1
Abstract
Introduction: Dead space negatively influences carbon dioxide (CO
2
) elimination, particularly at high respiratory rates
(RR) used at low tidal volume ventilation in acute respiratory distress syndrome (ARDS). Aspiration of dead space
(ASPIDS), a known method for dead space reduction, comprises two mechanisms activated during late expiration:
aspiration of gas from the tip of the tracheal tube and gas injection through the inspiratory line - circuit flushing. The
objective was to study the efficiency of circuit flushing alone and of ASPIDS at wide combinations of RR and tidal
volume (V
T
) in anaesthetized pigs. The hypothesis was tested that circuit flushing and ASPIDS are particularly efficient
at high RR.
Methods: In Part 1 of the study, RR and V
T
were, with a computer-controlled ventilator, modified for one breath at a
time without changing minute ventilation. Proximal dead space in a y-piece and ventilator tubing (VD
aw, prox
) was
measured. In part two, changes in CO
2
partial pressure (PaCO
2
) during prolonged periods of circuit flushing and ASPIDS
were studied at RR 20, 40 and 60 minutes
-1
.
Results: In Part 1, VD
aw, prox
was 7.6 ± 0.5% of V
T
at RR 10 minutes
-1
and 16 ± 2.5% at RR 60 minutes
-1
. In Part 2, circuit
flushing reduced PaCO
2
by 20% at RR 40 minutes
-1
and by 26% at RR 60 minutes
-1
. ASPIDS reduced PaCO
2
by 33% at RR
40 minutes
-1
and by 41% at RR 60 minutes
-1
.
Conclusions: At high RR, re-breathing of CO
2
from the y-piece and tubing becomes important. Circuit flushing and
ASPIDS, which significantly reduce tubing dead space and PaCO
2
, merit further clinical studies.
Introduction
In acute respiratory distress syndrome, severe obstructive
lung disease, and at increased intracranial pressure it may
be important to maintain adequate CO
2
exchange at low
tidal volume ventilation (LTVV). LTVV will otherwise
lead to respiratory acidosis. To uphold CO
2
elimination,
increased respiratory rate (RR) may then be applied [1].
At high RR, when dead space as a fraction of tidal volume
increases, dead space reduction may be called for. A first
step is to reduce the volume of connectors and humidifi-
ers. A further step may be expiratory flushing of airways,
later denoted tracheal gas insufflation (TGI) [2,3]. TGI is
associated with problems related to humidification of the
injected gas and of local effects of the jet stream at the tip
of the tracheal tube. TGI will also disturb monitoring of
ventilation. Therefore, a new technique, aspiration of
dead space (ASPIDS) was developed and tested [4-6].
ASPIDS comprises two mechanisms, which are simulta-
neously activated late during expiration. One is aspira-
tion of gas from the tip of the tracheal tube that is
performed through a special lumen of the tracheal tube
or through a catheter ending close to the tip of the tra-
cheal tube. The other mechanism is gas injection through
the inspiratory line, Circuit Flushing. Circuit Flushing
compensates for the volume of aspirated gas and fills the
inspiratory system with fresh gas. Before the ensuing
inspiration, ASPIDS brings the interface between expired
gas and fresh gas down to the tip of the tracheal tube.
* Correspondence:
2
Department of Surgical, Anaesthesiological, and Intensive Care Medicine
Sciences, University of Napoli Federico II, Via S. Pansini 5, Naples, 80131, Italy
Full list of author information is available at the end of the article
De Robertis et al. Critical Care 2010, 14:R73
/>Page 2 of 8
After an ordinary expiration without ASPIDS or Circuit
Flushing, CO
2
is present at the start of inspiration in the
Y-piece, in adjacent parts of the inspiratory tube and also
in the expiratory tube. A volume of CO
2
representing
about 20 to 24 ml of alveolar gas is re-inspired from that
zone during the inspiration [7,8]. It was reasoned that
Circuit Flushing alone might clear this volume of CO
2
,
thereby reducing dead space.
No systematic study has previously been performed to
analyze how a wide range of RR and tidal volume (V
T
)
combinations affects re-inspiration of dead space gas
from the Y-piece and adjacent tubing. To what extent Cir-
cuit Flushing in itself contributes to the effects of ASPIDS
at different RR and V
T
has not been studied. The objec-
tive of this study was to quantify re-inspiration from the
Y-piece and adjacent parts of tubing at ordinary and
increased RR and to examine the extent at which Circuit
Flushing alone explains positive effects of ASPIDS at dif-
ferent combinations of RR and V
T
. The hypothesis was
tested that ASPIDS and Circuit Flushing are particularly
efficient at high RR.
Materials and methods
The Ethics Board of Animal Research of Lund University
approved the study. Five pigs of Swedish native breed
weighing 19 to 23 kg were premedicated with xylazine (2
mg·kg
-1
), ketamine (15 mg·kg
1
) and atropine (0.5 mg).
Anaesthesia was maintained by continuous intravenous
infusion of fentanyl (60 μg·kg
-1
·h
-1
), midazolam (0.7
mg·kg
-1
·h
-1
), and ketamine (7 mg·kg
-1
·h
-1
). Paralysis was
avoided to allow judgement of anaesthesia depth during
the experiments. However, no muscular movements were
observed. Initially the animals were hydrated with 1,000
ml Ringer-acetate (600 ml·h
-1
) followed by dextran at 200
ml·h
-1
. A femoral artery catheter was used for blood gas
sampling (Radiometer ABL725, Copenhagen, Denmark)
and blood pressure monitoring (HP 78353A). Mean arte-
rial pressure (MAP) and pulse rate (HR) were monitored.
Body temperature was maintained constant.
The animals were intubated with a 7.0 mm internal
diameter tracheal tube connected to a ventilator (Servo
Ventilator 900C, Siemens-Elema AB, Solna, Sweden). To
minimize circuit dead space, the Y-piece was directly
connected to the tracheal tube without swivel adaptor or
humidifier. Ventilation was volume-controlled with
square inspiratory flow pattern. At baseline, RR was 20
minutes
-1
, inspiratory time 33%, postinspiratory pause 5%
and positive end-expiratory pressure (PEEP) 4 cmH
2
O.
Below, RR is denoted RRnn, in which nn implies rate in
minutes
-1
. The baseline minute ventilation (MV) was
adjusted to achieve PaCO
2
of 5 to 5.5 kPa. A mainstream
CO
2
analyser (CO
2
Analyzer 930, Siemens-Elema, Solna,
Sweden) was used to measure airway partial pressure of
CO
2
at the proximal end of the tracheal tube (PawCO
2
).
The ventilator/computer system used for data recording
and computer control of the ventilator has been
described [9,10]. Signals from the ventilator and the CO
2
analyzer representing flow rate, airway pressure and
PawCO
2
were sampled at 100 Hz. Compliance of the tra-
cheal tube and ventilator tubing was measured in vitro.
The system was tested for leakage. The animals were
killed by an overdose of potassium chloride at the end of
the experiment. There were no dropouts.
ASPIDS circuit
The ASPIDS system, comprising the Servo Ventilator
900C, an electronic control unit, and two valves, has been
described in detail [5]. One valve, used for Aspiration,
connects a vacuum source to the aspiration catheter (ID
2.5 mm, OD 2.9 mm) ending 2 cm proximal to the tip of
the tracheal tube. The other, used for Circuit Flushing,
connects the bellow of the ventilator to the inspiratory
line, Figure 1. Aspiration and/or Circuit Flushing were
performed over the last 30% of expiration time. Flow rate
and volume for Aspiration and Circuit Flushing were
adjustable. Aspiration volume was 5 to 10 ml lower than
Circuit Flushing volume. The ASPIDS period is short at
high RR. Therefore, Circuit Flushing flow rate, being 0.22
L·sec
-1
at RR20 and 40, was increased to about 0.35 L·sec
-1
at RR60 to assure that flushing and aspiration volumes
were not less than 60 ml and sufficient to clear the tra-
cheal tube.
Protocol
After animal preparation, a stabilisation period at basal
ventilation was allowed for 60 minutes to establish a
steady state. The protocol had two parts. The experiment
was performed with a previously described computer
controlled ventilator [9].
Part 1: After the stabilisation period, the effect of differ-
ent combinations of RR and V
T
on dead space from the Y-
piece and adjacent parts of the ventilator tubing was ana-
lyzed without using ASPIDS or Circuit Flushing. At basal
ventilation at RR20, single breaths were modified, with
respect to RR and V
T
. Sequences of 10 breaths were
recorded. The second and seventh breaths were modified
under computer control. Between modified breaths were
ordinary breaths. The combination of RR and V
T
was for
each modified breath such that minute ventilation
remained unchanged. For modified breaths RR was 10,
30, 40, 50 or 60 minutes
-1
while V
T
was inversely modi-
fied. In randomized order, each RR-V
T
combination was
recorded three times. Other parameters like PEEP were
constant. The computer was programmed to modify sin-
gle breaths at a time to allow comparisons with ordinary
De Robertis et al. Critical Care 2010, 14:R73
/>Page 3 of 8
breaths within the same recording as in previous studies
[10-12].
In Part 2 measurements at steady state were made of
ventilation parameters, blood gases and haemodynamics
at basal ventilation, at Circuit Flushing alone and at com-
plete ASPIDS at various combinations of RR and V
T
.
PaCO
2
was measured every 10 minutes. Dead space can
not be measured during Circuit Flushing and ASPIDS.
The following scheme, also depicted in Figure 2, was fol-
lowed:
a. Basal ventilation at RR20. Measurements after 30
minutes.
b. Circuit Flushing started at RR20. Measurements
after 30 minutes.
c. Circuit Flushing stopped and RR increased to 40
minutes
-1
. Minute ventilation increased to maintain a
stable CO
2
elimination rate as read from the CO
2
ana-
lyzer. Measurements after 40 minutes.
d. Without changing RR, Circuit Flushing started.
Measurements after 30 minutes.
e. Aspiration started for complete ASPIDS. Measure-
ments after 30 minutes.
f. Circuit Flushing and aspiration stopped and RR
increased to 60 minutes
-1
. Minute ventilation
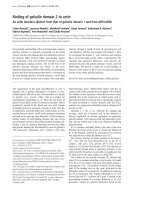
Figure 2 Protocol for Part 2. At RR 20, 40 and 60 equilibration time preceded measurements denoted M, during ordinary ventilation (NONE), Circuit
Flushing (Circuit Flush) and complete ASPIDS. Letters a-h correspond to instances described in the text.
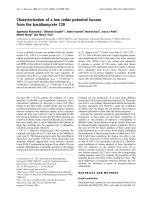
Figure 1 ASPIDS system. The Servo Ventilator 900C complemented by a system for Circuit Flushing (in red) and a system for aspiration of gas from
the tip of the tracheal tube (in blue). During Circuit Flushing only the red valve is opening during the last third of the expiration period. During ASPIDS
both red and blue valves are opening. A development suggested in the Discussion is to program the regular inspiratory flow regulating valve (Ins.) to
perform Circuit Flushing without any extra tube or other hardware.
De Robertis et al. Critical Care 2010, 14:R73
/>Page 4 of 8
increased to maintain stable CO
2
elimination rate.
Measurements after 40 minutes.
g. Procedure d repeated at RR60.
h. Procedure e repeated at RR60.
Data analysis
Sampled data of flow rate, airway pressure and PawCO
2
were transferred to a spreadsheet (Excel 2003, Microsoft,
Redmond, WA, USA). The single-breath test for CO
2
was
analyzed according to principles described by Beydon et
al [7]. The volume of CO
2
eliminated per breath (V
T
CO
2
)
corresponds to the area within the loop, Figure 3. The
volume of CO
2
re-inspired from the Y-piece and tubing
per breath (V
I
CO
2
) is reflected by the area to the right of
the loop. Dead space proximal to the CO
2
sensor caused
by V
I
CO
2
(VD
aw, prox
) was calculated:
Pe'CO
2
is the end-tidal CO
2
and Pbar barometric pres-
sure. VD
aw, prox
in % of V
T
is denoted VD
aw, prox
%.
Airway dead space distal to the CO
2
sensor (V
Daw
) was
determined according to an algorithm of Wolff and Brun-
ner [13] modified to correct for a sloping alveolar plateau
[10].
Statistical analysis
All data are expressed as mean ± standard deviation (SD).
Student's paired two-tailed t-test was used. Linear and
logarithmic regressions were applied. P values less than
0.05 were considered significant.
Results
During the whole procedure, all animals remained stable
with respect to oxygenation and arterial blood pressure.
Heart rate showed a trend to increase from on average 74
± 20 to 94 ± 22 minutes
-1
(Table 1).
Part 1
At increasing RR, VD
aw, prox
decreased from 31 ± 2 ml at
RR10 to 11 ± 2 ml at RR60 tightly according a logarithmic
equation (Figure 4). VD
aw, prox
% was 7.6 ± 0.5% at RR10
and increased logarithmically to 16 ± 2.5% at RR60 (Fig-
ure 4). Peak expiratory flow decreased with RR according
to the equation: y = - 0.33 Ln(RR) + 0.85, (R
2
= 0.99).
Part 2
Table 1 shows the effects of Circuit Flushing and ASPIDS
in comparison to basal ventilation at RR20 to 60. Minute
ventilation and V
T
were maintained at all settings.
Compared to baseline ventilation, Circuit Flushing
reduced PaCO
2
by 10, 20 and 26% at RR20, RR40 and
RR60, respectively. ASPIDS reduced PaCO
2
by 33% at
RR40 and 41% at RR60, Table 2. Accordingly, the reduc-
tion in PaCO
2
achieved by Circuit Flushing alone was at
RR40 60% of the total ASPIDS effect and 63% at RR60.
During Circuit Flushing and ASPIDS period PaCO
2
decreased fast during the first 10 minutes and later at a
slower rate in accordance with the equation: y = 0.0018x
2
-
0.085x + 5.3 (R
2
= 0.97) (Figure 5).
Discussion
The study was performed in healthy pigs to allow a
detailed analysis over several hours without problems
related to patient care and physiological stability. The
study relates to events in ventilator tubing, y-piece and
tracheal tube, which are relatively independent on the
physiology of the subject studied. The principle results
should be valid also in a clinical context. To what extent
the dead space reduction achieved with ASPIDS and Cir-
cuit Flushing is of clinical value can only be judged from
clinical studies.
In previous experiments with ASPIDS at health [4,6]
and in animals and patients with acute respiratory failure
[5,14] V
T
and airway pressures were reduced while nor-
mocapnia was maintained. The present study is the first
in which ASPIDS and also Circuit Flushing was shown to
modify PaCO
2
. This is also the first comprehensive analy-
sis of how a wide range of V
T
- RR combinations affect
(1)
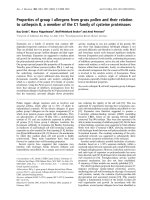
Figure 3 SBT-CO
2
of a representative animal. Partial pressure of CO
2
in expired gas (solid line) and inspired gas (dotted line) plotted against
volume so as to create a loop. The area within the loop corresponds to
tidal elimination of CO
2
(V
T
CO
2
). The area below the inspiratory limb
(grey) corresponds to re-inspired volume of CO
2
proximal of the CO
2
sensor (V
I
CO
2
). Airway dead space distal to the CO
2
sensor (V
Daw
) is in-
dicated (vertical interrupted line).
VD
aw, prox
=
V
I
CO
2
/
()
Pe'CO
2
/
Pbar
De Robertis et al. Critical Care 2010, 14:R73
/>Page 5 of 8
Table 1: Effects of Circuit Flushing and ASPIDS at increasing respiratory rate
RESPIRATORY
RATE
MV,
Lit.
VT,
ml
Pplat,
cmH
2
O
Cst,
ml/cmH
2
0
V'CO
2
ml/min
PaCO
2
,
kPa
pH
PaO
2
,
kPa
HR,
b/min
MAP,
mmHg
RR20 Baseline 4.1 ± 0.6 208 ± 31 14 ± 2.6 20 ± 3 133 ± 10 5.3 ± 0.2 7.47 ± 0.04 12.3 ± 1.2 74 ± 20 84 ± 17
After 30
minutes of
Circuit
Flushing
4.1 ± 0.6 208 ± 31 14 ± 3.5 4.7 ± 0.4 * 7.51 ± 0.04 * 12.6 ± 1.2 78 ± 20 ** 83 ± 15
RR40 Baseline 4.9 ± 0.5 130 ± 13 13 ± 3.7 15 ± 4 142 ± 20 5.9 ± 0.4 # 7.43 ± 0.04 10.7 ± 0.9 79 ± 15 81 ± 12
After 30
minutes of
Circuit
Flushing
4.9 ± 0.5 130 ± 13 14 ± 3.5 ** 4.7 ± 0.3 ** 7.51 ± 0.04 ** 12 ± 1.5 81 ± 13 80 ± 9
After 30
minutes of
Circuit
Flushing +
ASPIDS
4.9 ± 0.5 130 ± 13 13 ± 3.6 3.9 ± 0.2 * 7.58 ± 0.05 ** 12 ± 1.8 84 ± 11 79 ± 10
RR60 Baseline 5.9 ± 0.5 101 ± 9.5 13 ± 2.2 12 ± 2 136 ± 16 6.3 ± 0.4 # 7.40 ± 0.05 9.6 ± 1.3 84 ± 9 81 ± 9
After 30
minutes of
Circuit
Flushing
5.9 ± 0.5 101 ± 9.5 14 ± 2 4.6 ± 0.6 ** 7.51 ± 0.07 * 11.5 ± 2 * 91 ± 20 83 ± 9
After 30
minutes of
Circuit
Flushing +
ASPIDS
5.9 ± 0.5 101 ± 9.5 12 ± 2 ** 3.7 ± 0.5 ** 7.59 ± 0.07 ** 11.2 ± 2.8 94 ± 22 79 ± 11
* P < 0.01; ** P < 0.001 (comparison were made to the preceding value). # P <0.05 (comparison between baseline at RR40 and 60 vs baseline at RR20, and between baseline at RR60 vs baseline at RR40). ASPIDS, aspiration of
dead space; Cst, static compliance; HR, heart rate; MAP, mean arterial pressure; MV, minute ventilation; PaCO
2,
carbon dioxide arterial partial pressure; PaO
2,
oxygen arterial partial pressure; Pplat, plateau pressure; RR,
respiratory rate; V
T,
tidal volume; V'CO
2,
carbon dioxide production.
De Robertis et al. Critical Care 2010, 14:R73
/>Page 6 of 8
airway dead space resulting from re-inspiration of CO
2
from Y-piece and adjacent tubing. In confirmation of the
hypothesis it was shown that ASPIDS and Circuit Flush-
ing are particularly efficient at high RR. It was shown for
the first time that Circuit Flushing significantly may
enhance CO
2
elimination and reduce PaCO
2
through its
effects on VD
aw, prox
. This aspect may be important for
future development because Circuit Flushing can very
easily be implemented as further discussed below.
In Part 1 it was shown that V
Daw, prox
in ml decreased at
higher RR and correspondingly lower V
T
, in line with pre-
vious observations [10]. This reflects that V
Daw, prox
reflects admixture of CO
2
to the inspiratory ventilator
line during expiration and re-inspiration of CO
2
from
both ventilator lines during inspiration. These phenom-
ena are related to diffusion, turbulence, Venturi, and
Coandă effects around the Y-piece [7,8,10]. At higher RR,
less time is available for these phenomena, while expira-
tory flow rate that promotes gas mixing in tubing around
the y-piece is lower, as shown. Thereby, V
Daw, prox
becomes lower at high RR. However, V
Daw, prox
% increased
two-fold over the interval RR10 to RR60 in spite of that
V
Daw, prox
in ml fell to one third. These data (Figure 4)
show that the importance of CO
2
re-inspiration from
ventilator lines and Y-pieces increases at a high RR which
is essential for understanding the results in Part 2.
Fletcher et al. suggested the use of non-return valves in
the Y-piece to avoid re-breathing [8]. Safety issues might
be a reason why such valves have not been introduced. At
present the need for ventilation at low V
T
and high RR
asks for a safe solution of the significant re-breathing
problem.
In Part 2, a period of 30 to 40 minutes was allowed for
steady state establishment on the basis of previous data
[15]. Longer periods would increase risks of significant
changes in physiological status of the animals. Data in
Figure 5 confirm that a steady state was achieved.
ASPIDS clears the tubing of CO
2
down to the tip of the
tracheal tube, while Circuit Flushing only clears tubes to
and into the y-piece. Therefore, as expected, the effect on
PaCO
2
of ASPIDS was more important than that of Cir-
cuit Flushing. Still, the effect of Circuit Flushing was
about 60% of the full ASPIDS effect. This reflects that the
y-piece was connected directly to the tracheal tube,
thereby minimising the apparatus dead space that is
cleared of CO
2
only by ASPIDS. While ASPIDS optimally
reduces re-inspiration of CO
2
from ventilator lines, Cir-
cuit Flushing is an easier technique to implement. No
extra tube or channel is needed in the tracheal tube and
no system for aspiration. As many modern ventilators
Figure 4 Proximal airway dead space in ml (VD
aw, prox
), and in % of
tidal volume (VD
aw, prox
%) related to respiratory rate (RR). Black
lines represent the logarithmic fit.
y = -11.01Ln(x) + 55.88
R
2
= 0.99
y = 4.96Ln(x) - 3.75
R
2
= 0.97
0
5
10
15
20
25
30
35
0 10203040506070
RR
,
min
-1
V
D
aw,prox
,
ml
0
3
6
9
12
15
18
V
D
aw,prox
%
VDaw,prox
VDaw,prox%
Table 2: Change in PaCO
2
in % of baseline value at each RR
RR, min-1
20 40 60
Change in PaCO
2
in % of baseline value at each RR
Circuit Flushing -10.3 ± 4, P = 0.005 -20 ± 3, P = 0.0002 -26 ± 7, P = 0.001
ASPIDS 33 ± 5, P = 0.0004 -41 ± 6, P = 0.0002
ASPIDS, aspiration of dead space; PaCO
2,
carbon dioxide arterial partial pressure; RR, respiratory rate.
Figure 5 Average of PaCO
2
evolution during Circuit Flushing and
ASPIDS periods.
y = 0.0018x
2
- 0.0853x + 5.3162
R
2
= 0.9662
3
4
5
6
7
0 102030
Time, min
PaCO
2
, kPa
De Robertis et al. Critical Care 2010, 14:R73
/>Page 7 of 8
have a computer controlled inspiratory pneumatic sys-
tem, Circuit Flushing can be achieved by programming
this system to perform Circuit Flushing without any extra
tubes, valves or other hardware.
In a recent Editorial Frutos-Vivar et al. suggested that
in ARDS 'the ideal ventilation would be that one that does
not damage respiratory muscles or lung parenchyma' and
'that individual tailoring may be necessary' [16]. Lung
parenchyma is damaged by barotrauma, related to high
airway pressure, and by shearing forces at tidal lung col-
lapse and re-opening. Limitation of airway pressure to
prevent barotrauma while applying a PEEP high enough
to keep the lung open, calls for low or even very low V
T
.
One must consider that a particular dead space reduction
allows more than an equal reduction in V
T
, because it
also paves the way for an extra increase in RR and a sec-
ondary reduction in V
T
. This can be understood by con-
sidering a system in which dead space would approach
zero. Then, V
T
can be reduced toward zero by approach-
ing infinite RR. PEEP and peak pressure would be similar
and lung protection from damaging forces could be truly
optimized. The more efficient elimination of CO
2
using
Circuit Flushing and ASPIDS at RR40 and RR60 would in
a clinical setting allow a significant reduction in V
T
and
serve as one step in the direction of lung protection. It is
realized that tailoring means much more. In an animal
ARDS model, Uttman et al. recently studied how V
T
might be reduced by tailoring ventilation to actual lung
mechanics and dead space [17]. V
T
could be modestly
reduced from 7.2 to 6.6 ml/kg when RR was increased
from 40 to 60 minutes
-1
and other ventilation parameters
optimized. By using ASPIDS, V
T
could be further reduced
to 4.0 ml/kg at RR of 80 minutes
-1
. It is realized that appli-
cation of very high respiratory rates is associated with
high requirements of tuning ventilation to circumstances.
It is associated with significant difficulties with respect to
monitoring. Dead space reduction is only a part of a com-
plex strategy. With all respect for the difficulties, it is time
to perform clinical studies in which true tailoring of ven-
tilation to physiology is adapted to clinical circumstances
and then to apply such techniques in controlled studies.
Conclusions
In conclusion, re-breathing of CO
2
rich gas present in the
circuit line, although not clinically relevant at health and
at low respiratory rates, should be considered when high
frequencies are used. Circuit Flushing and ASPIDS were
confirmed to be safe and efficient techniques to reduce
tubing dead space, re-breathing of CO
2
and, accordingly,
PaCO
2
. Our results merit further studies in clinical set-
tings and in different categories of critically ill patients.
Key messages
• Re-breathing of CO
2
, although not clinically rele-
vant at health and at low RR, should be considered at
high RR.
• Minimizing circuit dead space, Circuit Flushing
explains 60% of the full Aspiration of dead space.
• Circuit Flushing and Aspiration of dead space are
safe and efficient techniques to reduce tubing dead
space, re-breathing of CO
2
and, PaCO
2
.
Abbreviations
ASPIDS: aspiration of dead space; LTVV: low tidal volume ventilation; MV: min-
ute ventilation; PawCO
2
: airway partial pressure of CO
2
at the proximal end of
the tracheal tube; PEEP: positive end-expiratory pressure; RR: respiratory rate;
TGI: tracheal gas insufflation; VD
aw, prox
: proximal airway dead space; V
Daw
: air-
way dead space; V
I
CO
2
: CO
2
re-inspired from Y-piece and tubing per breath; V
T
:
tidal volume; V
T
CO
2
: volume of CO
2
eliminated per breath.
Competing interests
The authors declare that they have no competing interests.
Authors' contributions
EDR designed the study, carried out the experiments, analysed row data and
drafted the manuscript. LU carried out the experiments and analysed row data.
BJ participated in the study design, coordinated the study, and helped to draft
the manuscript. All authors read and approved the final manuscript.
Acknowledgements
We thank the International Programs Office of the University of Napoli Federico
II and the Heart-Lung foundation, Sweden for financial support.
We thank Gert-Inge Jönsson for the construction of the ASPIDS device, Elisabet
Åström and Lisbet Niklason for valuable assistance during experiments and in
data analysis.
Author Details
1
Department of Clinical Physiology, Lund University and Lund University
Hospital, S-221 85, Lund, Sweden and
2
Department of Surgical,
Anaesthesiological, and Intensive Care Medicine Sciences, University of Napoli
Federico II, Via S. Pansini 5, Naples, 80131, Italy
References
1. The Acute Respiratory Distress Syndrome Network: Ventilation with
lower tidal volumes as compared with traditional tidal volumes for
acute lung injury and the acute respiratory distress syndrome. N Engl J
Med 2000, 342:1301-1308.
2. Jonson B, Similowski T, Levy P, Viires N, Pariente R: Expiratory flushing of
airways: a method to reduce deadspace ventilation. Eur Respir J 1990,
3:1202-1205.
3. Marini JJ: Tracheal gas insufflation: a useful adjunct to ventilation?
Thorax 1994, 49:735-737.
4. De Robertis E, Sigurdsson S, Drefeldt B, Jonson B: Aspiration of airway
dead space. A new method to enhance CO2 elimination. Am J Respir
Crit Care Med 1999, 159:728-732.
5. De Robertis E, Servillo G, Jonson B, Tufano R: Aspiration of dead space
allows normocapnic ventilation at low tidal volumes in man. Intensive
Care Med 1999, 25:674-679.
6. De Robertis E, Servillo G, Tufano R, Jonson B: Aspiration of dead space
allows isocapnic low tidal volume ventilation in acute lung injury.
Relationships to gas exchange and mechanics. Intensive Care Med 2001,
27:1496-1503.
7. Beydon L, Uttman L, Rawal R, Jonson B: Effects of positive end-expiratory
pressure on dead space and its partitions in acute lung injury. Intensive
Care Med 2002, 28:1239-1245.
Received: 27 August 2010 Revised: 24 November 2010
Accepted: 26 April 2010 Published: 26 April 2010
This article is available from: 2010 De Robertis et al.; licensee BioMed Central Ltd. This is an open access article distributed under the terms of the Creative Commons A ttribution License ( which permits unrestricted use, distribution, and reproduction in any medium, provided the original work is properly cited.Critical Care 2010, 14:R73
De Robertis et al. Critical Care 2010, 14:R73
/>Page 8 of 8
8. Fletcher R, Werner O, Nordstrom L, Jonson B: Sources of error and their
correction in the measurement of carbon dioxide elimination using
the Siemens-Elema CO
2
Analyzer. Br J Anaesth 1983, 55:177-185.
9. Svantesson C, Drefeldt B, Sigurdsson S, Larsson A, Brochard L, Jonson B: A
single computer-controlled mechanical insufflation allows
determination of the pressure-volume relationship of the respiratory
system. J Clin Monit Comput 1999, 15:9-16.
10. Åström E, Uttman L, Niklason L, Aboab J, Brochard L, Jonson B: Pattern of
inspiratory gas delivery affects CO
2
elimination in health and after
acute lung injury. Intensive Care Med 2008, 34:377-384.
11. Devaquet J, Jonson B, Niklason L, Si Larbi AG, Uttman L, Aboab J, Brochard
L: Effects of inspiratory pause on CO
2
elimination and arterial PCO
2
in
acute lung injury. J Appl Physiol 2008, 105:1944-1949.
12. Aboab J, Niklason L, Uttman L, Kouatchet A, Brochard L, Jonson B: CO
2
elimination at varying inspiratory pause in acute lung injury. Clin
Physiol Funct Imaging 2007, 27:2-6.
13. Wolff G, Brunner JX: Series dead space volume assessed as the mean
value of a distribution function. Int J Clin Monit Comput 1984, 1:177-181.
14. Uhlig S, Ranieri M, Slutsky AS: Biotrauma hypothesis of ventilator-
induced lung injury. Am J Respir Crit Care Med 2004, 169:314-315.
15. Taskar V, John J, Larsson A, Wetterberg T, Jonson B: Dynamics of carbon
dioxide elimination following ventilator resetting. Chest 1995,
108:196-202.
16. Frutos-Vivar F, Ferguson ND, Esteban A: Mechanical ventilation: quo
vadis? Intensive Care Med 2009, 35:775-778.
17. Uttman L, Ögren H, Niklason L, Drefeldt B, Jonson B: Computer
simulation allows goal-oriented mechanical ventilation in acute
respiratory distress syndrome. Crit Care 2007, 11:R36.
doi: 10.1186/cc8986
Cite this article as: De Robertis et al., Re-inspiration of CO2 from ventilator
circuit: effects of circuit flushing and aspiration of dead space up to high
respiratory rate Critical Care 2010, 14:R73