Báo cáo y học: "Validation of extravascular lung water measurement by single transpulmonary thermodilution: human autopsy study" doc
Bạn đang xem bản rút gọn của tài liệu. Xem và tải ngay bản đầy đủ của tài liệu tại đây (303.2 KB, 8 trang )
RESEARC H Open Access
Validation of extravascular lung water
measurement by single transpulmonary
thermodilution: human autopsy study
Takashi Tagami
1*
, Shigeki Kushimoto
2
, Yasuhiro Yamamoto
3
, Takahiro Atsumi
2
, Ryoichi Tosa
1
, Kiyoshi Matsuda
4
,
Renpei Oyama
5
, Takanori Kawaguchi
6
, Tomohiko Masuno
2
, Hisao Hirama
1
, Hiroyuki Yokota
2
Abstract
Introduction: Gravimetric validation of single-indicator extravascular lung water (EVLW) and normal EVLW values
has not been well studied in humans thus far. The aims of this study were (1) to validate the accuracy of EVLW
measurement by single transpulmonary thermodilution with postmortem lung weight measurement in humans
and (2) to define the statistically normal EVLW values.
Methods: We evaluated the correlation between pre-mortem EVLW value by single transpulmonary thermodilution
and post-mortem lung weight from 30 consecutive autopsies completed within 48 hours following the final
thermodilution measurement. A linear regression equation for the correlation was calculated. In order to clarify the
normal lung weight value by statistical ana lysis, we conducted a literature search and obtained the normal
reference ranges for post-mortem lung weight. These values were substituted into the equation for the correlation
between EVLW and lung weight to estimate the normal EVLW values.
Results: EVLW determined using transpulmonary single thermodilution correlated closely with post-mortem lung
weight (r = 0.904, P < 0.001). A linear regression equation was calculated: EVLW (mL) = 0.56 × lung weight (g) -
58.0. The normal EVLW values indexed by predicted body weight were approximately 7.4 ± 3.3 mL/kg (7.5 ± 3.3
mL/kg for males and 7.3 ± 3.3 mL/kg for females).
Conclusions: A definite correlation exists between EVLW measured by the single-indicator transpulmonary
thermodilution technique and post-mortem lung weight in humans. The normal EVLW value is approximately 7.4 ±
3.3 mL/kg.
Trial registration: UMIN000002780.
Introduction
Pulmonary edema is one of the most common problems
in critically ill patients and has a profound effect on
patient outcome [1,2]. In general, pulmonary edema is
diagnosed on the basis of patient history, physical exam-
ination, routine laboratory examination, and chest radio-
graphic findings [2,3]. However, interpretation of these
parameters is often limited by a c ertain degree of sub-
jectivity that may cause interobserver error even among
experts [4,5]. In addition, clinical symptoms may be
undetectable in the incipient stages of edema. The diffi-
culties faced during quantification of pulmonary edema
were addressed many years ago [6-8]. However, attempts
to develop direct or indirect methods of measuring
edema turned out to be lacking in either sensitivity or
specificity.
The i ntroductio n of the double-indicator thermodilu-
tion technique made it possible to measure extravascular
lung water (EVLW) and demonstrated excellent correla-
tion between in vivo and postmortem gravimetric
EVLW values in both animal and human lungs [ 9,10].
However, this method was cumbersome and too techni-
cally challenging for application in routine clinical prac-
tice. Therefore, it remained largely a research tool.
* Correspondence:
1
Department of Emergency and Critical Care Medicine, Aidu Chuo Hospital,
1-1 Tsuruga, Aiduwakamatsu, Fukushima, 965-8611, Japan
Full list of author information is available at the end of the article
Tagami et al. Critical Care 2010, 14:R162
/>© 2010 Tagami et al.; licensee BioMed Central Ltd. This is an open access article distributed under the terms of the Creative Commons
Attribution Lice nse (http://c reativecommons.org/licenses/by/2.0), which permits unrestri cted use, distribu tion, and reproduction in
any medium, provided the original work is properly cited.
For EVLW evaluation in the clinical setting, the d ou-
ble-indicator technique has been replaced by the single-
indicator technique, which is implemented in the
PiCCO monitoring system (Pulsio n Medical Systems,
Munich, Germany). EVLW measured by this method
has been shown to correlate closely with both the
double-indicator technique [11,12] and the gravimetric
measurement of lung weight in experimental animal
models [13-15]. However, the correlation between
single-indicator EVLW and postmortem lung weight in
humans has not yet been studied.
Furthermore, validated normal EVLW values by both
the double- and s ingle-indicator methods remain unre-
ported. In general, the standard method for determining
a normal value is to define and obtain a healthy pop ula-
tion of at least 120 individuals [16]. In 1983, Sibbald
and colleagues [17] defined the normal mean EVLW as
5.6 mL/kg (3.0 to 8.8 mL/kg) by using the double-
indicator t echnique. However, they included only
16 patients and all of the ‘normal’ patients were criti-
cally ill and mechanically ventilated without pulmonary
edema diagnosed on the basis of portable chest roent-
genogram findings. A similar definition was reported in
1986 by Baudendistel and colleagues [18], who used the
single-indicator method and reported that a mean
EVLW of 5.1 mL/kg (2.4 to 10.1 mL/kg) obtained from
6 ‘normal’ critically ill patients constituted the ‘normal’
EVLW content in the human lung. These ‘normal’ criti-
cally ill patients remained free of both radiographic
abnormalities typical of pulmonary edema and physiolo-
gical evidence of pulmonary dysfunction. However, sev-
eral studies have indicated that in critically ill patients,
chest r oentgenograms are not accurate for monitoring
modest changes in lung water and that gas exchange
abnormalities or dyspnea appears only when EVLW
reaches twice its baseline level [6,19].
So far, no study has defined normal EVLW values
using the PiCCO system. Most clinical studies have
bee n conducted on critically ill patients as subjects who
would not present with normal EVLW [11,20]. In sev-
eral clinical studies, researchers have considered EVLW
values of below 7 mL/kg to be normal [21-26]. However,
others have reported EVLW values of below 10 mL/kg
to be normal [27-29]. Recently, Craig and colleague s
[21] argued that there is a lack of consensus as to what
constituted a normal value. Therefore, our study aimed
(a) to vali date EVLW accuracy using the PiCCO system
by postmortem lung weight measurement of the human
lung and (b) to define normal EVLW values.
Materials and methods
This study was approved by our institutional review
board and was registered with the University Hospital
Medical Information Network Clinical Trials Registry
(UMIN-CTR ID UMIN000002780). The study involved
the following three processes.
1. Examination of the correlation between single-
indicator EVLW and postmortem lung weight
We studied 30 consecutive autopsy cases (24 males and
6 females) in which EVLW was measured using the
PiCCO system just prior to death from July 2004 to
September 2009 in four teachi ng hospi tals. Clinical data
were obtained from medical records.
A 4 F or 5 F femoral arterial thermistor-tipped cathe-
ter (PV2014L16 or PV2015L20; Pulsion Medical Sys-
tems) was inserted in all patients and connected to the
PiCCO monitor. The PiCCO monitor uses a single-ther-
mal indicator technique to calculate the cardiac output
(CO), global end-diastolic volume (GEDV), EVLW, and
other volumetric parameters. A 15-mL bolus of 5% glu-
cose at 5°C was injected through a central venous cathe-
ter, and CO was calculated using the Stewart-Hamilton
method. Concurrently, the mean transit time and the
exponential downslope time of the transpulmonary ther-
modilution curve were calculated. The product of CO
and mean transit time represents the intrathoracic ther-
mal volume (ITTV) [11]. The product of CO and expo -
nential downslope time is the pulmonary thermal
volume (PTV) [30]. GEDV is calculated as the difference
between the ITTV and PTV, which represents the com-
bined end-diastolic volumes of four cardiac chambers.
This allows the calculation of intrathoracic blood
volume (ITBV) from the linear relatio nship with GEDV:
ITBV = [1.25 × GEDV] - 28.4 [11]. EVLW is the differ-
ence between the ITTV and the ITBV [11,12]. The
detailed principles and calculations involved in deriving
EVLW using thermodilution techniques are discussed
elsewhere [20,31].
The median EVLW value after three bolus injections
of 15 mL each was analyzed for each measurement. The
absolute EVLW value was indexed to actual body weight
(EVLW
a
) and predicted body weight ( EVLW
p
), which
was calcula ted as 50 + 0.91 (height in c entimeters -
152.4) for males and 45.5 + 0.91 (height in centimeters -
152.5) for females [21,32,33].
To calculate arterial partial pressure of oxygen/frac-
tion of inspired oxygen (PaO
2
/FiO
2
or P/F ) ratio, blood
samples were taken via the arterial catheter within 60
minutes before or after the EVLW measurement. Chest
roentgenograms were obtained at the bedside on the
same day. The correlation between lung injury score
(LIS) and EVLW was evaluated to investigate the c orre-
lation between EVLW and lung damage. The timing of
the EVLW measurement and measurement of other
parameters was left to the doctors in charge.
Following death, written informed consent was
obtained from the family of each patient prior to
Tagami et al. Critical Care 2010, 14:R162
/>Page 2 of 8
autopsy. Experienced pathologists blinded to the study
objectives completed all autopsies within 48 hours aft er
the final thermodilution EVLW measurement had been
performed by the attending p hysicians. We chose 48
hours as a cutoff point for inclusion in the study
because postmortem lung weight shows little change in
the early postmortem period (4. 5 to 72 hours) [34].
Prior to autopsy, cadavers were kept in accordance with
the policy of each institution. As a result, 23 out of 30
cadavers had been kept in a refrigeration chamber. The
remaining 7 cadavers, which had not been refrigerated,
underwent autopsy within the 6 hours subsequent to
the final EVLW recording.
Body weights and heights of all patients, with the
exception of 9 patients whose measurements were per-
formed at the bedside, were measured at autopsy. Dur-
ing autopsy, the weight of both lungs was measured
after determining the amount of pleural effusion before
formalin fixation.
We derived a linear regression equation after evaluat-
ing the correlation between the final EVLW measured
by the PiCCO system and postmortem lung weight.
We also evaluated the influence of s ex, high LIS (>2.5),
large volumes of pleural effusion (> 500 mL), low car-
diac index (CI) (<2.5 L/min per m
2
), high central
venous pressure (CVP) (>12 mm Hg), high positive
end-expiratory pressure (PEEP) (>10 cm H
2
O), time
delay before the autopsy (>24 hours), cause of death as
diagnosed by the pathologist (respiratory cause of
death or non-respiratory cause of death), and perfor-
mance of cardiopulmonary resuscitatio n (CPR) o n ther-
modilution measurements.
2. Identification of reference ranges for normal lung
weight
The normal value of a clinical measurement is usually
defined by Gaussian distribution, which constitutes
from the central 95% (or 2 standard deviations [SDs])
value of the healthy population [16,35]. We referred to
data from several publications to estimate the normal
reference range of human lung weight [36-39]. Sawabe
and colleagues [38] reporte d standard organ weights
using data from 1, 615 older Japanese pati ents who died
in hospitals i n Japan. The age distribution of o ur study
population matched that of the population in their
study. Sawabe and colleagues strictly excluded patients
with abnormal lungs such as those with pneumonia or
diffuse alveolar damage and p atients with mal ignant
tumors identified at autopsy. Along with primary exclu-
sions, they excluded organs with off-limit values beyond
99% of bilateral limits. We believe that these criteria
make their study protocol particularly robust. Therefore,
we considered their data to be representative of normal
lung weights.
3. Calculation of normal EVLW and EVLW
p
values
Using the linear regression equation for the correlation
between transpulmonary EVLW measurement and post-
mortem lung weight in equation 1 (see Results), we cal-
culated thermodilution EVLW values for normal lungs
using the lung weight values reported in the literature.
Traditionally, EVLW has been indexed to actual body
weight, with the value being expressed as EVLW in
milliliters per kilogram. However, several recent clinical
studies have found that indexing EVLW to predicted
body weight (EVLW
p
), instead of actual body weight
(EVLW
a
), improves the predictive value of EVLW for
patient survival and correlation with markers of disease
severity [21,29,33]. Therefore, we expressed normal
EVLW values as EVLW
p
.
Statistical analysis
Data were presented as mean values ± SD or as the med-
ian (interquartile range, IQR), depending on the distribu-
tion normality of the variable. In keeping with the
literature, reference ranges for lung weights were
expressed as mean ± SD. Cadavers were categorized into
several groups and were compared using two-sample t
tests or the Mann-Whitney U test for normally and non-
normally distributed data, respectively. Postmortem lung
weight was compared with EVLW, which was calculated
using the single-indicator transpulmonary thermodilu-
tion method by Spearman’s correl ation coefficient (r).
Because our present study compared the indicator dilu-
tion of EVLW (in milliliters) and postmortem lung
weight (in grams), we did not use the Bland-Altman plot
analysis. It is not possible to analyze different parameters
by a Bland-Altman plot analysis. Therefore, we expressed
the data in terms of correlation coefficients. The regres-
sion line was calculat ed using Passing and Bablok regres-
sion. The difference between any two correlation
coe fficients was tested by the z test after Gaussian trans-
formation of the coefficients. R eproducibility of EVLW
measurements was assessed by the coefficient of variation
(CV) and intraclass correlation coefficient (ICC). ICC
uses components of variance from a variance analysis
and assesses the agreement of quantitative measurements
in te rms of consistency and conf ormity [40,41] . The ICC
ranges from 0 to 1, where 1 demonstrates perfect reliabil-
ity. To assess the intraobserver reliability, ICC (1, 1) was
used for single-measure reliability and ICC (1, 3) was
used for reliability over an average of three measure-
ments. A P value of less than 0.05 was considered signifi-
cant. Statistical anal yses were perform ed using SP SS 17.0
for Windows (SPSS, Inc., Chicago, IL, USA) for all tests
except Passing and Bablok regression analysis and com-
parison of correlation coefficients, which were performed
using the software StatF lex 6.0 for Wi ndows (Artech Co.
Ltd, Osaka, Japan).
Tagami et al. Critical Care 2010, 14:R162
/>Page 3 of 8
Results
All autopsies wer e completed within 48 hour s (range of
1 to 47 hours) following the final thermodilution EVLW
measurement. Median time from the final measurement
to death was 5 hours and 7 minutes. Median time from
death to the beginning of the autopsy was 9 hours and
16 minutes, and the median time from the final mea-
surement to the beginning of t he autopsy was 17 hours
and 39 minutes.
Table 1 summarizes the clinic al and autopsy findings.
The amount of pleural effusion measured ranged from
10 to 1,600 mL. Twenty-eight patients (93%) were
mechanically ventilated and the median PEEP in these
patients was 8 cm H
2
O (IQR = 5.0 to 10.0 cm H
2
O).
Causes of death d iagnosed by a pathologist included the
following: multiple organ failure ( n = 12 patients), pneu-
monia (n = 6), heart failure (n = 6), acute respiratory
distress syndrome (ARDS) due to sepsis (n =4),and
multiple trauma (n = 2). Overall, there were 10 patients
with respiratory causes of death (RF): 6 patients with
pneumonia and 4 patients with ARDS. There were 20
patients without respiratory causes of death (non-RF).
The EVLW
p
was significantly higher in the RF group
than in the non-RF group (17.1 mL/kg [IQR = 12.9 to
22.0 mL/kg] versus 10.1 mL/kg [IQR = 8.9 to 12.2 mL/
kg]; P = 0.01). Comparisons of other parameters
between RF and non-RF were as follows: lung weight
(1,610 g [IQR = 1,500 t o 2,120 g] versus 1,212 g [IQR =
960 to 1,360 g]; P =0.004),PaO
2
/FiO
2
(84.8 ± 49 mm
Hg versus 176.0 ± 116 mm Hg; P = 0.008), LIS (3 [IQR
= 2.3 to 3.6] versus 2 [IQR = 1 to 2.3]; P = 0.003), PEEP
(8 cm H
2
O[IQR=6to10cmH
2
O] versus 5 c m H
2
O
[IQR = 4 to 9 cm H
2
O]; P = 0.17), and pleural effusion
(550 mL [IQR = 370 to 850 mL] versus 500 mL [IQR =
300 to 865 mL]; P = 0.22).
No difference in lung weight was demonstrated
between patients whose autopsy was started within 24
hours (early group; n = 20, 1,315 g [IQR = 1,270 to
1,600 g]) and those whose autopsy was started later
than 24 hours (late group; n = 10, 1,320 g [IQR = 930
to 1,757 g]) (P = 0.79).
CPR was performed in 16 cases (53%). Median lung
weights were 1,285 g (IQR = 950 to 1,672 g) in the CPR
group and 1,430 g (IQR = 1,200 to 1, 620 g) in the non-
CPR group. There was no statistical difference between
the groups (P=0.59).
Reproducibility of EVLW measurements
The CV of EVLW measurement in the present study
was 7.4%. ICC (1, 1) and ICC (1, 3) of EVLW measure-
mentinthepresentstudywere0.97and0.99,
respectively.
Correlation between single-indicator EVLW and
postmortem lung weight
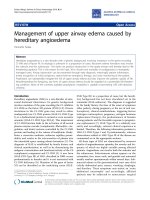
We found a very close correlation between transpul-
monary measurement of EVLW and postmortem lung
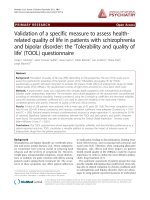
weight (r =0.904;P < 0.001) (Figure 1). The linear
regression equation for correlation was as follows:
EVLW in milliliters 56 lung weight in grams 58
()
=×
()
−[. ] 00
(1)
Table 1 Patient characteristics
Characteristics Value
Age, years 68.0 (60.0-77.0)
Height, m 1.63 (1.56-1.72)
Actual weight, kg 65.0 (54.6-70.0)
Predicted body weight, kg 57.3 (52.4-61.5)
Postmortem lung weight, g 1,320 (1,170-1,620)
Pleural effusion, mL 500 (300-850)
EVLW, mL 655 (553-856)
EVLW
a
, mL/kg 12.0 (8.4-14.4)
EVLW
p
, mL/kg 11.6 (9.7-16.3)
Lung injury score 2.3 (1.3-3.0)
PaO
2
/FiO
2
, mm Hg 145 ± 107
Cardiac index, L/min per m
2
3.3 ± 1.3
All values are expressed as median (first to third quartile) or as mean ±
standard deviation. EVLW, extravascular lung water; EVLW
a
, extravas cular lung
water indexed to actual body weight; EVLW
p
, extravas cular lung water
indexed to predicted body weight; PaO
2
/FiO
2
, arterial partial pressure of
oxygen/fraction of inspired oxygen.
Figure 1 Correlation of extravascular lung water (EVLW)
measured by single transpulmonary thermodilution and by
postmortem lung weight. EVLW (in milliliters) = [0.56 × lung
weight (in grams)] - 58.0. n = 30, r = 0.90, P < 0.001. Line of identity
is dashed.
Tagami et al. Critical Care 2010, 14:R162
/>Page 4 of 8
For the correlation between transpulmonary measure-
ment of EVLW and postmortem lung weight, no signifi-
cant difference was observed between sexes (males: n =
24, r = 0.846, P < 0.001; females: n =6,r = 0.943, P =
0.005; difference of correlation coefficient: P = 0.72).
Furthermore, no significant difference was found
between patients whose pleural effusion amounts were
less than or more than 500 mL (≤500 mL: n = 13, r =
0.89, P < 0.001; >500 mL: n = 17, r =0.92,P <0.001;
difference of c orrelation coefficient: P = 0.13); between
low- and high-LIS patients (LIS ≤2.5: n =18,r =0.84,
P < 0.001; LIS >2.5: n = 12, r = 0.95, P < 0.001; differ-
ence of correlation coefficient: P = 0.27); or b etween
high- and low-CI patients (CI >2.5 L/min per m
2
: n =
20, r = 0.84, P < 0.01; CI ≤2.5 L/min per m
2
: n = 10, r =
0.96, P < 0.01; difference of coefficient of correlation:
P = 0.65). Very c lose correlations were demonstrated
with both the high-CVP group (>12 mm Hg; n = 13, r =
0.94, P <0.01)andthelow-CVPgroup(≤12 mm Hg;
n =17,r =0.89,P < 0.01), with no statistical difference
in coefficient of correlation (P = 0.12). Very close corre-
lation was a lso demonstrated between the high-PEEP
group(>10cmH
2
O; n =9,r =0.95,P <0.01)andthe
low-PEEP group (≤10 cm H
2
O; n =21,r = 0.87, P <
0.01), with no statistical difference in the coefficient of
correlation (P = 0.6 0). No significant difference was
observed between the RF and non-RF groups (RF: r =
0.84, P <0.01;non-RF:r =0.93,P < 0.01; difference of
coefficient of correlation: P = 0.39), between the early
and late autopsy groups (early versus late: r = 0.93, P <
0.01 versus r = 0.83, P < 0.01; difference of coefficient of
correlation: P = 0.39), or between the groups in which
CPR was or was not performed (CPR group: r =0.88,P
< 0.0 1; non-CPR group: r =0.90,P < 0.01; difference of
coefficient of correlation: P = 0.68).
Correlation between single-indicator EVLW and other
parameters
A moderate correlation was found between LIS and
lung weight/predicted body weight (PBW) (r =0.56,
P < 0.001). A similar result was found between LIS,
EVLW
p
(r = 0.61, P < 0.001), and EVLW
a
(r = 0.54,
P = 0.002). A moderate negative correlation was found
between P/F ratio and EVLW
p
(r = -0.41, P = 0.02).
Neither lung weight/PBW (r = -0.32, P = 0.07) nor
EVLW
a
(r =-0.32,P = 0.07) showed a s ignifican t cor-
relation with P/F ratio. No correlation was demon-
strated between the total pleural effusion amount and
EVLW (r = 0.006, P = 0.97).
Reference ranges for normal lung weights and calculating
normal EVLW
p
values
According to Sawabe and colleagues [38], the normal
lung weight values for males and females are 878 ± 339
g (15.1 ± 5.8 g/kg of PBW) and 636 ± 240 g (15.5 ± 5.8
g/kg of PBW), respectively. Table 2 shows calculations
of normal EVLW
p
values. In our study, the normal
EVLW
p
values were determined to be 7.5 ± 3.3 mL/kg
for males and 7.3 ± 3.3 mL/kg for females.
Discussion
The main findings of this study are that (a) measure-
ment of EVLW using the PiCCO single transpulmonary
measurement s ystem is very closely correlated to post-
mortem lung weight measurement and (b) an EVLW
p
of
approximately 7.4 ± 3.3 mL/kg (males 7.5 ± 3.3; females
7.3 ± 3.3) is the reference value for normal lungs.
Validation and normal value of EVLW
Although a close agreement between EVLW values
from PiCCO and gravimetric lung water measurements
has bee n demonstrated in animal mod els with both
direct and indirect lu ng injury [13-15], there is no con-
clusive evidence for such agreement in humans. This is
the first published report to prove the close correlation
of those values in humans with a wide range of illnesses
and injured lungs. This correlation was also unaf fected
by sex, degree of LIS, pleural f luid amount, degree of
CI,degreeofCVP,degreeofPEEP,lengthoftime
before the autopsy started, cause of death, or perfor-
mance of CPR.
Ourlinearregressionequationforthecorrelation
between transpulmonary EVLW measurement and post-
mortem lung weight (equation 1) is similar to that of
Patroniti and colleagues [27] (equation 2), whose EVLW
measurements by the t hermal-indocyanine green dye
double-dilution method showed a good correlation with
quantitative computed tomography (CT) findings in 14
Table 2 Calculation of normal extravascular lung water for males and females
Male Female
EVLW = [0.56 × normal lung weight (in grams)] - 58 = [0.56 × 878] - 58
= 433.7
EVLW = [0.56 × normal lung weight (in grams)] - 58 = [0.56 × 636] - 58
= 298.2
Standard deviation: 189.8 Standard deviation: 134.4
Normal EVLW = 433.7 ± 189.8 mL Normal EVLW = 298.2 ± 134.4 mL
Normal EVLW
p
= 7.5 ± 3.3 mL/kg Normal EVLW
p
= 7.3 ± 3.3 mL/kg
EVLW, extravascular lung water; EVLW
p
, extravas cular lung water indexed to predicted body weight.
Tagami et al. Critical Care 2010, 14:R162
/>Page 5 of 8
mechanically ventilated patients with ARDS. Their equa-
tion was as follows:
EVLW double-indicator 59 lung weight CT 17 3 wher
()
=×
()
+[. ] .,0ee 7, 1rP=<000
(2)
We derived statistical values from both the results of
the present study and published literature. We calcu-
lated linear regression equation 1, which was authenti-
cated statistically with the normal lung weight reference
value being substituted in the formula. Data for refer-
ence values for normal lung were taken from the study
by Sawabe and colleagues [38], which was based on t he
findings from 1,615 autopsies.
Using this derivation method, we conclude that nor-
mal EVLW
p
values for males and females are 7.5 ± 3.3
and 7.3 ± 3.3 mL/kg, respectively. The mean EVLW
p
is
approximately 7.4 ± 3.3 mL/kg. These values can be
used to distinguish between healthy and pathological
lungs.
In our study, EVLW
p
was significantly higher in the
RF group (17.1 mL/kg), which consisted of patients with
ARDS or pneumonia, than in t he non-RF g roup (10.1
mL/kg), in which most patients had multiple organ fail-
ure. The definitive diagnosis was confirmed in autopsy
by a pathologist blinded to the study. These values were
much higher than the normal EVLW
p
value, 7.4 ± 3.3
mL/kg, especially in the RF group. Several clinical stu-
dies have shown increased EVLW
p
documented in
patients with ARDS diagnosed by clinical criteria
[21,29,33]. To our knowledge, this is the first report
showing increased EVLW
p
documented in patients with
ARDS or pneumonia confirmed by a pathologist.
EVLW and pleural effusion
Blomqvist and colleagues [42] found that pleural fluid
did not affect the reliability of the double-indicator dilu-
tion technique for measuring EVLW in dogs. Deeren
and colleagues [43] investigated the effect of thoracent-
esis on EVLW measurements in eight patients and
repo rted that the fluid in the pleural space did not con-
tribute t o the volume traversed by the thermal indicator
in single transpulmonary thermodilution measurements
in humans. Here, we proved a very close correlation
between premortem single transpulmonary thermodilu-
tion measurement of EVLW and postmortem lung
weight, regardless of the degree of pleural effusion (10
to 1,600 mL).
Limitations of the study
Despite the statistical significance of the results, the
small sample size of this study is its main limitation.
Since cardiopulmonary circulat ion is no t a steady- state
phenomenon, it is difficult to establish a precise correla-
tion between measurements made premortem and those
made postmortem. In addition, CPR was performed in
16 cases (53%) following the final EVLW measurement
and this may have affected the postmortem readings.
We consider this to be p otentially the most serious lim-
itation of our study. However, our data suggest that
CPR did not affect the lung weight found at autopsy or
the correction between EVLW and lung weight.
Pulmonary inflammation must be taken into consid-
eration, especially among patients with pneumonia.
Inflamed cells and purulent matter, including multiple
microabscesses, may increase lung weight with or with-
out increasing EVLW values. However, we found no evi-
dence among our study population to support this
concern.
EVLW gravimetry, the gold standard of lung water
measurement, is a very cumbersome process [44]. In
this study, only lung weight was measured. However,
measuring a postmortem lung weight is a well-estab-
lished routine technique that a pathologist performs
during an autopsy. Huge volumes of normal and abnor-
mal data of postmortem lung weight have been pub-
lished a nd are available. The linear r egression equation
for a correla tion was ca lculated in order to determine
the unknown value, EVLW
p
, from a well-known vari-
able, lung weight. Therefore, we believe that, to gain
normal EVLW values, the correlation between EVLW
and postmortem lung weight is more significant.
Indicator dilution techniques are also influenced by
vascular recruitment and the consequent distribution of
zones I and II in the lung because these techniques
inherently can detect only perfused lung regions. In
addition, it is generally believed that EVLW measured
using thermodilution underestimates the true EVLW in
the case of heterogeneous lung ventilation/perfusion dis-
tribution. We regret that our study design prevented us
from demonstrating these issues.
Conclusions
This human autopsy study has demonstrated that a defi-
nite correlation between EVLW measured by the PiCCO
system and lung weight in the clinical setting exists
independently of illness, sex, degree of lung injury,
pleural fluid amount, and degree of CO. We conclude
that the normal EVLW
p
valueinhumansis7.4±3.3
mL/kg.
Key messages
• A definite correlation between extravascular l ung
water, measured by the PiCCO system, and post-
mortem lung weight in humans exists.
• A normal human value of extravascular lung water
indexed by predictive body weight is 7.4 ± 3.3 mL/
kg.
Tagami et al. Critical Care 2010, 14:R162
/>Page 6 of 8
Abbreviations
ARDS: acute respiratory distress syndrome; CI: cardiac index; CO: cardiac
output; CPR: cardiopulmonary resuscitation; CT: computed tomography; CV:
coefficient of variation; CVP: central venous pressure; EVLW: extravascular
lung water; EVLW
A
: extravascular lung water indexed by actual body weight;
EVLW
P
: extravascular lung water indexed by predictive body weight; GEDV:
global end-diastolic volume; ICC: intraclass correlation coefficient; IQR:
interquartile range; ITBV: intrathoracic blood volume; ITTV: intrathoracic
thermal volume; LIS: lung injury score; PBW: predicted body weight; PEEP:
positive end-expiratory pressure; P/F RATIO: arterial partial pressure of
oxygen/fraction of inspired oxygen ratio; PTV: pulmonary thermal volume;
RF: respiratory cause of death; SD: standard deviation.
Acknowledgements
We acknowledge the patients whose bodies were donated for autopsy and
their families. We thank Azriel Perel and Charles R Phillips for reviewing this
article and providing thoughtful feedback and Yoshihiro Imazu, Yoshifumi
Miyazaki, Kohei Yonezawa, Mariko Omura, and Go Akiyama for their
assistance.
Author details
1
Department of Emergency and Critical Care Medicine, Aidu Chuo Hospital,
1-1 Tsuruga, Aiduwakamatsu, Fukushima, 965-8611, Japan.
2
Department of
Emergency and Critical Care Medicine, Nippon Medical School, 1-1-5
Sendagi, Bunkyo-ku, Tokyo, 113-8613, Japan.
3
Tokyo Rinkai Hospital, 1-4-2
Rinkaicho, Edogawa-ku, Tokyo, 134-0086, Japan.
4
Department of Emergency
and Critical Care Medicine, Yamanashi Central Hospital, 1-1-1 Fujimi, Kofu,
Yamanashi, 400-8506, Japan.
5
Department of Surgery, Saiseikai Chuo
Hospital, 1-4-17 Mita, Minato-ku, Tokyo, 108-0073, Japan.
6
Department of
Pathology, Aidu Chuo Hospital, 1-1 Tsuruga, Aiduwakamatsu, Fukushima,
965-8611, Japan.
Authors’ contributions
TT conceived of the study, participated in the design of study, performed
the statistical analysis, and helped to draft the manuscript. SK, RT, and TK
participated in the study design and helped to draft the manuscript. YY, KM,
RO, HH, and HY participated in the study design and provided coordination.
TA and TM participated in the design of study. All authors read and
approved the final manuscript.
Competing interests
YY is a membe r of the Pulsion Medical Systems medical advisory board. The
other authors declare that they have no competing interests. There was no
financial support for this study.
Received: 16 March 2010 Revised: 10 June 2010
Accepted: 6 September 2010 Published: 6 September 2010
References
1. Onwuanyi A, Taylor M: Acute decompensated heart failure:
pathophysiology and treatment. Am J Cardiol 2007, 99:25D-30D.
2. Atabai K, Matthay MA: The pulmonary physician in critical care. 5: Acute
lung injury and the acute respiratory distress syndrome: definitions and
epidemiology. Thorax 2002, 57:452-458.
3. Ware LB, Matthay MA: Clinical practice. Acute pulmonary edema. N Engl J
Med 2005, 353:2788-2796.
4. Rubenfeld GD, Caldwell E, Granton J, Hudson LD, Matthay MA:
Interobserver variability in applying a radiographic definition for ARDS.
Chest 1999, 116:1347-1353.
5. Meade MO, Cook RJ, Guyatt GH, Groll R, Kachura JR, Bedard M, Cook DJ,
Slutsky AS, Stewart TE: Interobserver variation in interpreting chest
radiographs for the diagnosis of acute respiratory distress syndrome. Am
J Respir Crit Care Med 2000, 161:85-90.
6. Halperin BD, Feeley TW, Mihm FG, Chiles C, Guthaner DF, Blank NE:
Evaluation of the portable chest roentgenogram for quantitating
extravascular lung water in critically ill adults. Chest 1985, 88:649-652.
7. Lindqvist B: Experimental uraemic pulmonary oedema including: criteria
for pulmonary oedema in anuric rabbits, the role of uramia and
overhydration, and a literary survey on the problems of uraemic
pulmonary oedema (fluid-retention lung, etc.). Acta Med Scand 1964,
176(SUPPL 418):1.
8. Haddy FJ, Stephens G, Visscher MB: The physiology and pharmacology of
lung edema. Pharmacol Rev 1956, 8:389-434.
9. Mihm FG, Feeley TW, Rosenthal MH, Lewis F: Measurement of
extravascular lung water in dogs using the thermal-green dye indicator
dilution method. Anesthesiology 1982, 57:116-122.
10. Mihm FG, Feeley TW, Jamieson SW: Thermal dye double indicator dilution
measurement of lung water in man: comparison with gravimetric
measurements. Thorax 1987, 42:72-76.
11. Sakka SG, Ruhl CC, Pfeiffer UJ, Beale R, McLuckie A, Reinhart K, Meier-
Hellmann A: Assessment of cardiac preload and extravascular lung water
by single transpulmonary thermodilution. Intensive Care Med 2000,
26:180-187.
12. Neumann P: Extravascular lung water and intrathoracic blood volume:
double versus single indicator dilution technique. Intensive Care Med
1999, 25:216-219.
13. Kirov MY, Kuzkov VV, Kuklin VN, Waerhaug K, Bjertnaes LJ: Extravascular
lung water assessed by transpulmonary single thermodilution and
postmortem gravimetry in sheep. Crit Care 2004, 8:R451-458.
14. Katzenelson R, Perel A, Berkenstadt H, Preisman S, Kogan S, Sternik L,
Segal E: Accuracy of transpulmonary thermodilution versus gravimetric
measurement of extravascular lung water. Crit Care Med 2004,
32:1550-1554.
15. Fernández-Mondéjar E, Castaño-Pérez J, Rivera-Fernández R, Colmenero-
Ruiz M, Manzano F, Pérez-Villares J, de la Chica R: Quantification of lung
water by transpulmonary thermodilution in normal and edematous
lung. J Crit Care 2003, 18:253-258.
16. Horn PS, Pesce AJ: Reference intervals: an update. Clin Chim Acta 2003,
334:5-23.
17. Sibbald WJ, Warshawski FJ, Short AK, Harris J, Lefcoe MS, Holliday RL:
Clinical studies of measuring extravascular lung water by the thermal
dye technique in critically ill patients. Chest 1983, 83 :725-731.
18. Baudendistel LJ, Kaminski DL, Dahms TE: Evaluation of extravascular lung
water by single thermal indicator. Crit Care Med 1986, 14:52-56.
19. Bongard FS, Matthay M, Mackersie RC, Lewis FR: Morphologic and
physiologic correlates of increased extravascular lung water. Surgery
1984, 96:395-403.
20. Michard F, Schachtrupp A, Toens C: Factors influencing the estimation of
extravascular lung water by transpulmonary thermodilution in critically
ill patients. Crit Care Med 2005, 33:1243-1247.
21. Craig TR, Duffy MJ, Shyamsundar M, McDowell C, McLaughlin B, Elborn JS,
McAuley DF: Extravascular lung water indexed to predicted body weight
is a novel predictor of intensive care unit mortality in patients with
acute lung injury. Crit Care Med 38:114-120.
22. Szakmany T, Heigl P, Molnar Z: Correlation between extravascular lung
water and oxygenation in ALI/ARDS patients in septic shock: possible
role in the development of atelectasis? Anaesth Intensive Care 2004,
32:196-201.
23. Schuster DP: Identifying patients with ARDS: time for a different
approach. Intensive Care Med 1997, 23:1197-1203.
24. Mitchell JP, Schuller D, Calandrino FS, Schuster DP: Improved outcome
based on fluid management in critically ill patients requiring pulmonary
artery catheterization. Am Rev Respir Dis 1992, 145:990-998.
25. Kuzkov VV, Kirov MY, Sovershaev MA, Kuklin VN, Suborov EV, Waerhaug K,
Bjertnaes LJ: Extravascular lung water determined with single
transpulmonary thermodilution correlates with the severity of sepsis-
induced acute lung injury. Crit Care Med 2006, 34:1647-1653.
26. Groeneveld AB, Verheij J: Extravascular lung water to blood volume ratios
as measures of permeability in sepsis-induced ALI/ARDS. Intensive Care
Med 2006, 32:1315-1321.
27. Patroniti N, Bellani G, Maggioni E, Manfio A, Marcora B, Pesenti A:
Measurement of pulmonary edema in patients with acute respiratory
distress syndrome. Crit Care Med 2005, 33:2547-2554.
28. Martin GS, Eaton S, Mealer M, Moss M: Extravascular lung water in
patients with severe sepsis: a prospective cohort study. Crit Care 2005, 9
:
R74-82.
29. Berkowitz DM, Danai PA, Eaton S, Moss M, Martin GS: Accurate
characterization of extravascular lung water in acute respiratory distress
syndrome. Crit Care Med 2008, 36:1803-1809.
30. Newman EV, Merrell M, Genecin A, Monge C, Milnor WR, McKeever WP: The
dye dilution method for describing the central circulation. An analysis of
Tagami et al. Critical Care 2010, 14:R162
/>Page 7 of 8
factors shaping the time-concentration curves. Circulation 1951,
4:735-746.
31. Monnet X, Anguel N, Osman D, Hamzaoui O, Richard C, Teboul JL:
Assessing pulmonary permeability by transpulmonary thermodilution
allows differentiation of hydrostatic pulmonary edema from ALI/ARDS.
Intensive Care Med 2007, 33:448-453.
32. Ventilation with lower tidal volumes as compared with traditional tidal
volumes for acute lung injury and the acute respiratory distress
syndrome. The Acute Respiratory Distress Syndrome Network. N Engl J
Med 2000, 342:1301-1308.
33. Phillips CR, Chesnutt MS, Smith SM: Extravascular lung water in sepsis-
associated acute respiratory distress syndrome: indexing with predicted
body weight improves correlation with severity of illness and survival.
Crit Care Med 2008, 36:69-73.
34. Zhu BL, Ishikawa T, Quan L, Oritani S, Li DR, Zhao D, Michiue T, Tsuda K,
Kamikodai Y, Okazaki S, Maeda H: Possible factors contributing to the
postmortem lung weight in fire fatalities. Leg Med (Tokyo) 2005, 7:139-143.
35. Shine B: Use of routine clinical laboratory data to define reference
intervals. Ann Clin Biochem 2008, 45:467-475.
36. de la Grandmaison GL, Clairand I, Durigon M: Organ weight in 684 adult
autopsies: new tables for a Caucasoid population. Forensic Sci Int 2001,
119:149-154.
37. Inoue T, Otsu S: Statistical analysis of the organ weights in 1,000 autopsy
cases of Japanese aged over 60 years. Acta Pathol Jpn 1987, 37:343-359.
38. Sawabe M, Saito M, Naka M, Kasahara I, Saito Y, Arai T, Hamamatsu A,
Shirasawa T: Standard organ weights among elderly Japanese who died
in hospital, including 50 centenarians. Pathol Int 2006, 56:315-323.
39. Tanaka G, Nakahara Y, Nakazima Y: [Japanese reference man 1988-IV.
Studies on the weight and size of internal organs of Normal Japanese].
Nippon Igaku Hoshasen Gakkai Zasshi 1989, 49:344-364.
40. Shrout PE, Fleiss JL: Intraclass correlations: uses in assessing rater
reliability. Psychol Bull 1979, 86:420-428.
41. Muller R, Buttner P: A critical discussion of intraclass correlation
coefficients. Stat Med 1994, 13:2465-2476.
42. Blomqvist H, Wickerts CJ, Rosblad PG: Effects of pleural fluid and positive
end-expiratory pressure on the measurement of extravascular lung
water by the double-indicator dilution technique. Acta Anaesthesiol Scand
1991, 35:578-583.
43. Deeren D, Dits H, Daelemans R, Malbrain ML: Effect of pleural fluid on the
measurement of extravascular lung water by single transpulmonary
thermodilution. Clinical Intensive Care 2004, 15:119-122.
44. Pearce ML, Yamashita J, Beazell J: Measurement of pulmonary edema. Circ
Res
1965, 16:482-488.
doi:10.1186/cc9250
Cite this article as: Tagami et al.: Validation of extravascular lung water
measurement by single transpulmonary thermodilution: human autopsy
study. Critical Care 2010 14:R162.
Submit your next manuscript to BioMed Central
and take full advantage of:
• Convenient online submission
• Thorough peer review
• No space constraints or color figure charges
• Immediate publication on acceptance
• Inclusion in PubMed, CAS, Scopus and Google Scholar
• Research which is freely available for redistribution
Submit your manuscript at
www.biomedcentral.com/submit
Tagami et al. Critical Care 2010, 14:R162
/>Page 8 of 8