Báo cáo y học: "Central venous O2 saturation and venous-toarterial CO2 difference as complementary tools for goal-directed therapy during high-risk surge" ppsx
Bạn đang xem bản rút gọn của tài liệu. Xem và tải ngay bản đầy đủ của tài liệu tại đây (511.17 KB, 11 trang )
RESEARC H Open Access
Central venous O
2
saturation and venous-to-
arterial CO
2
difference as complementary tools
for goal-directed therapy during high-risk surgery
Emmanuel Futier
1*
, Emmanuel Robin
2
, Matthieu Jabaudon
1
, Renaud Guerin
1
, Antoine Petit
1
, Jean-Etienne Bazin
1
,
Jean-Michel Constantin
1
, Benoit Vallet
2
Abstract
Introduction: Central venous oxygen saturation (ScvO
2
) is a useful therapeutic target in septic shock and high-risk
surgery. We tested the hypothesis that central venous-to-arterial carbon dioxide difference (P(cv-a)CO
2
), a global
index of tissue perfusion, could be used as a complementary tool to ScvO
2
for goal-directed fluid therapy (GDT) to
identify persistent low flow after optimi zation of preload has been achieved by fluid loading during high-risk
surgery.
Methods: This is a secondary analysis of results obtained in a study involving 70 adult patients (ASA I to III),
undergoing major abdominal surgery, and treated with an individualized goal-directed fluid replacement therapy.
All patients were managed to maintain a respiratory variation in peak aortic flow velocity below 13%. Cardiac index
(CI), oxygen delivery index (DO
2
i), ScvO
2
, P(cv-a)CO
2
and postoperative complications were recorded blindly for all
patients.
Results: A total of 34% of patients developed postoperative complications. At baseline, there was no difference in
demographic or haemodynamic variables between patients who developed complications and those who did not.
In patients with complications, during surgery, both mean ScvO
2
(78 ± 4 versus 81 ± 4%, P = 0.017) and minimal
ScvO
2
(minScvO
2
) (67 ± 6 versus 72 ± 6%, P = 0.0017) were lower than in patients without complications, despite
perfusion of similar volumes of fluids and comparable CI and DO
2
i values. The optimal ScvO
2
cut-off value was
70.6% and minScvO
2
< 70% was independently associated with the development of postoperative complications
(OR = 4.2 (95% CI: 1.1 to 14.4), P = 0.025). P(cv-a)CO
2
was larger in patients with complications (7.8 ± 2 versus 5.6 ±
2 mmHg, P <10
-6
). In patients with complications and ScvO
2
≥71%, P(cv-a)CO
2
was also significantly larg er (7.7 ± 2
versus 5.5 ± 2 mmHg, P <10
-6
) than in patients witho ut complications. The area under the receiver operating
characteristic (ROC) curve was 0.785 (95% CI: 0.74 to 0.83) for discrimination of patients with ScvO
2
≥71% who did
and did not develop complications, with 5 mmHg as the most predictive threshold value.
Conclusions: ScvO
2
reflects important changes in O
2
delivery in relation to O
2
needs du ring the perioperative
period. A P(cv-a)CO
2
< 5 mmHg might serve as a complementary target to ScvO
2
during GDT to identify persistent
inadequacy of the circulatory response in face of metabolic requirements when an ScvO
2
≥71% is achieved.
Trial registration: Clinic altrials.gov Identifier: NCT00852449.
* Correspondence:
1
Department of Anaesthesiology and Critical Care Medicine, Estaing Hospital,
University Hospital of Clermont-Ferrand, 1 Place Lucie Aubrac, Clermont-
Ferrand, 63000, France
Full list of author information is available at the end of the article
Futier et al. Critical Care 2010, 14:R193
/>© 2010 Futier et al ; licensee BioMed Central Ltd. This is an op en access article distributed under the terms of the Creative Commons
Attribution License ( .0), which permits unrestricted use, distribution, and reproduction in
any medium, provided the original work is properly cited.
Introduction
Adequate tissue perfus ion is an essential component of
oxygenation during high-risk surgery and may improve
outcome [1,2]. Careful monitoring of fluid administra-
tion by individualized goal-directed therapy (GDT) has
been shown to reduce organ failure and hospita l stay
[3-5]. As a supplement to routine cardiovascular moni-
toring, GDT aims to optimize O
2
delivery (DO
2
)
through defined goals, based on maximization of flow-
related haemodynamic parameters [6-10], while avoiding
hypovolaemia and fluid overload which may alter tissue
oxygenation [11,12].
In add ition, the use of early warning signals of tissue
hypoxia, such as central venous oxygen saturation
(ScvO
2
), which reflects important changes in the O
2
delivery/consumption (DO
2
/VO
2
) relationship, has been
found to be useful during high-risk surgery [13-15].
Indeed, previous studies have shown tha t changes in
ScvO
2
closely reflect circulatory disturbances during
periods of tissue hypoxia [16], and that low ScvO
2
is
associated with increased postoperative complications
[13-15]. Furthermore, by closely monitoring of tissue O
2
extraction, calculated from ScvO
2
, early correction of
altered tissue oxygenation with appropriate fluid loading
in conjunction with low doses of inotropes was found to
reduce postoperative organ failure in patients with poor
O
2
utilization [13].
In a recent randomized study of patients treated with
an individualized GDT protocol [17], we found that,
despite optimization of preload wit h repeated fluid load-
ing, excessive fluid restriction in creased postoperative
complications in parallel with reduced ScvO
2
values
[17]. The ScvO
2
thres hold value fo r predict ing complica-
tions (approximately 71%) was similar to those reported
previously [14,15]. Significant ScvO
2
fluctuations may
occur during both surgery and sepsis, and high ScvO
2
values do not necessarily reflect changes in DO
2
and
macrocirculatory adequacy [18,19], which may therefor e
limit the clinical relevance of ScvO
2
in routine practice.
Persistent tissue hypoperfusion with increased ScvO
2
and O
2
extraction defects might be related to microcir-
culatory and/or mitochondrial failure [19,20].
Interestingly, central venous-to-arterial PCO
2
(Pcv-
aCO
2
), with central venous PCO
2
as a surrogate for
mixed venous PCO
2
[21], has recently been proposed
as a useful tool for GDT in ICU-septic patients to
identify persistent hypoperfusion when a ScvO
2
>70%
has been rea ched [20]. Decreased tissue bl ood flow
(ischemic hypoxia) represents the major determinant
in increased P(v-a)CO
2
[22], and P(v-a)CO
2
could
therefore be considered as an indicator of adequate
venous blood flow to remove CO
2
produced by periph-
eral tissues [23,24].
The results of a previous study, which included
patients treated with intraoperative GDT [17], were
used to investigate whether P(cv-a)CO
2
is useful for dis-
criminating patients at risk of developing postoperative
complications. It was hypothesized that P(cv-a)CO
2
may
be a useful complementary tool when a threshold ScvO
2
value has been reac hed by individualized GDT during
major abdominal surgery.
Materials and methods
Patients
The study that provided data [17] used here was
approved by our Institutional Review Board, and all
patients provided written informed consent. Data were
collectedfromeligiblepatientswithanASAscoreofI
to III scheduled for surgery with an expected duration
of > 60 minutes. Surgic al procedures included colon/
rectum rese ctions, gastric resections, duodenopancrea-
tectomy and hepatectomy. Exclusion criteria included:
age < 18 years, body mass index > 35 kg m
-2
, pregnancy,
chronic obstructive pulmonary disease with forced
expiratory volume in 1 s ec < 50%, emergency surgery,
coagulopathy, sepsis or systemic inflammatory response
syndrome [25], significant hepatic (prothrombin ratio
<50%, factor V < 50%) or renal failure (creatinine >50%
upper limit of normal value), and those in whom
epidural analgesia was contraindicated.
Study protocol
The protocol and design of the original study have been
descri bed in detail elsewhere [17]. Briefly, patients were
randomly assigned by a concealed allocation approach
(computer-generated codes), using opaque sealed envel-
opes containing the randomization schedule, to 6 mL
kg
-1
h
-1
(restricted-GDT group) or 12 mL kg
-1
h
-1
(con-
ventional-GDT group) of crystalloids (lactated Ringer’s
solution), reflecting current clinical practice for
restricted (R-GDT group) and more conventional
(C-GDT group) fluid administration [26]. Study investi-
gators, but not anaesthesiologists, were blinded to tr eat-
ment assignments. Immediately after induction o f
anaesthesia, an oesophageal Doppler probe (HemoSonic
100, Arrow International, E verett, MA, USA) was
inserted and adjusted to obtain the highest velocity sig-
nal from the descending aorta. Respiratory variations in
peak aortic flow velocity (deltaPV) were monitored as
described previously [27,28], and stroke volume and car-
diac output were recorded continuously. Additional
fluid boluses of 250 mL hydroxethylstarch (HES 130/0.4,
Voluven®; Fresenius-Kabi, Bad Hamburg, Germany) were
given in order to main tain deltaPV below 13% [28]. The
fluid c hallenge was repeated (up to 50 mL kg
-1
), if
necessary, until deltaPV w as corrected. In other cases
Futier et al. Critical Care 2010, 14:R193
/>Page 2 of 11
(deltaPV < 13% and evidence of haemodynamic instabil-
ity), a vasoactive/inotropic support (ephedrine chlorhy-
drate or dobutamine) could be added. Blood was
transfused in order to maintain haemoglobin > 8 g dL
-1
in al l patients, or > 10 g dL
-1
in patients with a history
of coronary artery disease. Perioperative management
was similar in all patients except for the basal rate of
intraoperative crystalloids.
Data collection and outcome measures
Preoperatively, patients were equipped with central
venous (positioned with the tip within the superior vena
cava) and arterial catheters. Arterial and central venous
blood gas analyses were performed by intermittent
blood sampling and co-oximetry (IL Synthesis, Instru-
mentation Laboratory®, Lexington, MA, USA) 10 min-
utes before surgery (baseline), hourly throughout
surgery and until discharge from the post-acute care
unit (PACU). This equipment was calibrated each hour,
and routine quality control checks were performed.
Anaesthesiologists were blinded to ScvO
2
and Pcv-aCO
2
measurements during the course of surgery, which were,
therefore, not used to guide clinical management at any
stage of the study.
During surgery, the following parameters were
recorded: electrocardiogram, pulse oximetry, invasive
arterial pressure, cardiac output, oxygen delivery index
(DO
2
i), the infused volume of crystalloids, HES, the
need for packed red blood cells (PRB Cs) and vasoactive/
inotrope support, and urine output. Serum lactate, hae-
moglobin, creatinine, C-reactive protein (CRP ), procalci-
tonin (PCT) and albumin levels were measured at
PACU admission and during the 48 h following surgery.
Minimal ScvO
2
(minScvO
2
) was considered as the low-
est value during the course of surgery.
Postoperative complications were recorded systemati-
cally and assessed according to previously defined cri-
teria [6,29,30]. For the purpose of this study, and to
ass ess the effect of abnormal perfusi on on tissue oxyge-
nation, we focused specifically on postoperative septic
complications, which seem the most relevant clinically
in the context of digestive surgery. Diagnosis of post-
operative sepsis was based on international consensus
guidelines [25]. Infection consisted of postoperative
intraabdominal abscesses, wound infections, pneumonia
and urinary tract infections. Cardiovascular (congestive
heart failure, pulmonary embolism), postop erative hae-
morrhage and reintervention, neurological (confusion),
renal failure and respiratory complications (pneu-
mothorax and pulmonary embolism) complications were
not included in the data analysis, except if associated
with sepsis. The definition of the complications has
been described in detail elsewhe re [17]. Pre- and post-
operative data, and post-operative complications were
recorded by non-research staff blinded to the patient’s
allocation group. These were verified, in accordance
with predefined criteria, by a member of the research
team unaware of study group allocation. This process
involved inspection of radiological investigatio ns, labora-
tory data and clinical assessment.
Statistical analysis
Data in tables are presented as means ± standard devia-
tion (SD) when normally distributed, as medians (inter-
quartile range) when not normally distributed, or as a
percentage of the group from which they were derived
for categorical data. The c hi
2
test was used to compare
qualitative data. Qualitative and quantitative data were
compared using the Student’s t-test or analysis of var-
iance (ANOVA) when normally distributed (and variance
were equivalent), or the Mann-Whitney U-test or Krus-
kal-Wallis H test in other circumstances. A multivariate
analysis of variance (MANOVA) was used to explore
longitudinal data. Multiple logistic regression was
employed to identify independent risk factors for post-
operative complications. The results of logistic regression
are reported as adjust ed odds ratios with 95% confidence
intervals (CI). The robustness o f the model was assessed
using a Hosmer-Lemeshow Goodness-of-Fit-Test [31].
Receiver operator characteristic (ROC) curves were con-
structed to identify optimal cut-off values for outcome
associations. The optimal cut-off was defined as the value
associated with the highest sum of sensitivity and specifi-
city (Youden’s index). Analysis was performed using SEM
software [32] and significance was set at P < 0.05.
Results
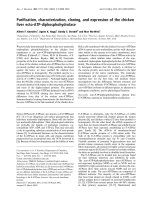
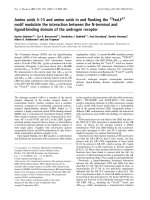
Complete follow-up data were collected from 70 patients
included in the original study between May and Decem-
ber 2008 (Figure 1). Thirty patients develo ped post-
operative complications (58% of the R-GDT group and
26% of the C-GDT group, P < 0.01), including 24 who
developed at l east one o f the fol lowing: postoperative
sepsis (n = 21), intra-abdominal abscess (n = 16), pneu-
monia (n = 7) and urinary tract infection (n =4).There
were six (8%) who had postoperative acute lung injuries
or acute respiratory distress syndrome but no ne of them
was associated with sepsis, and was, therefore, not
included in the data analysis. There was no abdominal
syndrome. There were two deaths (one in each group,
P = 0.50). ScvO
2
and P(cv-a) CO
2
data were available for
all patients. The demographics and commonly measured
biological variables for the study participants are shown
in Table 1. Surgical procedures consisted of colon/rec-
tum resections (43%), duo denopancreatectomy (20%),
gastrectomy (21%) and hepatectomy (16%), and were
equally distributed (P = 0.87). There were no differ ences
in operative time and blood loss between the two
Futier et al. Critical Care 2010, 14:R193
/>Page 3 of 11
groups : 248 ± 42 vs. 233 ± 62 min (P = 0.21) and 326 ±
215 vs. 357 ± 373 ml (P = 0.68), respectively, in patients
with and without complications. All patients were extu-
bated within two hours after surgery.
The amounts and types of fluid infused intrao peratively
are listed in Table 2. There was no difference in the total
volume of fluid infused between groups (P =0.44),
although less crystalloids were administered in patients
with complications (P < 0.01). Additional fluid boluses
were also significant ly higher in these patients (P <0.01).
There was no difference in blood transfusion and in the
number of patient s who required ephedrin e chlorhydrate
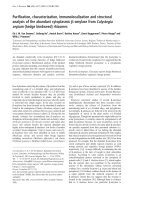
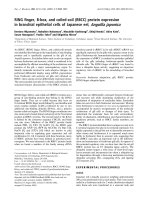
and dobutamine (Table 2). There were no relevant differ-
ences in the principal haem odynamic (Figure 2) and bio-
logical variables in patients wi th and without
complications, except for haemoglobin concentration
(11.5 ± 1.3 vs. 12.2 ± 1.1 g dL
-1
, P =0.04attheendof
surgery) and excess bases (Table 3). There was also no
relevant difference regarding serum lactate concentra-
tion: (3.1 ± 2.5 vs. 2.3 ± 1.4 mmol L
-1
, P =0.16and1.7±
0.8 vs. 1.6 ± 0.6 mmol L
-1
, P = 0. 59 at PACU admission
and at postoperative Day 1, respectively) nor in serum
crea tinine between patient s who did and did not develop
postoperative complications.
Association with outcome
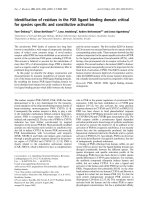
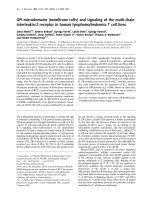
At baseline there was no difference in ScvO
2
values
between patients who did and did not develop postopera-
tive complications (82 ± 10 vs. 81 ± 9%, respectivel y, P =
0.75) (Figure 3a). Compared with uncomplicated patients,
mean ScvO
2
(78±4vs.81±4%,P = 0.017) and min-
ScvO
2
(67 ± 6 vs. 72 ± 6%, P = 0.0017) were both lower
in patients with complications. Univariate analysis identi-
fied four variables associated with postoperative compli-
cations: minScvO
2
(P = 0.0028), treatment group
(C-GDT and R-GDT, P = 0.0067), BMI (P =0.017)and
the need for addition al fluid bolus (P = 0.035). Multivari-
ate analysis showed that the need for additional fluid
bolus (OR = 1.46 (95% CI: 1.12 to 2), P = 0.005) and min-
ScvO
2
< 70% (OR = 4.0 (95% CI: 1.23 to 12.5}, P = 0.019)
were independently associated with postoperative com-
plications. The area under the ROC curve for ScvO
2
was
0.736 (95 CI%: 0.61 to 0.86) according to the occurrence
of postoperative complications. The optimal ScvO
2
value
was 70.6% (sensitivi ty 72.9%, specificity 71.4%) for discri-
mination of patients who did and did not develop com-
plications. Intraoperative characteristics of patients with
mean ScvO
2
> 71% who did and did not develop post-
operative complications are listed in Table 4.
Excluded (n=10)
Refused to Participate (n=6)
Not Meeting Inclusion criteria (n=4)
(Expected duration <1h)
Patients assessed for eligibility (n =80)
70 Randomized
36 Randomized to restrictive fluid-GDT group
36 Received Intervention as randomized
34 Randomized to conservative fluid-GDT group
34 Received Intervention as randomized
Included in the primary analysis (n=36) Included in the primary analysis (n=34)
Lost to follow-up (n=0)
Lost to follow-up (n=0)
Figure 1 Flow diagram of the original study.
Futier et al. Critical Care 2010, 14:R193
/>Page 4 of 11
Trends in P(cv-a)CO
2
At baseline there was no difference in P(cv-a)CO
2
values
between patients with and without complications (P =
0.22) (Figure 3b). Mean P(cv-a)CO
2
was larger in
patients who developed complications than in those
whodidnot(7.8±2vs.5.6±2mmHg,P <10
-6
). The
areaundertheROCcurveforP(cv-a)CO
2
was 0.751
(95% CI: 0.71 to 0.79). The best cut-off P(cv-a)CO
2
value was 6 mmHg (sensitivity 79%, spec ificity 66%,
positive predictive value 56%, negative pre dictive value
85%) for discrimination of patients who did and did not
develop complications. When we considered P(cv-a)CO
2
with overall c omplications (not only those associated
with sepsis) in all of the 30 patients, the difference
between patients who did and did not develop complica-
tions still remained significant. We constructed the ROC
Table 1 Demographic and biological data at inclusion for patients with and without postoperative complications
Patients with complications (n = 24) Patients without complications ( n = 46) P
Demographic
Age (years) 60 ± 13 62 ± 13 0.61
Sex M/F (%) 62/38 52/48 0.41
BMI (kg m
-2
) 28 ± 7 25 ± 3 0.06
P-POSSUM score 35 ± 6.6 33 ± 5.6 0.21
ASA score I/II/III 12/63/25 11/72/17 0.71
Hypertension (%) 54 50 0.74
Cardiac failure (%) 8 9 0.95
Ischemic heart disease (%) 8 13 0.55
Diabetes mellitus (%) 17 15 0.87
COPD (%) 17 13 0.68
Neoplasia (%) 91 85 0.41
Biological data
Haemoglobin (g L
-1
) 12 ± 2 13 ± 2 0.12
Haematocrit (%) 37 ± 5 39 ± 4 0.14
Albumin (g L
-1
) 36 ± 4 35 ± 4 0.76
Prealbumin (g L
-1
) 0.25 ± 0.07 0.24 ± 0.06 0.48
Creatinine (μmol L
-1
) 82 ± 31 78 ± 23 0.52
Procalcitonin (mg L
-1
) 0.07 ± 0.04 0.08 ± 0.11 0.76
CRP (mg L
-1
) 6 ± 7 7 ± 16 0.74
Lactate (mmol L
-1
) 1.4 ± 0.6 1.3 ± 0.5 0.48
Data are presented as means ± SD, or absolute values (%).
Abbreviations: ASA, American Society of Anaesthesiology physical status; BMI, bod y mass index; COPD, chronic obstructive pulmonary disease; CRP, C-reactive
protein; P-POSSUM, Portsmouth Physiological and Operative Severity Score for the Enumeration of Mortality and Morbidity.
Table 2 Intraoperative fluid management in patients with and without postoperative complications
Patients with complications (n = 24) Patients without complications ( n = 46) P
Total volume of fluid infused (mL) 4,725 (3,600 to 5,300) 4,525 (3,850 to 6,000) 0.44
Total volume of crystalloids infused (mL) 3,255 (2,760 to 4,300) 4,100 (2,760 to 5,660) 0.04
Total volume of colloids infused (mL) 750 (680 to 1,250) 250 (60 to 500) < 0.01
Fluid challenge
No. of challenge per patient 4 ± 2 2 ± 2 < 0.01
No. (%) of patients who needed 21 (87) 34 (74) 0.19
Blood transfusion, N (%) of patients 6 (25%) 7 (15%) 0.31
Urine output (mL)
Intraoperative 600 (390 to 800) 500 (300 to 975) 0.46
Day 1 1,350 (800 to 1,950) 2,000 (1,350 to 3,100) 0.001
Day 2 2,000 (1,150 to 2,500) 2,450 (1,525 to 3,000) 0.45
Vasoactive support
Ephedrine chlorhydrate, N (%) of patients 20 (83%) 43 (93%) 0.18
Dobutamine, N (%) of patients 0 1 NR
Data are presented as means ± SD, medians (interquartile range) or absolute values (%). NR, not related.
Futier et al. Critical Care 2010, 14:R193
/>Page 5 of 11
curve and found that a P(cv-a)CO
2
of 6 mmHg pre-
dicted the occurrence of c omplications with 75% sensi-
tivity, 50% specificity, predictive positive value of 0.13
and predictive negative value of 0.95 (AUC 0.648, 95%
CI 0.58 to 0.72).
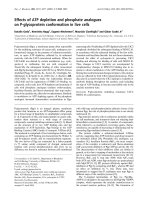
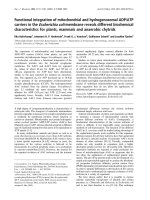
In patients with ScvO
2
≥71%, mean P(cv-a)CO
2
was lar-
ger in patients who developed postoperative complica-
tionsthaninpatientswithScvO
2
≥71% who did not (7.7
±2vs. 5 ± 2 mmHg, respectively, P <10
-6
). The area
under the ROC curve for P(cv-a)CO
2
was 0.785 (95% CI:
0.74 to 0.83) with 5 mmHg as the best threshold value
(sensitivity 96%, specificity 54%, positive predictive value
41%, negative predictive value 98%) for discrimination of
patients with ScvO
2
≥71% who did and did not develop
postoperative complications (Figure 4).
Discussion
Recently published data clearly demonstrate that low
ScvO
2
during major abdominal surgery is associated
with an increased risk of postoperative complications
[13-15]. In this study, using Doppler-deriv ed deltaPV as
a goal-directed approach, it was observed that high
ScvO
2
(≥71%) did not necessarily preclude postoperative
complications. In this context, the presence of a P(cv-a)
CO
2
value > 5 mmHg may be a useful complementary
tool to identify patients with ScvO
2
≥71% who m ight
remain insufficiently optimized haemodynamically.
There is growing evidence that individualized fluid load-
ing through goal-directed protocols, titrated by dynamic
indices of either flow or preload, improves patient out-
come, and is superior to the assessment of standard hae-
modynamic parameters such as mean arterial pressure
(MAP), heart rate or central venous pressure, to prevent
inadequate or excessive fluid administration [4,9,33,34].
Although the underlying mechanisms remain controver-
sial, most goal-directed therapy (GDT) protocols include
fluid loading, a lone or combined with inotropes, to pre-
vent O
2
debt by maintaining tissue perfusion [3]. In o ur
recently published randomized study of patients treated
with an individualized oesophageal Doppler-guided fluid
2,0
2,2
2,4
2,6
2,8
3,0
3,2
3,4
Baseline T 1H T 2H T 3H End
Cardiac index
(l min
-1
m
-2
)
300
350
400
450
500
550
600
Baseline T 1H T 2H T 3H End
Patients with complications (n=24)
Patients without complications (n=46)
DO2i
(ml min
-1
m
-2
)
60
65
70
75
80
85
90
Baseline T 1H T 2H T 3H End
MAP
(mmHg)
60
65
70
75
80
85
90
Baseline T 1H T 2H T 3H End
Stroke volume
(ml)
Figure 2 Cardiac index, oxygen delivery index (DO
2
i), stroke volume and mean arterial pressure (MAP) in patients who did (n = 24)
and did not (n = 46) develop postoperative complications. There was no difference in any variable between groups at any time point. Data
are expressed as means ± 95% CI.
Futier et al. Critical Care 2010, 14:R193
/>Page 6 of 11
substitution protocol, we found that crystalloid restriction
(6 vs.12mLkg
-1
h
-1
) was associated with increased post-
operative complications [17]. Interestingly, the results also
indicated that individualized optimization of preload by
colloid loading might not have been sufficient to promote
optimal tissue perfusion and oxyg enation, as indicated by
reduced ScvO
2
values (69 ± 6 vs. 72 ± 6 mmHg, P = 0.04)
in the restricted-GDT group of patients [17].
Although the prognostic significance of reduced
ScvO
2
and the benefit of its normalization in early goal-
directed protocols have been proposed [13,19,35], both
normal and high ScvO
2
values do not preclude micro-
circulatory failure [19]. In this context, in patients trea-
ted with an e arly GDT-based sepsis resuscitation
protocol, Jones and colleagues [36] and Vallee and col-
leagues [20] showed that either lactate clearance or
P(cv-a)CO
2
might be useful to identify persistent tissue
hypoperfusion when the ScvO
2
goal has been reached
with a pparent normal DO
2
/VO
2
ratio. It was also
observed that, in surgical patients, an individualized pre-
load-targe ted fluid loadin g to maintain tissue perfusion
was not sufficient to prevent significant differences in
outcome [17]. Interestingly, mean P(cv-a)CO
2
was larger
in patients with complications with a “normalized”
DO
2
/VO
2
ratio (ScvO
2
≥71%), than in patients without
complications, with 5 mmHg as the best threshold
value. According to ScvO
2
,CIandDO
2
ivalues,
enlarged P(cv-a)CO
2
could be explained by a certainly
small but persistent tissue hypoperfusion degree in
patients who go on to develop postoperative complica-
tions. The increase in venous PCO
2
would reflect a
state of insufficient flow relative to CO
2
production
[37]. This condition has been demonstrated previously
[22,38]. Indeed, Vallet and colleagues [22] evidenced
that the venous-to-arterial CO
2
gap (PCO
2
gap)
increased during low blood flow-induced tissue hypoxia
(ischemic hypoxia) while it remained unchanged during
hypoxemia-induced hypoxia (hypoxic hypoxia).
Table 3 Intraoperative biological data
Patients with complications (n = 24) Patients without complications (n = 46) P
Arterial pH
Baseline 7.42 ± 0.03 7.43 ± 0.04 0.27
T 1H 7.39 ± 0.04 7.41 ± 0.04 0.11
T 2H 7.39 ± 0.04 7.40 ± 0.02 0.17
T 3H 7.38 ± 0.05 7.39 ± 0.03 0.78
End of surgery 7.37 ± 0.05 7.38 ± 0.05 0.26
Arterial PO
2
, mmHg
Baseline 186 ± 39 195 ± 52 0.59
T 1H 185 ± 43 180 ± 41 0.56
T 2H 173 ± 44 179 ± 37 0.61
T 3H 172 ± 43 178 ± 35 0.46
End of surgery 178 ± 44 181 ± 37 0.59
Arterial PCO
2
, mmHg
Baseline 36 ± 5 36 ± 4 0.90
T 1H 37 ± 4 36 ± 3 0.41
T 2H 37 ± 4 36 ± 3 0.53
T 3H 36 ± 5 36 ± 3 0.62
End of surgery 36 ± 5 37 ± 3 0.36
BE, mmol L
-1
Baseline -1.7 ± 4.3 -0.5 ± 2.6 0.71
T 1H -3.2 ± 2.7 -1.1 ± 2.2 0.02
T 2H -2.6 ± 2.9 -1.5 ± 2.1 0.31
T 3H -2.4 ± 2.8 -2.4 ± 2.2 0.65
End of surgery -4.0 ± 2.6 -2.8 ± 2.7 0.11
SaO
2
,%
Baseline 98 ± 1.1 99 ± 0.8 0.03
T 1H 98 ± 1.0 99 ± 0.6 0.001
T 2H 98 ± 1.4 98 ± 0.8 0.025
T 3H 98 ± 1.2 98 ± 1.0 0.16
End of surgery 98 ± 0.8 98 ± 0.7 0.21
Data are presented as means ± SD.
BE, base excess; SaO
2
, arterial saturation of oxygen; T, time .
Futier et al. Critical Care 2010, 14:R193
/>Page 7 of 11
These results are in agreement with those of Bakker
and colleagues [24] who s howed that, in patients with
septic shock, the PCO
2
gap was smaller in survivors
than in non-survivors, despite quite similar CI, DO
2
and
VO
2
values. In septic shock patients, characterized by an
increased PCO
2
gap and a low flow state, fluid challenge
was f ound to lower the PCO
2
gap while increasing car-
diac output [39]. In contrast, no significant changes in
cardiac output and PCO
2
gap were found in patients
with normal PCO
2
, thus confirming the relationship
between an increased PCO
2
gap and insufficient flow
[39]. According to our P(cv-a)CO
2
values and the asso-
ciated trends in both lactate and base e xcess concentra-
tions (Tables 3 and 4), it can be speculat ed that, despite
an optimized preload with fluid challenge, patients with
ScvO
2
values ≥71% who developed complications might
have had a relatively insufficient flow state and might
have benefited from an increased CI as suggested by the
study of Donati [13]. Previous reports have shown that,
under conditions where O
2
demand exceeds O
2
con-
sumption (VO
2
), ScvO
2
(and O
2
extraction) does not
accurately reflect the O
2
demand/DO
2
relationship [40].
According to the modified Fick equation applied to
CO
2
,PCO
2
gap is linearly related to CO
2
production
(VCO
2
) and inversely related to CI [23]. Considering the
respiratory qu otient (VCO
2
/VO
2
ratio), VCO
2
is di rectly
related to O
2
consumption (VO
2
) [23]. Under conditions
of adapted cardiac output to VO
2
,eveniftheCO
2
pro-
duced is higher than normal because of an additional
anaerobic CO
2
production, in the presence of sufficient
flow to wash out the CO
2
produced by the tissues, the
PCO
2
gap should not be increased [22]. Conversely, low
blood flow can result in a widening of the PCO
2
gap
even if no additional CO
2
production occurs because of
aCO
2
stagnation phenomenon [38,41]. The association
of these situations may explain, in the current study, the
combination of “normal” ScvO
2
values and i ncreased
P(cv-a)CO
2
values. It can be argued that, despite an
apparently normal CI during the entire surgical proce-
dure, this condition could relate to a relatively insuffi-
cient flow state, and could be associated with an
increased O
2
demand and hence increased CO
2
produc-
tion. Whether increasing in the CI may be beneficial in
this situation remains to be evaluated.
These findings may be difficult to generalize because
the study has several limitations. First, we are aware that
the number of patients included was relatively small
which could limit the external validity of the study, and
that complementary d ata are needed to confirm the
results. Nevertheless, when we considered that at least
one measurement of P(cv-a)CO
2
> 5 mmHg would
repre sent a risk factor associated with the occurrence of
postoperative complications, we found a post-hoc power
of 52%. Furt hermo re, when we considered the number
of episodes of P(cv-a)CO
2
, w e found that more th an or
equal to three episodes of P(cv-a)CO
2
>5mmHgwas
associated with a 20% risk of post operative complica-
tions (with a post-hoc power calculation > 90%). Second,
while the threshold ScvO
2
value is very similar to that
described previously in a comparable surgical p opula-
tion, the optimal threshold P(cv-a) CO
2
value of
5 mmHg in line with a 71% ScvO
2
goal might be subject
to criticism. It might be considered that a higher ScvO
2
(that is, ≥73%) would represent a more appropriate tar-
get value [40]. Third, potential confounders such as
hypothermia, which may decrease cellular respiration
and, therefore, CO
2
generat ion [21], might have affected
the results. Nevertheless, during the entire surgical pro-
cedure, special attention was taken to maintain nor-
mothermia. In addition, except for fluid therapy,
intraoperative management was similar in the two
groups of patients. Although there was a significant dif-
ference in the volume of fluids infused, this was not
associated with postoperative complications with logistic
regression (P =0.16andP = 0.49 for crystalloids and
colloi ds, respectively). Even after adjustment P(c v-a)CO
2
> 5 mmHg still remains associated with the occurrence
Figure 3 Trends in ScvO
2
(a) and P(cv-a)CO
2
(b) in patients
who did (n = 24) and did not (n = 46) develop postoperative
complications. Data are expressed as means ± 95% CI. * P < 0.05.
Futier et al. Critical Care 2010, 14:R193
/>Page 8 of 11
of postoperative complications (P < 0.001). Fourth, the
use of central venous-to-arterial PCO
2
difference as a
surrogate for mixed venous PCO
2
gap might be a
further limitation. Nevertheless, it has recently been
found that central venous PCO
2
, obtained from a simple
central blood sample instead of a pulmonary arterial
blood sample, is a valuable alternative to PvCO
2
and
that correlation with CI still exists in this cont ext [21].
In addition, measurement of P(cv-a)CO
2
instead of P(v-
a)CO
2
may be more convenient in a surgical context.
Conclusions
There is strong support today for the use of individua-
lized goal-directed fluid substitution during high-risk
surgery. Although ScvO
2
reflects i mportant changes in
the O
2
delivery/consumption relationship, it is specu-
lated that P (cv-a)CO
2
might reinforce the value of
ScvO
2
to identify insufficient flow and tissue hypoperfu-
sion during high-risk surgery. In this context, P(cv-a)
CO
2
could be a useful complementary tool to ScvO
2
to
identify patients who remain inadequately managed
when the optimization goal has been reached by volume
loading during a GDT protocol. Future research is
needed to validate this finding.
Key messages
• Early detection and correction of tissue hypoperfu-
sion were shown to improve outcome during high-
risk surgery.
• Centralvenous-to-arterialCO
2
difference might
serve as a complementary tool to ScvO
2
to identify
insuf ficient flow when individualized optimization of
intravascular status has been reached with fluid
loading.
• Larger ran domized trials are now required to con-
firm the benefit of this approach.
Table 4 Intraoperative haemodynamic data and fluid management in patients with mean ScvO
2
> 71%
Patients with complications (n = 10) Patients without complications ( n = 36) P
CI, L min
-1
m
-2
Baseline 2.9 ± 0.8 2.7 ± 0.5 0.33
Mean 3.0 ± 0.7 2.9 ± 0.5 0.94
End of surgery 3.2 ± 0.7 3.1 ± 0.6 0.79
DO
2
i, mL min
-1
m
-2
Baseline 497 ± 94 510 ± 126 0.73
Mean 500 ± 73 518 ± 108 0.74
End of surgery 502 ± 74 527 ± 113 0.65
SV, mL
Baseline 75 ± 13 74 ± 19 0.52
Mean 79 ± 10 78 ± 17 0.47
End of surgery 82 ± 14 82 ± 20 0.84
MAP, mmHg
Baseline 76 ± 14 78 ± 17 0.93
Mean 76 ± 8 79 ± 11 0.81
End of surgery 75 ± 7 79 ± 10 0.37
Total volume of fluid Infused
Crystalloids, mL 3,375 (2,712 to 4,455) 4,250 (2,700 to 6,000) 0.18
Colloids, mL 5 (500 to 1,188) 250 (0 to 500) 0.11
Blood transfusion, N (%) of patients 2 (20%) 8 (22%) 0.63
Vasoactive support
Ephedrine chlorhydrate, N (%) of patients 8 (80%) 34 (94%) 0.15
Dobutamine, N (%) of patients 0 1 NR
Data are presented as means ± SD, median (interquartile range) or absolute values (%).
Abbreviations: CI, cardiac index; DO
2
i, oxygen delivery index; MAP, mean arterial pressure; NR, not related; ScvO
2,
central venous oxygen saturation; SV, stroke
volume.
5 mmHg
Sensitivity = 96%
Specificity = 57%
P(cv-a)CO
2
(mmHg)
Figure 4 Individual values of P(cv-a)CO
2
according to the
occurrence of postoperative complications in patients with
ScvO
2
≥71%. Abbreviations: C, patients with complications; UC,
patients without complications.
Futier et al. Critical Care 2010, 14:R193
/>Page 9 of 11
Abbreviations
ASA: American Society of Anaesthesiology; CI: cardiac index; CRP: C-reactive
protein; DeltaPV, respiratory variation in peak aortic flow velocity; DO
2
:
oxygen delivery; DO
2
i: oxygen delivery index; GDT: goal-directed therapy;
MAP: mean arterial pressure; PACU: post-acute care unit; PCT: procalcitonin;
P(cv-a)CO
2
: central venous-to-arterial carbon dioxide difference; P-Possum:
Portsmouth Physiological and Operative Severity Score for the Enumeration
of Mortality and Morbidity; PRBCs: packed red blood cells; P(v-a)CO
2
: mixed
venous-to-arterial carbon dioxide difference; ROC: receiver operating
characteristic; ScvO
2
: central venous oxygen saturation; SV: stroke volume;
SvO
2
: mixed venous oxygen saturation; VO
2
: oxygen consumption.
Acknowledgements
The authors thank Fabrice Kwiatkowski who performed the statistical data
analysis and Laurence Roszyk for biochemical data analysis.
This study was supported by the University Hospital of Clermont-Ferrand
(Clermont-Ferrand, France). The sponsor of the study had no role in the
study design, data collection, data analysis, interpretation of data or writing
of this report.
Author details
1
Department of Anaesthesiology and Critical Care Medicine, Estaing Hospital,
University Hospital of Clermont-Ferrand, 1 Place Lucie Aubrac, Clermont-
Ferrand, 63000, France.
2
Federation of Anaesthesiology and Critical Care
Medicine, University Hospital of Lille, Univ Nord de France, Rue du Pr. Emile
Laine, Lille, 59037, France.
Authors’ contributions
EF and JMC conceived and designed the original study. BV suggested
complementary analysis (assessment of P(cv-a)CO
2
). MJ and RG were
responsible for patient enrolment and participated in data acquisition. EF, ER,
BV and JEB drafted the manuscript. All authors read and approved the final
manuscript.
Competing interests
The authors declare that they have no competing interests.
Received: 15 May 2010 Revised: 16 July 2010
Accepted: 29 October 2010 Published: 29 October 2010
References
1. Shoemaker WC, Appel PL, Kram HB: Role of oxygen debt in the
development of organ failure sepsis, and death in high-risk surgical
patients. Chest 1992, 102:208-215.
2. Mythen MG, Webb AR: The role of gut mucosal hypoperfusion in the
pathogenesis of post-operative organ dysfunction. Intensive Care Med
1994, 20:203-209.
3. Lees N, Hamilton M, Rhodes A: Clinical review: Goal-directed therapy in
high risk surgical patients. Crit Care 2009, 13:231.
4. Giglio MT, Marucci M, Testini M, Brienza N: Goal-directed haemodynamic
therapy and gastrointestinal complications in major surgery: a meta-
analysis of randomized controlled trials. Br J Anaesth 2009, 103:637-646.
5. Bundgaard-Nielsen M, Holte K, Secher NH, Kehlet H: Monitoring of peri-
operative fluid administration by individualized goal-directed therapy.
Acta Anaesthesiol Scand 2007, 51:331-340.
6. Pearse R, Dawson D, Fawcett J, Rhodes A, Grounds RM, Bennett ED: Early
goal-directed therapy after major surgery reduces complications and
duration of hospital stay. A randomised, controlled trial
(ISRCTN38797445). Crit Care 2005, 9:R687-693.
7. Gan TJ, Soppitt A, Maroof M, el-Moalem H, Robertson KM, Moretti E,
Dwane P, Glass PS: Goal-directed intraoperative fluid administration
reduces length of hospital stay after major surgery. Anesthesiology 2002,
97:820-826.
8. Noblett SE, Snowden CP, Shenton BK, Horgan AF: Randomized clinical trial
assessing the effect of Doppler-optimized fluid management on
outcome after elective colorectal resection. Br J Surg 2006, 93:1069-1076.
9. Lopes MR, Oliveira MA, Pereira VO, Lemos IP, Auler JO Jr, Michard F: Goal-
directed fluid management based on pulse pressure variation
monitoring during high-risk surgery: a pilot randomized controlled trial.
Crit Care 2007, 11:R100.
10. Mythen MG, Webb AR: Perioperative plasma volume expansion reduces
the incidence of gut mucosal hypoperfusion during cardiac surgery. Arch
Surg 1995, 130:423-429.
11. Marjanovic G, Villain C, Juettner E, zur Hausen A, Hoeppner J, Hopt UT,
Drognitz O, Obermaier R: Impact of different crystalloid volume regimes
on intestinal anastomotic stability. Ann Surg 2009, 249:181-185.
12. Kimberger O, Arnberger M, Brandt S, Plock J, Sigurdsson GH, Kurz A,
Hiltebrand L: Goal-directed colloid administration improves the
microcirculation of healthy and perianastomotic colon. Anesthesiology
2009, 110:496-504.
13. Donati A, Loggi S, Preiser JC, Orsetti G, Munch C, Gabbanelli V, Pelaia P,
Pietropaoli P: Goal-directed intraoperative therapy reduces morbidity and
length of hospital stay in high-risk surgical patients. Chest 2007,
132:1817-1824.
14. Collaborative Study Group on Perioperative ScvO2 Monitoring: Multicentre
study on peri- and postoperative central venous oxygen saturation in
high-risk surgical patients. Crit Care 2006,
10:R158.
15. Pearse R, Dawson D, Fawcett J, Rhodes A, Grounds RM, Bennett ED:
Changes in central venous saturation after major surgery, and
association with outcome. Crit Care 2005, 9:R694-699.
16. Reinhart K, Rudolph T, Bredle DL, Hannemann L, Cain SM: Comparison of
central-venous to mixed-venous oxygen saturation during changes in
oxygen supply/demand. Chest 1989, 95:1216-1221.
17. Futier E, Constantin JM, Petit A, Chanques G, Kwiatkowski F, Flamein R,
Slim K, Sapin V, Jaber S, Bazin JE: Conservative versus restrictive
individualized goal-directed fluid administration in major abdominal
surgery: a prospective randomized trial. Arch Surg 2010.
18. Pearse RM, Hinds CJ: Should we use central venous saturation to guide
management in high-risk surgical patients? Crit Care 2006, 10:181.
19. Pope JV, Jones AE, Gaieski DF, Arnold RC, Trzeciak S, Shapiro NI:
Multicenter study of central venous oxygen saturation (ScvO(2)) as a
predictor of mortality in patients with sepsis. Ann Emerg Med 2010, 55:40.
e1-46.e1.
20. Vallee F, Vallet B, Mathe O, Parraguette J, Mari A, Silva S, Samii K,
Fourcade O, Genestal M: Central venous-to-arterial carbon dioxide
difference: an additional target for goal-directed therapy in septic
shock? Intensive Care Med 2008, 34:2218-2225.
21. Cuschieri J, Rivers EP, Donnino MW, Katilius M, Jacobsen G, Nguyen HB,
Pamukov N, Horst HM: Central venous-arterial carbon dioxide difference
as an indicator of cardiac index. Intensive Care Med 2005, 31:818-822.
22. Vallet B, Teboul JL, Cain S, Curtis S: Venoarterial CO(2) difference during
regional ischemic or hypoxic hypoxia. J Appl Physiol 2000, 89:1317-1321.
23. Lamia B, Monnet X, Teboul JL: Meaning of arterio-venous PCO2 difference
in circulatory shock. Minerva Anestesiol 2006, 72:597-604.
24. Bakker J, Vincent JL, Gris P, Leon M, Coffernils M, Kahn RJ: Veno-arterial
carbon dioxide gradient in human septic shock. Chest 1992, 101:509-515.
25. Levy MM, Fink MP, Marshall JC, Abraham E, Angus D, Cook D, Cohen J,
Opal SM, Vincent JL, Ramsay G: 2001 SCCM/ESICM/ACCP/ATS/SIS
International Sepsis Definitions Conference. Crit Care Med 2003,
31:1250-1256.
26. Rahbari NN, Zimmermann JB, Schmidt T, Koch M, Weigand MA, Weitz J:
Meta-analysis of standard, restrictive and supplemental fluid
administration in colorectal surgery. Br J Surg 2009, 96:331-341.
27. Slama M, Masson H, Teboul JL, Arnould ML, Nait-Kaoudjt R, Colas B,
Peltier M, Tribouilloy C, Susic D, Frohlich E, Andrejak M: Monitoring of
respiratory variations of aortic blood flow velocity using esophageal
Doppler. Intensive Care Med 2004, 30:1182-1187.
28. Monnet X, Rienzo M, Osman D, Anguel N, Richard C, Pinsky MR, Teboul JL:
Esophageal Doppler monitoring predicts fluid responsiveness in critically
ill ventilated patients. Intensive Care Med 2005, 31
:1195-1201.
29. Bennett-Guerrero E, Welsby I, Dunn TJ, Young LR, Wahl TA, Diers TL,
Phillips-Bute BG, Newman MF, Mythen MG: The use of a postoperative
morbidity survey to evaluate patients with prolonged hospitalization
after routine, moderate-risk, elective surgery. Anesth Analg 1999,
89:514-519.
30. Dindo D, Demartines N, Clavien PA: Classification of surgical
complications: a new proposal with evaluation in a cohort of 6336
patients and results of a survey. Ann Surg 2004, 240:205-213.
31. Hosmer DW, Hosmer T, Le Cessie S, Lemeshow S: A comparison of
goodness-of-fit tests for the logistic regression model. Stat Med 1997,
16:965-980.
Futier et al. Critical Care 2010, 14:R193
/>Page 10 of 11
32. Kwiatkowski F, Girard M, Hacene K, Berlie J: Sem: a suitable statistical
software adaptated for research in oncology. Bull Cancer 2000,
87:715-721.
33. Grocott MP, Mythen MG, Gan TJ: Perioperative fluid management and
clinical outcomes in adults. Anesth Analg 2005, 100:1093-1106.
34. Chappell D, Jacob M, Hofmann-Kiefer K, Conzen P, Rehm M: A rational
approach to perioperative fluid management. Anesthesiology 2008,
109:723-740.
35. Rivers E, Nguyen B, Havstad S, Ressler J, Muzzin A, Knoblich B, Peterson E,
Tomlanovich M: Early goal-directed therapy in the treatment of severe
sepsis and septic shock. N Engl J Med 2001, 345:1368-1377.
36. Jones AE, Shapiro NI, Trzeciak S, Arnold RC, Claremont HA, Kline JA: Lactate
clearance vs central venous oxygen saturation as goals of early sepsis
therapy: a randomized clinical trial. JAMA 2010, 303:739-746.
37. Groeneveld AB: Interpreting the venous-arterial PCO2 difference. Crit Care
Med 1998, 26:979-980.
38. Neviere R, Chagnon JL, Teboul JL, Vallet B, Wattel F: Small intestine
intramucosal PCO(2) and microvascular blood flow during hypoxic and
ischemic hypoxia. Crit Care Med 2002, 30:379-384.
39. Mecher CE, Rackow EC, Astiz ME, Weil MH: Venous hypercarbia associated
with severe sepsis and systemic hypoperfusion. Crit Care Med 1990,
18:585-589.
40. Shepherd SJ, Pearse RM: Role of central and mixed venous oxygen
saturation measurement in perioperative care. Anesthesiology 2009,
111:649-656.
41. Mekontso-Dessap A, Castelain V, Anguel N, Bahloul M, Schauvliege F,
Richard C, Teboul JL: Combination of venoarterial PCO2 difference with
arteriovenous O2 content difference to detect anaerobic metabolism in
patients. Intensive Care Med 2002, 28:272-277.
doi:10.1186/cc9310
Cite this article as: Futier et al.: Central venous O
2
saturation and
venous-to-arterial CO
2
difference as complementary tools for goal-
directed therapy during high-risk surgery. Critical Care 2010 14:R193.
Submit your next manuscript to BioMed Central
and take full advantage of:
• Convenient online submission
• Thorough peer review
• No space constraints or color figure charges
• Immediate publication on acceptance
• Inclusion in PubMed, CAS, Scopus and Google Scholar
• Research which is freely available for redistribution
Submit your manuscript at
www.biomedcentral.com/submit
Futier et al. Critical Care 2010, 14:R193
/>Page 11 of 11