perl the complete reference second edition phần 7 pot
Bạn đang xem bản rút gọn của tài liệu. Xem và tải ngay bản đầy đủ của tài liệu tại đây (1.16 MB, 125 trang )
710
Perl: The Complete Reference
find
The find command does not really have a language, but it does have a complex array
of command line options that can specify, fairly expertly, the definition of the files
you want to find. The find2perl script takes the command line options you would
normally supply to the find command, and generates a Perl script that will perform
the same function. The script produced actually makes use of the File::Find module,
which provides a mechanism for parsing a directory tree, following all the subdirectories.
For each file or directory found, a user-specified function is called, with the name and
location of the current file being available via the $_ variable and via some variables
located within the File::Find module.
The result is that Perl has the ability not only to locate a file within the current
directory structure, but also to do any number of other operations to convert, translate,
summarize, and so on, the contents of the files found.
The find2perl script does the basics of the file specification process for you,
producing a script that you can modify to your own ends. If you know how to use the
find command, then using the find2perl script should be easy. The command
$ find2perl / -name '*bin*' -type d -print
produces
#!/usr/local/bin/perl
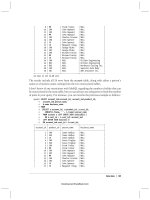
Option Description
-Dx Sets debugging, using a value of x. The value affects the output
produced by the conversion process, and adds a number of
additional statements to the script to output debugging information
during the script’s progress.
-Fc Specifies that the awk script was always invoked with a -F switch,
which changes the default input field separator to c.
-nfields Specifies the names of the input fields, rather than automatically
using a value of $Fld1, $Fld2, and so on. Fields can be separated by
any of the normal separation characters.
-number Forces a2p to assume that the input is always made up of the number
of fields specified by number.
Table 20-11.
Command Line Options to the awk Converter
TEAMFLY
Team-Fly
®
Chapter 20: Extending and Embedding Perl
711
DEVELOPING
APPLICATIONS
eval 'exec /usr/local/bin/perl -S $0 ${1+"$@"}'
if $running_under_some_shell;
require "find.pl";
# Traverse desired filesystems
&find('/');
exit;
sub wanted {
/^.*bin.*$/ &&
(($dev,$ino,$mode,$nlink,$uid,$gid) = lstat($_)) &&
-d _ &&
print("$name\n");
}
You can also specify more complex constructs directly to the find2perl script
without having to modify the code. There are two options: one to create a tar file and
the other to specify a Perl-specific evaluation for the file.
The -tar option takes a file name and adds the necessary code to the Perl script to
generate a file list to a piped tar command that then generates the tar file.
The -eval option takes a string that will be evaluated as a Perl statement; if it
returns true, the file will be considered as a match.
Converting Perl to Other Languages
With Perl 5, the facilities have been put in place to resolve a Perl script to its lowest
common denominator—the string of optimized opcodes that are executed by the Perl
interpreter proper. At the moment, two modules (B and O) provide a Perl interface to
the internals of a Perl script. The result is that the internal opcode tree can be converted
and parsed into a number of different formats to provide a range of different pieces
of information.
At present, this is limited to more extensive debugging features and the cross-
referencing abilities that are often available to other languages. The same interface also
provides you with the ability to generate a file in binary format called bytecode. This
binary code can then be executed directly by a special Perl interpreter. The code has
already been parsed and optimized, and much of the typical interpretation process has
already taken place. This makes the code execution much faster and also ensures, to a
greater or lesser extent, that the Perl source is hidden from casual view.
The most interesting feature of the B and O modules, however, is that they can
generate raw C code, which can then be compiled into a stand-alone executable. The
712
Perl: The Complete Reference
final executable does not require Perl and cannot be reverse engineered. The performance
benefits are debatable, but the distribution and security offered by the process are
obvious advantages.
Because this is a significant part of the entire Perl environment, it’s discussed more
fully in Chapter 22.
Calling Other Languages from Perl
You have seen many times how Perl can call and interact with an external program. In
some cases, the level of interaction has been as simple as calling the program with some
specified options. There is no reason why, with the use of dual pipes, you couldn’t call
and interact with another program, or even another programming language.
The most obvious road to cooperating with another language from Perl, however,
is to use Perl as a high-level environment that generates an optimized or customized
program that can then be executed via a separate language. Perl has many features
that make the manipulation of data, particularly strings, significantly easier; and if you
want to produce customized or optimized code automatically, it makes sense to use
a textual development environment to produce it.
When dealing with a CGI or other web-based system, you can generate the
JavaScript code that’s embedded into pages—you can even dynamically generate the
code to enable different features in the final page. What follows from this is the general
ability of Perl to generate the code for any language—it’s perfectly possible to create a
Perl application that generates, and even compiles, C source code into a final application.
In fact, this is exactly what some parts of the XS language and the Perl compiler (see
Chapter 22) actually do.
The trick is to make the best use of the Perl environment and, especially, make use
of the here document to create customized source code to be passed to the program or
language interpreter in question. Although it is possible to make use of pipes, most
languages accept an input file as their source. Remember that “compiled” languages—
such as C, C++, and Pascal—will require an external compiler, as well as additional
processes between code production and the final execution stages; but this should
not present too much difficulty.
If it truly is interaction with another language that you require, then the obvious
method is to set up some form of communication channel over which you can exchange
requests and requirements. All modern languages, including Java, Python, Rebol, and
Perl—provide the ability to open a network socket and exchange information.
Some platforms provide an interface through a Perl module for communicating with
other languages. For example, the Win32::OLE module allows you to communicate with
Windows objects, which in turn means that you can control the operation of Word, Excel,
and other Windows applications using Visual Basic semantics. Under Mac OS, you can
communicate directly with AppleScript, which in turn allows you to communicate with
the operating system and the applications, and through an application like Word to
Visual Basic again. See Appendix B in this book and Web Appendix B on the Web at
www.osborne.com for details on some of the platform-specific capabilities and the
modules that support them.
Part IV
Fine-Tuning Applications
Copyright 2001 The McGraw-Hill Companies, Inc. Click Here for Terms of Use.
This page intentionally left blank.
Chapter 21
Debugging and Tuning
715
Copyright 2001 The McGraw-Hill Companies, Inc. Click Here for Terms of Use.
O
nce you have completed your application, there are a number of things that
you might want to do before finally releasing your code to the world. One of
the most obvious procedures is to debug your code. Despite your best efforts,
there are bound to be bugs and problems in your code that you probably didn’t realize
were there, and certainly never intended to introduce.
Debugging under Perl can be handled in a number of different ways. There are
command line switches to output different levels of information, there’s the output
from the Perl compiler, which can be a useful addition to the debugger’s toolkit, and
there’s even an interactive debugger that you can use to execute and monitor the
progress of your Perl script’s execution.
There are also other steps that you need to take before you can release your code.
Documentation is always a good idea, not only as pointers for your end-users, but also
as a tool for you, so that when you go back to the code a few months later, you know
what it does, how, and why.
If your script is a general purpose tool, then you can make it appeal to a larger user
group by making it cross-platform aware, and if possible, compatible. Knowing which
functions, facilities, and systems are available on each platform is a good start, but
there are also tricks that you can apply to make the process easier.
Finally, Perl includes some tools that make the distribution and installation of
modules and applications easier. Learning how to make the best use of these modules
can dramatically increase the ease of use and installation by your end-users.
The other chapters in this section cover these latter parts of the application
development process. In this chapter, we’re going to concentrate purely on the
processes and tools available for debugging and optimizing the applications, scripts,
and modules that you write.
Debugging is a time-consuming and laborious process. When I was at college, I was
taught that the proper ratio was 80 percent testing and 20 percent development time,
and after many years in the programming business, I can affirm that that ratio is about
right. Even in a very simple piece of code, it’s possible to introduce some potential
bugs and problems. For every bug you find and eliminate, I can guarantee that two
more will be waiting in the wings. Furthermore, the solution to one bug may well
introduce new bugs that you aren’t aware of.
There is, however, more to debugging than simply finding the bugs and squishing
them. A good programmer will take a more pragmatic approach, and try to develop a
system that will trap most of the errors before they cause any problems. Remember that
the purpose of debugging, and in turn, error trapping, is to ensure that the software does
what it is supposed to do, while simultaneously ensuring that it doesn’t do anything it
shouldn’t. A simple log-processing script should not delete or corrupt the log in the
process, for example.
We’ve already seen some examples of basic error trapping in Chapter 9—you
should use Chapter 9 as a guide to isolating potential problems before they become real
ones. In this chapter, we’ll look at two basic procedures for debugging. The second is
the use of more simplified debugging processes, such as using print and caller to
716
Perl: The Complete Reference
provide a history of a script’s execution, and therefore to help you to identify where
things have gone wrong. The final, but certainly not least important, option that we
will look at is the use of the Perl built-in debugger.
The final stage of any debugging process is probably the one least followed—
optimization. Although many people do not consider it a bug, a badly optimized script is
as much a danger as one that overwrites files it shouldn’t have access to. A simple CGI
script that processes a form shouldn’t take hours doing so—monitoring the execution time
can often give you a good idea of where the problems lie. Within Perl, there are a few
solutions to that particular problem, including an extension to the core debugging
extensions, the Perl Profiler. This monitors the execution time of each subroutine in your
script and gives you an excellent idea of where there could be problems.
We’ll also look at some of the manual techniques available for improving
performance, and at some of the more obvious resource sinks that can slow execution.
It’s impossible in a single chapter to cover everything you need to know about trapping
errors and debugging. For a more detailed look at debugging with Perl, see my
Debugging Perl: Troubleshooting for Programmers (Osborne/McGraw-Hill, 2000),
from which a lot of the material in this chapter comes. See Appendix C for more
information.
Debugging Techniques
There are three basic methods for debugging a script. The first two are modifications
on a single theme—the primary tool is just to use print to output the information. The
second uses caller, which returns more extended information about the caller of the
subroutine, and then uses print to output the information. The last is to use one of the
full-blown debuggers. Perl actually comes with its own debugger, which is basically a
script and module combination called when you use the -d command line option to
Perl. If you use the ActiveState version of Perl under Windows, then you also have a
GUI-based debugger.
Just to add to the confusion, there is a fourth debugging system built into Perl—the
-D command line option—but this doesn’t often give any useful information to the
“end-user programmer.” Most of the detail given by -D is intended for those dealing
with the internal workings of the Perl compiler and interpreter. See Chapter 15 for
more information on the available options supported by the -D option. For a more
detailed look at what each of the options does, check out the Debugging Perl title (see
Appendix C for more information on this book).
Using print
To me, print statements have always seemed easy, and, providing you’re careful, they can
usually provide enough information for you to trace the bug without having to resort to a
full-blown debugger. In fact, the easiest way to use the humble print statement is during
Chapter 21: Debugging and Tuning
717
FINE-TUNING
APPLICATIONS
the development of a script—just inserting a quick “this variable has this value” is an easy
way for you to check that your script is doing what you think.
You can also use the print statement as a way of reporting debugging information
in the final version of the script. You usually use this method in combination with a
global variable, perhaps set via the script’s command line, to enable or disable some
simple debugging. The benefits of a script that outputs debugging information in this
way is that it allows both the user and programmer to perform a post-mortem debug
on the script. The only place where they are often useless is within a loop, because they
produce a voluminous amount of information that needs to be processed manually
after the execution is complete. On occasion, the loop mechanism can prove useful if
you want to continually monitor a single variable as it is processed, or when you want
to monitor the input or output to a filehandle.
Usage is pathetically simple. By using a statement such as this,
print "Got here!\n";
you can trace the execution path of a program. You can use the same basic layout for
any valid piece of data that you want to output.
Because you can print whatever you like, you can be quite explicit about the
information:
print "Data before processing: $data\n";
#process some data
print "Fieldname: $field, data: $data, leftovers: $leftover\n";
More usually, though, you’ll want to be a bit more explicit about the location in
which the debug report occurred. Here you can use the __LINE__ and __FILE__
directives, which insert the line number and current file in which the message was
printed, respectively. For example,
print __FILE__,'(',__LINE__,"): Data before processing $data\n";
might print out like this:
process.pl(19): Data before processing Name: Martin
Note that the __FILE__ and __LINE__ tokens must be outside of quotes in order for
them to be included in the printed line.
718
Perl: The Complete Reference
Chapter 21: Debugging and Tuning
719
FINE-TUNING
APPLICATIONS
Quoting Information
When using print to output data, it’s a good idea to delimit the information that you
are outputting. This limit helps to make it clear exactly what the actual data was. For
example, this report line:
process.pl(19): Data before processing Name: Martin
doesn’t tell us if there are any trailing tabs or spaces to the information, which may or
may not be important. A simple set of braces on either side of the data highlights the
full data string:
process.pl(19): Data before processing [Name: Martin ]
Here it’s obvious that we have some trailing spaces.
Don’t use angle brackets, <>, to delimit information, especially when displaying
debugging data within a CGI or other HTML script. The HTML parser may either
identify the entry as a proper HTML tag or simply ignore the data entirely!
You can also go one stage further and quote the special characters. The following
script defines two functions—the interface to the whole thing is the mapascii function.
This takes a string and then converts the special characters into their equivalent
sequence:
sub mapasciichar
{
my ($char) = @_;
@map = qw/
\0 [SOH] [STX] [ETX] [EOT] [ENQ] [ACK] \a \b \t \n \v \f \r
[SO] [SI] [DCE] [DC1] [DC2] [DC3] [DC4] [SYN] [ETB] [CAN]
[EM] [SUB] [ESC] [FS] [GS] [RS] [US]
/;
return $map[ord($char)] if (exists($map[ord($char)]));
return $char;
}
sub mapascii
{
my ($string) = @_;
join('',map { $_ = mapasciichar($_) } split //,$string);
}
print mapascii("Hello\nThis is a raw test\t\r\n"),"\n";
When you run the script as a whole, you get this:
Hello\nThis is a raw test\t\r\n
Other control characters will also be printed out with their ASCII names or in the
format that you would normally use when interpolating special characters into strings.
Tracing Execution
The line and file directives that we saw earlier provide a useful way of isolating the
exact script position that raised a particular error. Of course, it makes more sense to
include a more detailed report, such that the output produced is as detailed as
necessary and describes exactly what the script was doing at the point of the error.
Here’s the output from a print-debugged script that processes a file. The output
includes the contents of the variables that we are using to process the data:
$ foo.pl
Opened file (input.dat)
Read data (hello)
Read data (world)
Closed file
Remember at all times that when producing a debug report in this way, you should
be producing an annotated sequence of events. Doing this will help you and your users
to understand what is going on without having to look back at the script.
It’s a good idea to switch off the file buffering when outputting this information, so that
it’s updated in real time, rather than in chunks. The easiest way to do this is
use IO::Handle;
autoflush FILEHANDLE 1;
720
Perl: The Complete Reference
TEAMFLY
Team-Fly
®
Chapter 21: Debugging and Tuning
721
FINE-TUNING
APPLICATIONS
Using caller
Printing your own debug information requires a lot of manual entry if you are trying to
trace the execution path through a program. For each print statement you include in
your source, you will need to include a reference about the location of the statement in
order for your debug output to make sense.
To ease the process, you can use the caller function, which returns the current
context information for a subroutine. The information includes details about the
subroutine (or eval or require) statement:
caller EXPR
caller
In a scalar context, it simply returns the package name. In a simple list context, the
function returns the package name, file name, and line of the caller of the current
subroutine or eval or require statement:
($package, $filename, $line) = caller;
If EXPR is specified, caller returns extended information. The value of EXPR
should be the number of frames on the stack to go back to before the current one. That
is, if you specify a value of 1, the parent subroutine information will be printed, a value
of 2 will print the grandparent subroutine, and so forth. The information returned is
($package, $filename, $line, $subroutine,
$hasargs, $wantarray, $evaltext, $is_require) = caller($i);
The $evaltext and $is_require values are only returned when the subroutine being
examined is actually the result of an eval() statement. As an example, examine this script:
sub bar
{
Top::top();
}
bar();
package Top;
sub top
{
my $level = 0;
print "Top of the world, Ma!\n";
while ((($package, $file, $line,
$subname, $hasargs, $wantarray) = caller($level++)))
{
$hasargs = $hasargs ? 'Yes' : 'No';
if (defined($wantarray))
{
$wantarray = 'Yes';
}
else
{
$wantarray = 'No';
}
print <<EOF;
Stack:
Package: $package
File: $file
Line: $line
Subroutine: $subname
Has Arguments?: $hasargs
Wants Array?: $wantarray
EOF
}
}
When the code is executed, the resultant information shows the stack trace for the
top function, including its original call from main and from the bar function:
Top of the world, Ma!
Stack:
Package: main
File: ././t.pl
Line: 5
Subroutine: Top::top
Has Arguments?: Yes
Wants Array?: No
722
Perl: The Complete Reference
Stack:
Package: main
File: ././t.pl
Line: 8
Subroutine: main::bar
Has Arguments?: Yes
Wants Array?: No
The information provided should enable you to pinpoint the location within a
script. If you want to report the information to a log, you may want to introduce a
wrapper function, like this one:
sub callerlog
{
my $reference = shift;
open(DATA,">>caller.log") || return;
print DATA join(' ',@_),":$reference\n";
close(DATA);
}
Then to call the function, you would use a line such as
callerlog("Writing data",caller());
to report the information for the current stack trace. Note that you can’t directly use the
information from callerlog, since doing so would introduce its own frame of information
at location zero within the stack. You could, however, use a modified form of the
callerlog function that returns the stack trace from frame one onward:
sub callerlog
{
my $reference = shift;
my $level = 1;
while (((@data) = caller($level++)))
{
print join(' ',@data),":$reference\n";
}
}
The information provided by caller is actually used by the Perl debugger to
provide the tracing information used in the debugging environment.
Chapter 21: Debugging and Tuning
723
FINE-TUNING
APPLICATIONS
Using eval
The eval function provides a very simple way of checking certain events without
affecting the overall execution of your script. In essence, the eval function just initiates a
new instance of the Perl interpreter in order to evaluate a particular string or block. It’s
used in all sorts of places within Perl—including in the debugger where it allows you to
execute those arbitrary statements—but it can also be employed as a debugging tool.
Because eval evaluates a Perl statement or block within its own interpreter, we can use
it in situations that might otherwise cause the Perl interpreter to fail. This process works
because an embedded eval block reports any errors raised by a call to die through the $@
variable. In fact, any exit is reported through eval to the $@ special variable.
We can demonstrate this with a simple eval block used to test the existence of a
particular module:
eval
{
require Net::FTP;
}
print "Error: Module failed to load ($@)" if $@;
This outputs the following:
$ perl eval.pl
Failed to load Net::FTP: Can't locate Net/LICK.pm in @INC (@INC contains:
/usr/local/lib/perl5/5.6.0/i686-linux /usr/local/lib/perl5/5.6.0
/usr/local/lib/perl5/site_perl/5.6.0/i686-linux
/usr/local/lib/perl5/site_perl/5.6.0 /usr/local/lib/perl5/site_perl .) at
eval.pl line 1.
Armed with this information, we can now check anything (except statements executed
at compile time, such as use) that might raise an error, and we can trap and report the
problem.
The same operation can be followed for simpler statements, such as for checking a
possible divide-by-zero error. You could do this:
if ($b == 0)
{
print "Can't divide by zero\n";
}
else
{
print "Result is ", $a/$b,"\n";
}
724
Perl: The Complete Reference
But it’s slightly more convenient to do this:
eval { $a/$b };
print $@ if $@;
Here’s another example, this time of a function that uses an eval to execute its
statements so that it can return a single error back to the caller instead of simply calling
die and executing the script completely:
if ($error = writedata("debug", "some error text\n"))
{
print("Raised an error writing to the log: \n",$error,
"Continuing \n");
}
sub writedata
{
my ($file, $data) = @_;
eval
{
open (FILE, ">$file") or die "Can't open file ($file): $!";
print FILE $data or die "Can't write to file ($file): $!";
close(FILE) or die "Can't close file ($file): $!";
};
return $@ if ($@);
}
Here we’ve got essentially three places where we could potentially drop out of
the script. By embedding all three statements into an eval block and then checking the
return value from the whole function, we’ve managed to trap what might otherwise
be a critical failure into something that we can safely recover from. This capability
becomes incredibly useful in situations where you need to continue working even
if a particular option fails, but you want to avoid producing your own exception-
and error-handling system.
In this example, just running the script produces the following:
Raised an error writing to the log:
Can't open file (debug): Permission denied at eval.pl line 15.
Continuing
Chapter 21: Debugging and Tuning
725
FINE-TUNING
APPLICATIONS
In this case, we’ve just ignored the error, but you could redirect the sequence and error
report to a Tk widget or another HTML page if this was a CGI script.
The same trick also provides an ideal way of converting an existing script from a
command-line basis to a CGI or Tk basis without having to make major changes to the
code. For example, we could take out the embedded eval from the writedata function
and instead move it to surround the function call:
eval
{
writedata("debug", "some error text\n")
}
print("Raised an error writing to the log: \n",$error,
"Continuing \n") if $@;
The
writedata function remains unchanged, but the basic result is the same.
Writing a Log
There are times when you’ll need to write debugging-style information to something
other than the standard output and error filehandles. In these situations, you can
redirect the information directly to another file—we’ve already seen examples of this
with the caller function earlier in this chapter.
There are a number of different ways in which we can do this. At the simplest level,
you can just use print to send the output somewhere else. For a more comprehensive
solution, you should think about redirection. This approach will ensure that warn and
die also output their information to the log, rather to than to the real STDERR. The
final solution is to report information to the syslog daemon on a Unix machine, or to
the Event Log on a Windows machine. This procedure is useful for scripts that play a
vital role in an administration environment, where you need the information to be
reported to a central, rather than an application-specific, log.
Redirecting STDOUT/STDERR
The simplest way of creating a log without seriously affecting the output of your script
is to simply redirect the default STDOUT and STDERR to somewhere else, which you
can do like this:
open(SECOUT,">&STDOUT");
open(SECERR,">&STDERR");
open(STDOUT,">stdlog.txt");
open(STDERR,">stderr.txt");
Now, to print to the real standard output, you need to send output to SECOUT.
726
Perl: The Complete Reference
If you’re going to redirect the complete output of a script, consider placing the
redirection statement into a BEGIN block, so that everything is redirected to
the log files, even if an error is raised by an imported module.
In fact, it’s probably best to follow those statements with
select SECOUT;
to ensure that standard print and other calls send their output to the real STDOUT and
not the redirected one.
It’s a good idea to switch off the file buffering when sending information to a log; doing
this prevents overruns and ensures that data is written, even if the script crashes.
Since you will have control over the filehandle on which you provide the user
interface, but not the filehandle used to print the debugging information from the
contributed module, redirecting only STDERR is often a more practical solution.
It’s also possible, using this method, to create a log file of the debug output you
create. This file is especially useful when using an indirectly accessed script, such as
that used on a web server. Here, printing the debug information to the standard output
will cause the information to be included as part of the document that is sent back to
the user’s web browser.
Using a Logging Function
If you don’t want to redirect the STDOUT and STDERR filehandles, the other solution
is to create a function that opens and then writes the information you supply directly to
a log file.
sub writelog
{
my ($format,@rgs) = @_;
open(LOGFILE,">>debug.log")
or die "Can't open debug log!: $!\n";
printf LOGFILE ($format,@args);
close LOGFILE;
}
Now you can just make calls to the writelog function:
writelog("Had an error in the line %s from %s", $line, $file);
Chapter 21: Debugging and Tuning
727
FINE-TUNING
APPLICATIONS
A more efficient solution is to use a global variable as the filehandle and then
change the function so that it only opens the file if it isn’t already open:
my $logfile = undef;
sub writelog
{
my ($format,@rgs) = @_;
unless(defined($logfile))
{
open($logfile,">>debug.log")
or die "Can't open debug log!: $!\n";
}
printf $logfile ($format,@args);
}
Now the file will be opened once—when the first call to writelog is made—and log
information will then just be appended for each subsequent call.
Note that we’ve removed the call to close; I suggest that you instead put it into an
end block:
END
{
close($logfile) if (defined($logfile));
}
Doing this will ensure that the file is properly closed when the script terminates.
728
Perl: The Complete Reference
Debug Logs in the Real World
It’s probably a good idea to keep some form of logging system in a major
application. By logging the output of your application, you can track problems
as the application is used by the end-users. Then, when it comes to tracking a
reported problem, you have all of the information to hand.
To get the best use out of a debug log, make sure you also record the time
that the error was reported, the process ID, and, if relevant, the machine and/
or user name. When the user reports the error, get them to email you the log.
That way, when you examine the log, it should be easier to determine why the
error occurred.
Reporting to syslog
Perl comes with the Sys::Syslog module, which provides a very simple interface for
reporting information to the syslog system, which in turn is written to the system logs,
often held at /var/log/syslog (or similar). The best way to use the system if you intend
to log information in this way is to call the openlog function at the start of your script,
and then use syslog, which actually writes log entries, as a replacement for warn or
die. Remember to call closelog at the end to close the connection to syslogd (the syslog
daemon). A full example looks like
use Sys::Syslog;
openlog('perl', 'cons,pid', 'user');
syslog('warning' ,'Something happened');
closelog();
The preceding example produces the following entry on a Solaris system:
Jul 19 11:13:57 twinspark perl[2686]: Something happened
See Appendix B and the Sys::Syslog module for more information.
Reporting to the Windows NT/2000 Event Log
The Windows NT Event Log is a central logging system similar in principle to the
syslog system, but slightly more advanced. Primarily, the Event Log is used to record
errors and warnings, but it can also be used just to store simple informational messages
and also audit events—that is, those events configured by the administrator to be
specifically tracked and recorded.
The Event Log also stores a lot more information than syslog does in its standard
format. For example, the syslog system can be configured and set to report the computer
and user information, but it’s not enforced. With the Event Log, this information is
automatically recorded. In addition, you can include any data that was being processed
at the time, extended message strings, categories, and event types.
For example, this snippet
use Win32::EventLog;
my $eventlog = new Win32::EventLog('Application');
%event = (Data => 'Some data',
Source => 'Perl',
Chapter 21: Debugging and Tuning
729
FINE-TUNING
APPLICATIONS
EventID => 1,
EventType => EVENTLOG_WARNING_TYPE,
Strings => 'I failed to get the info I was expecting',
Category => 0);
$eventlog->Report(\%event);
will log an Application error into the Event Log. Note here that I’ve used a hash and
then called the Report method instead of embedding the information directly—it’s
quicker and easier to use the same hash and update only the relevant information
when you need to report a new error.
Using a Debugger
There are three basic tools available to you when you are using a debugger: watches,
stepping, and breakpoints. We’ll have a look at each of these tools and describe how
they can best be used to help you when debugging your scripts.
Watches
Watches are the variables that you want to monitor as you execute a script. You set a
watch on a variable, and then, for each statement that is executed, you are shown the
corresponding value of the variable. By using watches, you can monitor how a variable
is updated and isolate those instances where a variable is modified without you
realizing it.
Stepping
Stepping is the action of executing Perl statements, either individually or as a group
(as when you execute an entire function call in one go). By stepping, you can monitor
the execution and variables used and affected by a statement on a line-by-line basis.
There are three basic step commands, although some debuggers will offer some
additional options:
■
Step Into executes the current statement, following the execution of any
functions or methods found within the statement. Execution goes as far as
calling the function or method, bypassing any variable initialization, and
stopping at the first executable statement within the called function.
■
Step Over executes the current statement. Any functions or methods that are
called are executed without being processed by the debugger, so execution
stops on the next executable statement within the current file.
730
Perl: The Complete Reference
TEAMFLY
Team-Fly
®
■
Step Out continues execution until the current function or method ends.
Execution stops at the next executable statement, either within the next
function call of the current line from the calling script or on the next statement
from the caller.
The advantage of stepping over breakpoints is that it allows you to monitor each
line individually. This capability is particularly useful when you want to study a
sequence or each iteration of a loop in detail.
Breakpoints
Breakpoints offer a different approach. Instead of laboriously stepping through each
line of a script, you can set a breakpoint at a future point in the script and then start
execution. The debugger will execute all of the lines up until the given breakpoint. In
addition, you can also set a breakpoint to be triggered only when a variable matches a
certain condition.
For example, imagine you are having trouble within a loop, but only when the
loop counter reaches 1,000; you can set a breakpoint to be triggered when the counter
value is greater than or equal to 1,000. The loop will parse and execute 1,000 times, and
then the debugger will halt to allow you to process each individual line until you trace
the problem.
The Perl Debugger
The name Perl Debugger is a bit of a misnomer. The debugger is in fact just a suite of
modules and a script that ends up sitting almost simultaneously between and behind
the script you are attempting to run and the Perl interpreter that will execute it. By
sitting in this position, the debugger script can extract the individual lines of your
source file and incrementally execute each one—the stepping process.
In addition, the debugger allows you to set watches and breakpoints and provides you
with a way of directly executing Perl statements that can interface with the underlying
script. For example, when reaching a breakpoint, you might want to perform a simple
calculation on a value generated by the script.
The main difference between Perl and many other languages is that you can run
the debugger directly—in fact, straight from the command line. There isn’t a separate
application for doing the debugging, and there’s no reason to make any changes to
your code.
The User Interface
To start the debugger, you need to specify the -d option on the command line to the
Perl interpreter:
perl -d t.pl
Chapter 21: Debugging and Tuning
731
FINE-TUNING
APPLICATIONS
Alternatively, it can be used with a dummy -e statement to drop you straight into a
dummy debugger environment:
perl -de 1
Once the debugger is invoked, you are placed into it at the first executable
statement within the defined script:
Loading DB routines from perl5db.pl version 1.0401
Emacs support available.
Enter h or `h h' for help.
main::(-e:1): 1
DB<1>
The value in the angle brackets—1, in this example—is the number of the debugger
command. This can be recalled with the ! debugger command. The number of angle
brackets shows the current depth of the debugger. Calling a new subroutine via an s, n,
or t command will introduce a new set of brackets as a new execution path is created
within the script. You can specify multiline commands by using the \ character, which
has the effect of escaping the newline that would ordinarily end the command.
Rather confusingly, the line that is displayed before the prompt is the line that is
about to be executed, rather than the line that has been executed. Therefore, on first
entry into the debugger, no lines (other than compiler directives and package imports)
have actually been executed.
The normal operation is to set a breakpoint on a line or statement that you want to
monitor, and then use the T command to produce a stack trace. For example:
DB<4> b 16
DB<5> r
Top of the world, Ma!
main::callerlog(t.pl:16): print join(' ',@data),":$reference\n";
DB<6> T
. = main::callerlog('Printed Message') called from file 't.pl' line 23
. = main::top() called from file 't.pl' line 5
. = main::bar() called from file 't.pl' line 8
The actual execution process for each line in the script is as follows:
1. Check for a breakpoint.
2. Print the line, using tracing if the AutoTrace option has been set.
3. Execute any actions defined.
732
Perl: The Complete Reference
4. Prompt the user if there is a breakpoint or single step.
5. Evaluate the line.
6. Print any modified watchpoints.
Once the execution has halted, you can step through the script, either by every line,
using the s command, or by each line, stepping over subroutine calls, using the n
command.
Note that compile-time statements are not trapped by the debugger, which means
that those enclosed in a BEGIN block, or statements such as use, are not stopped by the
debugger. The best method for trapping them is to specify the value of the $DB::single
variable that is part of the Perl debugger. Although it requires modification of the code,
it does not affect anything if the debugger is not running. A value of 1 for the
$DB::single variable is equivalent to having just typed s to the debugger. A value of 2
indicates that n should be used. Alternatively, you can monitor the status of the
commands using the AutoTrace option.
You can set watchpoints, which display the value of a variable if it has been
modified in the just-executed statement. For example, in the script,
while (<DATA>)
{
chomp;
}
you could set a watchpoint for $_, which would print the value of $_ for each iteration
of the loop.
Debugger Commands
The debugger supports a wide range of commands that are outlined next. As a general
rule, anything that is not immediately identified as a command, or alternatively any
input line beginning with a space, is interpreted as a Perl statement that is executed via
an eval function.
Any debugger command can be piped through an external program by using the pipe
symbol, just as at a Unix shell prompt. This feature is primarily useful for parsing
output through a pager, but could be used for anything.
h
h COMMAND
h
Chapter 21: Debugging and Tuning
733
FINE-TUNING
APPLICATIONS
734
Perl: The Complete Reference
Prints out help information for COMMAND or general help if COMMAND is not
specified. If you use the special h h command, a condensed version of the general help
is printed—it should fit onto a standard screen without scrolling. See the O command
later for details on how to change the default paging program.
p
p expr
Prints the evaluated value of expr using the standard print built-in function. The
value of expr can include variables and functions defined within the current script
being debugged.
The usual rules for the print function apply—nested structures and objects will not
be printed correctly. (See the x command for a more useful version of this command.)
x
x expr
Evaluates its expression in list context and dumps out the result in a pretty printed
fashion. Nested data structures are printed out recursively, unlike with the print
function. See the options in Table 21-1, further on in the chapter.
V
V PACKAGE VARS
V PACKAGE
V
Displays the list of variables specified in VARS within the package PACKAGE
if both are specified. If VARS is omitted, all variables for PACKAGE are printed.
If no arguments are specified, it prints out all the variables for the main package.
Information is intelligently printed, with the values of arrays and hashes and nested
structures being formatted before being output. Control characters are also converted
into a printable format.
If you specify the variables, you should omit the variable type characters ($, @, or
%). You can also specify a pattern to match, or a pattern not to match, using
~PATTERN and !PATTERN arguments.