Hydroelectric Power in Vietnam (VNCOLD Document for the Meeting of ICOLD Committee on “Dams for Hydroelectric Energy” (DHE), 2008) docx
Bạn đang xem bản rút gọn của tài liệu. Xem và tải ngay bản đầy đủ của tài liệu tại đây (548.44 KB, 4 trang )
www.vncold.vn
Hydroelectric Power in Vietnam
(VNCOLD Document for the Meeting of ICOLD Committee on
“Dams for Hydroelectric Energy” (DHE), 2008)
Dr. DAM Quang Chi
VNCOLD Representative at the DHE / ICOLD Committee
Existing situation of power demand and power generation as per data collected in 2005
and 2006 with prospect to 2015:
ELECTRICITY PRODUCTION AND GENERATION
Year 2005 2006 2010 2015
Electricity production (Billion
kwh)
53.50 60.60 124.00 257.00
Electricity sale (Billion kwh) 45.60 51.50 107.00 223.00
Total capacity of PP (MW) 11,286 11,837 26.000/27.000 60.000/70.000
Hydro PP (MW) 4,198 4,749 10,211 19,874
Percentage of hydropower in
Total PP
37% 40% 38-40% 28-33%
Sources: Luong van Dai, EVN
www.vncold.vn
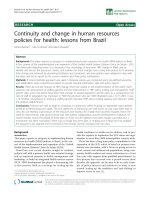
Dai_Ninh Hydropower Plant in the Southern part of Central Vietnam, 300 MW
On the other hand, some information on electricity demands up to 2020 are given on
EVN website but these values probably estimated before the issue of the last Master
Plan VI and seem pessimistic compared to the production forecast by this Plan. To be in
compliance with the Master Plan, we propose these following provisional figures
calculated from the known figures of 2005 and with a growth rate of 17% /year as per the
low assumption of the Plan:
Electricity demands
(Billion kWh)
Power
sales
E demands
(source EVN)
E demands
Growth 17%
from 2005 figure
E produced
(souce LVD)
E
commercial
(source
LVD)
Known figures 2005 44.9 47 47 53.5 45.6
2010 70 103 124 107
2015 110 226 257 223
2020 170
Evolution of power generation can be estimated in details according to the Master Plan
VI issued on July 18
th
2007 by the Prime Minister of the Government, with mainly two
alternatives in electricity needs growth rates of 17% (assumption low) and 20% (high
assumption). An assumption of 22% was also considered in the Master Plan for
excceptional circumstance but not specified in the said document.
Extracts of the calculation tables are given as follows:
www.vncold.vn
MASTER PLAN VI ( Assumption Hight )
MW
Additional
Capacity/year
as per Master
Plan VI
Total Power
Additional
Hydel
Capacity/year
as per Master
Plan VI
Total Hydel
Capacity
%Hydel in
Total
Power
Existing to
2005
11,286 4,198 37.2%
2006 861 551
2007 2,096 746
2008 3,271 1,551
2009 3,393 1,239
2010 6,160
27,067
2,190
10,475 38.7%
2011 6,001 1,901
2012 7,154 2,754
2013 8,309 1,759
2014 10,977 2,227
2015 10,922
70,430
1,022
20,138 28.6%
2016 10,067 767
2017 12,025 625
2018 12,150
2019 13,782 1,582
2020 14,250
132,704
1,300
24,412 18.4%
2021 15,500 1,500
2022 16,450 1,450
2023 17,850 850
2024 18,450 1,450
2025 18,150
219,104
1,150
30,812 14.1%
Total 219,104
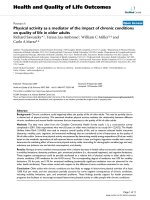
Yaly Hydropower Plant in the Western Highland of Central Vietnam, 720 MW
www.vncold.vn
MASTER PLAN VI (Assumption Low)
MW
Additional
Capacity/year
as per Master
Plan VI
Total
Power
Additional
Hydel
Capacity/year
as per Master
Plan VI
Total Hydel
Capacity
%Hydel in
Total
Power
Existing to 2005
11,286 4,198 37.2%
2006 861 551
2007 2,096 746
2008 3,271 1,551
2009 3,393 1,239
2010 4,960
25,867
2,190
10,475 40.5%
2011 5,401 2,201
2012 6,554 2,754
2013 7,309 1,759
2014 7,177 1,752
2015 7,722
60,030
1,022
19,963 33.3%
2016 9,317 767
2017 10,025 625
2018 10,150 0
2019 10,982 1,582
2020 11,250
111,754
1,300
24,237 21.7%
2021 11,700 1,500
2022 12,650 1,450
2023 13,850 850
2024 15,450 1,450
2025 16,150
181,554
1,150
30,637 16.9%
Total 181,554
Comments:
1/Figures of 2005 are given by a document from M Luong Van Dai.
2/ It is sometimes not clear that Small Powers Plants and IPP are hydroelectric or not
3/Pumped storage power projects are accounted as hydroelectric.
4/These figures are given to initialize a discussion and need to be checked further with
different sources.