Báo cáo y học: " Statistical distribution of blood serotonin as a predictor of early autistic brain abnormalities" ppt
Bạn đang xem bản rút gọn của tài liệu. Xem và tải ngay bản đầy đủ của tài liệu tại đây (628.99 KB, 16 trang )
BioMed Central
Page 1 of 16
(page number not for citation purposes)
Theoretical Biology and Medical
Modelling
Open Access
Research
Statistical distribution of blood serotonin as a predictor of early
autistic brain abnormalities
Skirmantas Janušonis*
Address: Yale University School of Medicine, Department of Neurobiology, P.O. Box 208001, New Haven, CT 06520-8001, USA
Email: Skirmantas Janušonis* -
* Corresponding author
Abstract
Background: A wide range of abnormalities has been reported in autistic brains, but these
abnormalities may be the result of an earlier underlying developmental alteration that may no
longer be evident by the time autism is diagnosed. The most consistent biological finding in autistic
individuals has been their statistically elevated levels of 5-hydroxytryptamine (5-HT, serotonin) in
blood platelets (platelet hyperserotonemia). The early developmental alteration of the autistic
brain and the autistic platelet hyperserotonemia may be caused by the same biological factor
expressed in the brain and outside the brain, respectively. Unlike the brain, blood platelets are
short-lived and continue to be produced throughout the life span, suggesting that this factor may
continue to operate outside the brain years after the brain is formed. The statistical distributions
of the platelet 5-HT levels in normal and autistic groups have characteristic features and may
contain information about the nature of this yet unidentified factor.
Results: The identity of this factor was studied by using a novel, quantitative approach that was
applied to published distributions of the platelet 5-HT levels in normal and autistic groups. It was
shown that the published data are consistent with the hypothesis that a factor that interferes with
brain development in autism may also regulate the release of 5-HT from gut enterochromaffin cells.
Numerical analysis revealed that this factor may be non-functional in autistic individuals.
Conclusion: At least some biological factors, the abnormal function of which leads to the
development of the autistic brain, may regulate the release of 5-HT from the gut years after birth.
If the present model is correct, it will allow future efforts to be focused on a limited number of
gene candidates, some of which have not been suspected to be involved in autism (such as the 5-
HT
4
receptor gene) based on currently available clinical and experimental studies.
Background
Our ability to treat and prevent autism is severely limited
by our lack of knowledge of what biological abnormality
causes this developmental disorder. Since autism is con-
sidered primarily a brain disorder, much of the research
over the past decades has focused on the autistic brain.
Different groups have reported a wide range of anatomical
abnormalities in autistic brains, such as reduced numbers
of Purkinje cells in the cerebellum [1-3]; an unusually
rapid growth of the cerebral cortical volume and head cir-
cumference during the first years after birth [4-9]; abnor-
mal cortical minicolumns [10-13]; abnormalities of the
limbic system [14-19]; abnormalities of the brainstem
[20-22]; and other brain alterations [23-25].
Published: 19 July 2005
Theoretical Biology and Medical Modelling 2005, 2:27 doi:10.1186/1742-4682-2-27
Received: 09 March 2005
Accepted: 19 July 2005
This article is available from: />© 2005 Janušonis; licensee BioMed Central Ltd.
This is an Open Access article distributed under the terms of the Creative Commons Attribution License ( />),
which permits unrestricted use, distribution, and reproduction in any medium, provided the original work is properly cited.
Theoretical Biology and Medical Modelling 2005, 2:27 />Page 2 of 16
(page number not for citation purposes)
Considering the complexity of brain development and its
highly dynamic nature, these abnormalities may be the
result of a long, complex chain of events. The original
abnormality that caused them may occur early in develop-
ment [26] and may be no longer obvious by the time
autism is diagnosed. For example, an autistic-like loss of
Purkinje cells may be caused by a mutation of the toppler
gene, which causes severe ataxia in mice and appears to be
irrelevant to autism [27]. Post-mortem analysis of younger
autistic brains is not an option, because it is usually not
clear until age 2 or 3 which brains are autistic and which
are not.
Fortunately, evidence suggests that at least one biological
factor that causes the development of the autistic brain
has a different function outside the central nervous system
(CNS), where it continues to operate well into childhood
and perhaps even into adulthood. Since the early 1960s,
the most consistent biological finding in autistic individ-
uals has been their statistically elevated serotonin (5-
hydroxytryptamine, 5-HT) levels in blood platelets, or
platelet hyperserotonemia [28-33]. Unlike many of the
reported alterations in the brain, this finding has been
replicated numerous times by different groups, some of
which have used large numbers of subjects. According to
Anderson [33], "the platelet hyperserotonemia of autism
[ ] is generally considered to be one of the more robust
and well-replicated findings in biological psychiatry". The
main reason why we have not capitalized on this major
finding is that we have not been able to understand its ori-
gin or its relation to the brain.
It is unlikely that the autistic platelet hyperserotonemia is
induced by the brain. The human blood-brain barrier
(BBB) becomes mature around one year after birth, if not
earlier [34,35], and is virtually impenetrable to 5-HT.
Tryptophan, a 5-HT precursor, can cross the BBB, but tryp-
tophan levels do not appear to be altered in autistic indi-
viduals [36]. Unlike the anatomy of the mature brain,
platelet 5-HT levels should be actively maintained,
because the half-life of platelets is only a few days [37,38].
This suggests that the factor that causes the platelet hyper-
serotonemia continues to be functionally active years after
birth.
The statistical distribution of platelet 5-HT levels in nor-
mal and autistic groups has certain characteristic features
[31], but only recent studies have attempted to describe
them in detail [39,40]. These distributions are likely to
contain information about the underlying processes con-
trolling platelet 5-HT levels and, therefore, may help iden-
tify the factor that causes the platelet hyperserotonemia of
autism. This same biological factor may be active during
brain development (not necessarily in the same role), but
there its identity may be obscured by the final complexity
of a several-year-old autistic brain (Fig. 1). In the present
study, published distributions of blood 5-HT levels are
analyzed by a novel, quantitative approach that may help
trace early, experimentally undetectable brain abnormali-
ties leading to autism.
Results
Basic model
The origin of the platelet hyperserotonemia of autism can-
not be understood unless a certain model of the underly-
ing physiological processes is accepted – whether it is an
implicit model that is not clearly stated, a model
described in words, or a mathematical model. One advan-
tage of mathematical modeling is that it requires a clear
description of all relevant interactions among the compo-
nents of the system. Its greatest disadvantage is that
sometimes clear-cut choices have to be made where exper-
imental data may suggest a few possible alternatives. In
this section I introduce a model that is based on what is
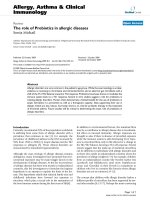
A biological factor that causes autism may have a dual functionFigure 1
A biological factor that causes autism may have a
dual function. A factor that causes autism (shown in red)
may be expressed (1) in the CNS, where it plays a role in the
early development of the brain, and (2) outside the CNS,
where it participates in processes that determine the 5-HT
levels in blood platelets. The "central" and "peripheral" 5-HT
systems are separated by the blood-brain barrier (BBB) that
matures after birth. It is usually not clear until age 2 or 3
whether the brain is autistic (black box). By that time, the
factor has altered numerous developmental processes in the
brain and may no longer be obvious. This same factor contin-
ues to operate years after birth outside the CNS, where it
maintains higher than normal 5-HT levels in blood platelets.
In contrast to the brain, blood platelets are short-lived and
continue to be produced throughout the life span.
BBB
BRAIN
BLOOD
BRAIN
BLOOD
time~2 years
?
Theoretical Biology and Medical Modelling 2005, 2:27 />Page 3 of 16
(page number not for citation purposes)
known about the 5-HT circulation outside the CNS and
point out two important but unresolved problems.
In search of a factor that can both cause platelet hyperser-
otonemia and alter normal brain function, many recent
studies have focused on the serotonin transporter (SERT)
that is expressed in blood platelets and brain neurons
[41]. Despite early promising results [42], different groups
have found little or no linkage [43] between SERT poly-
morphisms and autism in various ethnic groups [40,44-
47]. I have recently proposed [48] that the factor that
interferes with brain development in autism may also reg-
ulate the release of 5-HT from gut enterochromaffin (EC)
cells, the main source of blood 5-HT [36,49,50]. First, this
hypothesis assumes that EC cells can monitor (directly or
by way of gastrointestinal neurons) the 5-HT levels in the
surrounding extracellular space and can decrease or
increase their 5-HT release accordingly. Similar control
mechanisms have long been suspected in the brain, where
serotonergic neurons express 5-HT autoreceptors [51,52].
Second, the levels of extracellular 5-HT in the gut wall are
assumed to be at equilibrium with the levels of free 5-HT
in the arterial blood. While the baseline extracellular lev-
els of 5-HT in the gut wall have not been precisely meas-
ured, the estimated levels of free 5-HT in the arterial blood
appear to be comparable to the extracellular 5-HT levels in
the brain [51,53], which expresses some of the same 5-HT
receptors as the gut [51,54-57].
This hypothesis can be cast in a mathematical form. Sup-
pose that EC cells indirectly monitor the levels of free 5-
HT that arrives in the gut with the arterial blood, compare
these levels with the expected 5-HT levels, and adjust their
5-HT release to a new value (R
n+1
), using a pre-set release
value (R
C
) as the reference point. The strength (gain) of
this adjustment is controlled by a factor
α
, which is
hypothesized to be different in normal and autistic indi-
viduals. After the blood leaves the gut, a large proportion
(
γ
) of the free 5-HT is quickly removed by the liver, lungs
and other organs that express SERT and monoamine oxi-
dases (MAOs) [58-62]. The numerical value of
γ
is likely
to vary from individual to individual, because the SERT
and MAO genes have a number of polymorphic variants
distributed in the population [40,45,46,63-66]. There-
fore,
γ
is considered to be a random variable with a known
probability distribution. The model can then be described
by the following system of equations:
F
n + 1
= (1 -
γ
)F
n
+ R
n + 1
, (2)
Where (1 -
γ
)F
n
is the flux of free 5-HT that enters the gut
with the arterial blood, F
C
is the pre-set ("expected") flux,
and F
n + 1
is the flux of free 5-HT that exits the gut (α ≥ 0,
0 ≤ γ ≤ 1, F
C
> 0, R
C
> 0). In the model, the 5-HT release
from EC cells does not include the 5-HT that is used for
local signaling and is rapidly removed by local gastroin-
testinal epithelial and neural cells expressing SERT
[54,67,68]. This 5-HT could be included in the model,
together with the local clearance rate, if estimates of these
parameters were available.
It is thought that little free 5-HT is taken up by blood
platelets, before most of it is removed by the liver, lungs
and other organs [53,60]. Also, it has been suggested that
platelet 5-HT levels may depend on the levels of free 5-HT
in the blood almost linearly [53]. Then, at the steady state,
F
n + 1
= F
n
≡ F and R
n + 1
= R
n
≡ R for any n, and platelet 5-
HT levels are
where K > 0 is a constant.
Note that ser(
α
,
γ
) is a decreasing function of
γ
. Also, at the
steady state,
R =
γ
F. (4)
It should be emphasized that the mathematical simplicity
of equations (1) and (2) in no way implies that the bio-
logical regulation of 5-HT release in the gut is simple. The
human gut is a remarkably complex organ that uses a wide
range of neurotransmitters and that may have at least as
many neurons as the spinal cord [50]. Nevertheless, recent
studies suggest that complex biological systems, such as
brain neurons, can be "actively linear" [69], meaning that
sophisticated biological mechanisms may act on intrinsi-
cally non-linear physical processes to produce quantita-
tive relationships that are mathematically linear.
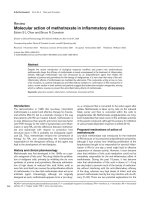
The dependence of platelet 5-HT levels on
α
and
γ
is plot-
ted in Figure 2, where the numerical values of F
C
and R
C
are taken from previously published experimental and
theoretical studies [48,53,70], and where the regulation of
the 5-HT release from EC cells is assumed to be less than
fully functional in autistic individuals (note the low
α
value). A key feature of this dependence is that, in normal
individuals, platelet 5-HT levels remain low with any
γ
,
whereas in autistic individuals these levels may be normal
or higher than normal depending on the individual's
γ
.
This dependence captures one of the most puzzling prop-
erties of the autistic distribution of platelet 5-HT levels,
which always overlaps with the control (normal) distribu-
tion, but always includes individuals whose 5-HT levels
are higher than normal [31]. It may also explain why the
SERT and MAO genes may appear to be linked with
RR
R
FF
F
nC
C
Cn
C
+
−
=
−−
()
1
1
1
α
γ
()
,
ser K F
KF R
RF
CC
CC
(,) ( )
()()
()
,
αγ γ
αγ
αγ γ
≡−=
+−
−+
()
1
11
1
3
Theoretical Biology and Medical Modelling 2005, 2:27 />Page 4 of 16
(page number not for citation purposes)
autism but may not actually cause it. As shown in Figure
2, a low
γ
is a necessary but not sufficient condition for the
platelet hyperserotonemia to occur. Given a low
γ
, the
platelet hyperserotonemia will occur only in those indi-
viduals whose regulation of the 5-HT release from EC cells
is compromised (i.e., they are autistic and have a low
α
).
It follows then that
γ
acts only as a modifier of platelet 5-
HT levels, and that the statistical distribution of
γ
may be
the same in normal and autistic populations. Assuming
an individual's
γ
value is determined, at least in part, by
his/her variants of the SERT and MAO genes expressed in
the liver, lungs and other organs, normal and autistic pop-
ulations may have similar distributions of SERT and MAO
polymorphisms. This assumption is supported by recent
studies [40,45-47,63,64].
Two potentially contentious decisions were made in the
model. First, the exact levels of free 5-HT in the blood
remain a debated issue. While a number of studies have
found "low" but consistently measurable levels of free 5-
Platelet levels as a function of
α
and
γ
Figure 2
Platelet levels as a function of
α
and
γ
. Platelet 5-HT levels, ser(
α
,
γ
), plotted as a function of
α
(the factor regulating 5-HT
release from EC cells) and
γ
(the rate of 5-HT clearance by the liver, lungs, and other organs). This relationship is described by
equation (3), where K is a constant. Note that if
α
is normal (high), platelet 5-HT levels stay low with any
γ
, but if
α
is autistic
(low), individuals with a low
γ
become hyperserotonemic. The black circles mark the points whose coordinates are independ-
ent of
α
and are
γ
* = R
C
/(R
C
+ F
C
) and ser(
α
,
γ
*) = KF
C
. Note in equations (1) and (2) that R = R
C
if and only if
γ
=
γ
*, so the dis-
tribution of
γ
is likely to contain
γ
*. This guarantees that the distributions of the 5-HT levels in normal autistic groups will
always overlap, as observed in clinical studies. For illustrative purposes, the normal and autistic values of
α
were arbitrarily set
at 0.20 and 0.02, respectively. These are realistic values, as follows in the text. The other parameter values were taken from
published studies [48, 53, 70] and were F
C
= 210 ng/min and R
C
= 3000 ng/min.
1
1
0.0
0.1
0.2
0.3
0.4
0K
1000K
2000K
1.0
0.9
0.8
0.7
0.6
α
γ
ser(α,γ)
1.00.90.80.70.6
500K
1000K
1500K
2000K
α = 0.20
γ
1.00.90.80.70.6
2000K
1500K
1000K
500K
α = 0.02
γ
NORMAL
AUTISTIC
ser(α,γ)ser(α,γ)
Theoretical Biology and Medical Modelling 2005, 2:27 />Page 5 of 16
(page number not for citation purposes)
HT in the human blood [53,70,71], Chen et al. [72] have
suggested that the concentration of free 5-HT in the blood
may be negligible, since these researchers have detected
virtually no 5-HT in the whole blood of SERT-deficient
mice whose blood platelets cannot take up 5-HT. Second,
the model assumes that virtually all of the 5-HT stored in
blood platelets is taken up by them after the lungs, liver,
and other organs have cleared a large proportion of the 5-
HT released by the gut. While evidence exists this may be
the case [53,60], not all researchers agree. One could con-
ceivably take into account both of these views by setting
ser(
α
,
γ
) ≡ K
1
F + K
2
(1 -
γ
)F
or, in a more general form,
where K
1
, K
2
≥ 0 are constants and K(
ω
) is a function.
However, this would require more detailed information
about the dynamics of the 5-HT uptake by platelets, which
is not currently available [31].
Distributions generated by the model
While the model (Fig. 2) appears to capture some of the
key characteristics of the reported platelet 5-HT levels, it
remains unclear whether it would produce similar results
if
α
and
γ
took on other numerical values. The regulation
of the 5-HT release in EC cells is poorly understood and
no experimental estimates for the parameter
α
are availa-
ble. Is it actually lower in autistic individuals? Likewise,
how reasonable is it to suppose that the distribution of
γ
is the same in normal and autistic groups? Importantly,
would the model produce consistent numerical values of
parameters if different experimental studies were used?
To answer these questions, one may consider the basic
framework of the model to be correct, but make no a priori
assumptions about the values of the parameters (with the
exception of those that are experimentally known) or
about their differences in normal and autistic individuals.
Then the unknown parameters of the model may be
allowed to vary in the numerical space until the statistical
distributions of 5-HT levels produced by the model
closely match those reported in actual clinical studies. In
order to be able to do this, one first has to find the theo-
retical statistical distributions of platelet 5-HT levels pro-
duced by the model.
The exact population distribution of
γ
is unknown, but its
mean value is likely to be close to one [60]. Since SERT
gene polymorphisms may occur with comparable fre-
quencies [73], the statistical distribution of
γ
in a popula-
tion can be approximated by a continuous uniform
distribution on the interval [a, b] with the probability den-
sity function
It can be shown from equations (3) and (5) that the prob-
ability density function of platelet 5-HT levels then is
The theoretical population mean
µ
ser
(
α
, a, b) and variance
(
α
, a, b) of platelet 5-HT levels follow immediately:
and
where U ≡ F
C
- R
C
α
.
The standard deviation of platelet 5-HT levels in the pop-
ulation then is
Distributions reported in clinical studies
Mean values of normal and autistic blood 5-HT levels
have been reported and discussed in numerous publica-
tions [28-33]. In contrast, the precise statistical
distributions of the platelet 5-HT levels in normal and
autistic groups, such as their histograms (which roughly
approximate their theoretical probability density func-
tions), have so far attracted little attention. Only a few
recent reports have presented more detail about the shape
of these distributions. These reports are used in the fol-
lowing analysis:
(i) Mulder et al. [39] is recent and perhaps the most relia-
ble report to date. It has used a relatively large sample of
subjects whose platelet 5-HT levels are presented in histo-
grams. The authors of this report are well-established
researchers of blood 5-HT and autism. One of the co-
ser K Fd(,) ()( ) ,
αγ ω ωγ ω
≡−
∫
1
0
1
fx
dP x
dx b a
axb
γ
γ
()
()
,.≡
≤
=
−
≤≤≤≤
()
1
015 where
fx
dP ser x
dx
KF R
baxR F KFR
ser
CC
CC C
(,)
((,) )
()
()[( )
α
αγ
α
α
≡
≤
=
+
−−−
2
1
CC
()]
.
α
+
()
1
6
2
σ
ser
2
µα α
α
α
α
ser ser
ser b
ser a
CC
C
ab xf xdx
KF R
F
b
(,,) (,)
()
(
(,)
(,)
==
=+
−
∫
1
aaU
bU R
aU R U
C
C
)
n
2
1
7l
+
+
−
()
α
α
σα α µα
α
α
ser ser
ser b
ser a
ser
ab x f xdx ab
22 2
(,,) (,) ( (,,))
(,)
(,)
=−
∫
==
=+
++
−
−
+
+
KFR
UaUR bUR baU
bU R
aU R
CC
CC
C
C
242 2
22
1
11
()
()()()
n
α
αα
α
l
αα
()
2
8,
σα σα
ser ser
ab ab(,,) (,,).=
()
2
9
Theoretical Biology and Medical Modelling 2005, 2:27 />Page 6 of 16
(page number not for citation purposes)
authors, G.M. Anderson, has had numerous publications
on the subject over the past several decades.
(ii) Coutinho et al. [40] have studied a large sample of sub-
jects and presented their 5-HT levels in histograms, also
explicitly listing their minimum and maximum values.
However, their reported mean 5-HT levels are somewhat
low, and the autistic 5-HT levels are higher than, but not
significantly different from, the normal 5-HT levels.
(iii) McBride et al. [74] is a detailed report on the means
and standard variations of platelet 5-HT levels in ethni-
cally different groups, but the data are not presented in
histogram form. Here, the minimum and maximum val-
ues of the distributions are recovered from their Figure 1,
and the pooled means of the pre-pubertal children are
recalculated from their Table 2.
It is important to note that these reports are the only ones
presently available and, therefore, no selection bias was
introduced by choosing them for the present study.
Finding α and [a, b] from clinical data
In order to be able to compare the model's predictions
with actual clinical reports, the numerical output of the
model has to be scaled to the units of the used experimen-
tal studies. This scaling can be done by adjusting the
parameter K in equation (3). The studies have reported
the following means of the blood 5-HT levels in their nor-
mal groups: 3.58 nmol/10
9
platelets [39], 260 ng/10
9
platelets [40], and 230 ng/ml [74]. The last number was
obtained by pooling the reported pre-pubertal means of
the three ethnic groups. Assuming the flux of free 5-HT to
the gut is around 210 ng/min in normal individuals
[48,53,70], it follows from equation (3) that
where < > denotes experimentally obtained means. Now
we can calculate the approximate K values for each of the
studies by dividing their reported mean 5-HT levels by the
approximate flux of free 5-HT to the gut. This yields the
following K values for the reports of Mulder et al. [39],
Coutinho et al. [40] and McBride et al. [74], respectively:
0.0170 (nmol min ng
-1
10
-9
platelets), 1.2381 (min 10
-9
platelets), and 1.0952 (min ml
-1
).
Next, we try to find such numerical values of [a, b],
α
normal
,
and
α
autistic
, that they minimize the difference between the
Table 1: Estimates of F
C
, R
C
, a, b,
α
normal
, and
α
autistic
, obtained by numerical minimization of the error function.
Data source KF
C
R
C
ab
α
normal
α
autistic
Mulder et al. [39] 0.0170 105 2000 0.8060 0.9612 0.1510 0.0000
Coutinho et al. [40] 1.2381 105 2000 0.7280 1.0000 0.0981 0.0000
McBride et al. [74] 1.0952 105 2000 0.8006 0.9678 0.0895 0.0000
Table 2: Predicted and observed ranges, means (<ser>), and standard deviations (SD) of platelet 5-HT levels, ser(
α
,
γ
). The distribution
of
γ
was assumed to be continuously uniform; the theoretical SD values given in the table can be further improved by assuming that
γ
has a beta distribution or a normal distribution (see the text). Note that, strictly speaking, the model's <ser > and SD are precise
theoretical expectations and standard deviations and, therefore, the notation
µ
ser
(
α
, a, b) and
σ
ser
(
α
, a, b) would be more accurate (but
less convenient here).
Mulder et al. [39] (nmol/10
9
platelets) Coutinho et al. [40] (ng/10
9
platelets) McBride et al. [74] (ng/ml)
Model Observed Model Observed Model Observed
Min
normal
1.42 0.67 0 66 75 85
Max
normal
5.57 5.67 598 676 417 449
<ser>
normal
3.66 3.58 320 260 252 230
SD
normal
1.19 1.08 172 137 99 -
Min
autistic
1.37 2.33 0 50 73 120
Max
autistic
8.18 8.33 925 1125 546 567
<ser>
autistic
4.58 4.51 414 304 294 287
SD
autistic
1.96 1.61 265 207 136 -
K
ser
F
ser
ng
=
<>
<− >
≈
<>
()
(,)
()
(,)
/min
,
αγ
γ
αγ
1210
10
Theoretical Biology and Medical Modelling 2005, 2:27 />Page 7 of 16
(page number not for citation purposes)
predicted and observed levels of blood 5-HT. Suppose
that the observed levels of blood 5-HT vary from Min
OBS
to Max
OBS
and that the observed mean of blood 5-HT is
<ser>
OBS
. The following error function can then be
constructed:
where
and i = normal, autistic.
Note that, compared with the mismatch between the pre-
dicted and observed ranges of the distributions, the mis-
match between the predicted and observed means is
penalized "twice as much", because observed means are
likely to be more accurate than observed minimal and
maximal values.
This error function was numerically minimized by using
the standard Nelder-Mead (downhill simplex) and differ-
ential evolution methods [75] implemented in Mathe-
matica's NMinimize function (Wolfram Research, Inc.).
Since the values of R
C
and F
C
may be approximated from
published studies but are not necessarily accurate, R
C
was
centered at 3000 ng/min based on a published estimate
[53] and was allowed to vary ± 33%, whereas the value of
F
C
was centered at 210 ng/min based on published esti-
mates [48,53,70] and was allowed to vary ± 50% (more
variation was allowed for F
C
because less is known about
its actual value). No constraints were set for the interval [a,
b] (i.e., 0 ≤ a <b ≤ 1). The variables
α
normal
and
α
autistic
were
allowed to vary from 0 to 5 and no a priori assumptions
were made about their relative values (i.e., both
α
normal
>
α
autistic
and
α
normal
≤
α
autistic
were allowed). It can be shown
that the system (equations (1) and (2)) is stable if
0≤
α
<F
C
(2 -
γ
)/[R
C
(1 -
γ
)]. Since the system should be sta-
ble for any γ ∈[a, b] and [a, b] is likely to contain the point
γ
≈ 0.99 [60] or
γ
≈ 0.93 [48], choosing
α
between 0 and
5 allows the optimization procedure to use virtually any
value of
α
where the system maintains stability.
The numerical values of the model's parameters (
α
normal
,
α
autistic
, [a, b], F
C
, and R
C
) that minimized the error func-
tion are given in Table 1. Note that all three clinical stud-
ies yielded similar sets of values. Most importantly, the
minimization algorithms yielded the best match between
the model and the clinical reports when
α
autistic
was virtu-
ally zero.
By plugging these obtained values of the parameters into
equations (12), (13), (14) and (9), one can obtain the val-
ues of 5-HT levels predicted by the model and compare
them with the actual observed levels. As shown in Table 2,
the predicted values closely match the values observed in
Mulder et al. [39] and McBride et al. [74]. The largest mis-
match was between the predicted and observed minimal
values. The model predicted slightly higher mean 5-HT
levels for Coutinho et al. [40] than were actually observed;
interestingly, Coutinho et al. [40] have in fact reported
unusually low platelet 5-HT levels.
Distribution of γ can be approximated by beta and normal
distributions
One advantage of choosing the uniform distribution to
represent
γ
is that it simplifies calculations and allows
finding the exact formulae for means and standard devia-
tions. However, the model tends to overestimate the
standard deviations of platelet 5-HT levels (Table 2),
because in the uniform distribution even extreme
γ
values
occur with same probability as all others. Instead of
approximating the distribution of
γ
as uniform, one may
want a distribution of which the probability density func-
tion drops off more smoothly near the minimal and
maximal values. This can be achieved by replacing the
uniform distribution of
γ
with the beta distribution, the
uniform distribution being its special case [76]. The fol-
lowing deals with mathematical technicalities of this
replacement. Non-mathematically inclined readers may
skip them and go immediately to Figures 4 and 5 referred
to at the end of this section.
Note that if the obtained parameter values (Table 1) are
plugged into equation (3), the normal and autistic plate-
let 5-HT levels turn out to depend on
γ
almost linearly
(Fig. 3). This allows "warping" the uniform distribution of
γ
into a symmetric beta distribution on the same interval,
with little effect on the theoretical mean values of ser(
α
,
γ
).
Suppose that
γ
has a symmetric beta distribution on [a, b],
whose shape is determined by the parameters m and n,
such that m = n (if m = n = 1, the beta distribution becomes
the uniform distribution). We can use a Taylor series to
formally linearize ser(
α
,
γ
) around
γ
0
= (a + b)/2 as ser(
α
,
γ
) ≈ ser(
α
,
γ
0
) -
λ
(
γ
-
γ
0
) ≡ serL(
α
,
γ
),
Then, keeping in mind that
γ
has a beta distribution, the
standard deviation of serL(
α
,
γ
) becomes
Err Min Min Max Max
i
OBS
i
MDL
inormalautistic
i
OBS
i
MDL
=−+−
=
∑
()( )
,
2222
411+< > −< >
()
(),ser ser
i
OBS
i
MDL
Min ser b
i
MDL
i
=
()
(,),
α
12
Max ser a
i
MDL
i
=
()
(,),
α
13
<>=
()
ser a b
i
MDL
ser i
µα
(,,), 14
where
λ
αγ
γ
α
αγ α
γγ
=
∂
∂
=
+
+−
=
ser
KF R
RFR
CC
CCC
(,)
()
(())
0
2
0
2
1
15
()
σα λ
serL
abm b a m(,,, ) ( )/ .=− +
()
84 16
Theoretical Biology and Medical Modelling 2005, 2:27 />Page 8 of 16
(page number not for citation purposes)
Since the values of
λ
, a, and b have already been estimated
(Table 1), it is now possible to obtain the m values that
yield such standard deviations of the linearized ser(
α
,
γ
)
that they precisely match those reported in the clinical
studies (Table 2). The following m values were obtained
for the normal and autistic groups, respectively: 1.2940
and 1.7028 for the data of Mulder et al. [39]; and 1.8308
and 1.8748 for the data of Coutinho et al. [40]. Pooled
standard variations were unavailable in McBride et al.
[74]. We have earlier assumed that normal and autistic
groups have the same
γ
distribution. Therefore, the actual
m values can be approximated by 1.50 for Mulder et al.
[39] and 1.85 for Coutinho et al. [40].
Likewise,
γ
can be assumed to have a normal distribution
with mean (a + b)/2 and standard deviation
σ
. Then the
standard deviation of serL(
α
,
γ
) becomes
σ
serL
(
α
, a, b,
σ
) =
λσ
, (17)
where
λ
is the same as in equation (15), and we obtain the
following
σ
values for the normal and autistic groups,
respectively: 0.0410 and 0.0370 for the data of Mulder et
al. [39]; and 0.0630 and 0.0624 for the data of Coutinho
et al. [40]. Therefore the actual
σ
values can be approxi-
mated by 0.04 for Mulder et al. [39] and 0.06 for
Coutinho et al. [40].
The model now easily generates "normal" and "autistic"
samples of platelet 5-HT levels that closely match the
actual reported data (Fig. 4). Most importantly, the switch
from the normal distribution to the autistic distribution
requires changing only one parameter,
α
.
It is not known what normal and autistic distributions
would look like if one could sample a very large number
of subjects. The model can predict the shape of these dis-
tributions by simulating such large sampling (Fig. 5).
Is the 5-HT synthesis rate altered in autism?
One of the most important questions in autism research is
whether the rate of 5-HT synthesis is altered in the brain
and gut of autistic individuals. If 5-HT synthesis is altered
in the autistic brain, as some studies have suggested [77-
79], this potentially may have a great impact on brain
development [80,81] (but caution should be exercised in
predicting the extent of these alterations [82]).
The brain 5-HT and the gut 5-HT are synthesized by two
different tryptophan hydroxylases [49] that, at least in
humans, have different properties and are regulated dif-
ferently [83]. While the biological factor underlying the
parameter
α
of the model is hypothesized to play a role in
the developing brain (Fig. 1), the model makes no
assumptions about its exact function in the brain. In the
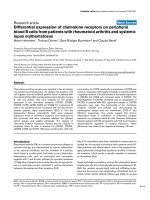
Platelet levels plotted with the parameter values derived from published studiesFigure 3
Platelet levels plotted with the parameter values
derived from published studies. Platelet 5-HT levels as
functions of
γ
for the data of Mulder et al. [39], Coutinho et
al. [40] and McBride et al. [74]. Equation (3) and the esti-
mated parameter values from Table 1 were used. The arrow-
heads mark the predicted intervals of the
γ
distributions
(Table 1). For comparison, the Y-axes were scaled propor-
tionally to the K values of the three studies (Table 1).
14
12
10
8
6
4
2
0.70
0.75
0.80
0.85
0.90
0.95
1.00
ser(α,γ), nmol/10
9
platelets
α = 0.0000
α = 0.1510
0.70
0.75 0.80
0.85
0.90
0.95
1.00
1000
800
600
400
200
ser(α,γ), ng/10
9
platelets
α = 0.0000
α = 0.0981
γ
Mulder et al., 2004
Coutinho et al., 2004
0.70
0.75 0.80
0.85
0.90
0.95
1.00
800
600
400
200
ser(α,γ), ng/ml
α = 0.0000
α = 0.0895
McBride et al., 1998
Theoretical Biology and Medical Modelling 2005, 2:27 />Page 9 of 16
(page number not for citation purposes)
brain, it may not regulate 5-HT release from serotonergic
neurons and may have a different function (see, for
example, Figure 4 of [48]). Therefore, this section focuses
only on the 5-HT synthesis and release in the gut.
It is important to note that the model says nothing about
the rate of 5-HT synthesis in the gut and rather deals with
the rate of 5-HT release from the gut. However, most clin-
ical and experimental studies make no such distinction
and, therefore, their relevance to the model is discussed
assuming higher 5-HT synthesis rates do lead to higher 5-
HT release rates.
It follows from equations (3) and (4) that, at the steady
state,
and that this relationship is independent of
γ
. This means
that if one were to sample any group of individuals and
could measure their platelet 5-HT levels and gut 5-HT
release rates precisely, the correlation coefficient between
these two variables would always be minus one, irrespec-
tive of the distribution of
γ
. In other words, equation (18)
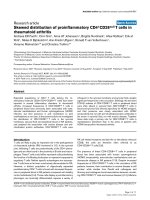
Model replicates published dataFigure 4
Model replicates published data. A, B, The model's simulation of Mulder et al.'s sampling [39], assuming
γ
has the beta dis-
tribution on the interval [0.8060, 0.9612] with both shape parameters equal to 1.5. The platelet 5-HT levels were calculated by
using equation (3), with the values of K, F
C
, R
C
,
α
normal
and
α
autistic
taken from Table 1. C, D, The actual data from Mulder et al.
[39] (reprinted by permission from Lippincott Williams & Wilkins, modified). In the simulated and actual sampling, 60 normal
and 33 autistic subjects were used. Note that the exact appearance of the histograms will vary from sampling to sampling due
to the small number of cases in each bin.
10
8
6
4
2
1
23
4
5
67
8
9
10
3
2
1
1
23
4
5
67
8
9
10
4
5
10
8
6
4
2
1
23
4
5
67
8
9
10
3
2
1
1
23
4
5
67
8
9
10
4
5
5-HT, nmol/10
9
platelets 5-HT, nmol/10
9
platelets
MODEL
MULDER ET AL., 2004
α = 0.1510
α = 0.0000
normal
autistic
# individuals# individuals
A
B
C
D
ser
KF
R
RKF
C
C
C
(,) ,
αγ
α
α
α
=− +
+
()
1
18
Theoretical Biology and Medical Modelling 2005, 2:27 />Page 10 of 16
(page number not for citation purposes)
predicts that individuals with higher platelet 5-HT levels
should have lower 5-HT release rates.
How can lower 5-HT release rates lead to higher platelet 5-
HT levels? Note that, in the model, both the platelet 5-HT
levels and the 5-HT release rate are dynamically linked
through the 5-HT clearance rate,
γ
. As
γ
grows lower, less
5-HT is removed from the system and more of 5-HT is
accumulated in blood platelets. At the same time, these
higher 5-HT levels drive down the 5-HT release rate in the
gut, as required by equation (1).
Still, it appears that the results of clinical studies are
inconsistent with equation (18). Three important findings
should be noted:
(i) Minderaa et al. [36] have found no significant correla-
tion between whole blood 5-HT levels and 5-HT synthesis
in the gut, measured as the production of urinary 5-HIAA
Model predicts the shape of the normal and autistic distributions of platelet 5-HT levelsFigure 5
Model predicts the shape of the normal and autistic distributions of platelet 5-HT levels. Histograms obtained by
simulating a sampling of a very large number of normal and autistic individuals (a million subjects in each group). The distribu-
tion of
γ
was assumed to be (A, B) the beta distribution on the interval [0.8060; 0.9612] with both shape parameters equal to
1.5 (see the text); or (C, D) the normal (Gaussian) distribution with mean 0.8836 (the midpoint of the interval [0.8060;
0.9612]) and standard deviation 0.04 (see the text). The platelet 5-HT levels were calculated by using equation (3), with the val-
ues of K, F
C
, R
C
,
α
normal
and
α
autistic
taken from Table 1. In a very large sampling, the number of cases in each histogram bin closely
approximates the number of cases predicted by the exact probability distribution functions. The Chi-square test confirmed
that the normal and autistic distributions predicted by the model may underlie the distributions reported by Mulder et al.
(2004). The following goodness-of-fit results were obtained: = 12.38 (P = 0.26) and = 11.29 (P = 0.19) for the normal
and autistic groups, respectively, if
γ
had the beta distribution; and = 13.36 (P = 0.27) and = 12.21 (P = 0.14) for the
normal and autistic groups, respectively, if
γ
had the normal distribution (bins were pooled if theoretical bins had fewer than 3
cases). It is important that both the normal and autistic distributions had the same underlying distribution of
γ
and that only
one parameter,
α
, was needed to switch from the normal distribution to the autistic distribution. Also, compare the histo-
grams in C and D, based on the data of Mulder et al. [39], with those in Figure 1 of Coutinho et al. [40].
# individuals
α = 0.1510
("normal")
α = 0.1510
("normal")
γ : Beta
γ : Normal
A
C
5-HT, nmol/10
9
platelets
5-HT, nmol/10
9
platelets
# individuals
α = 0.0000
("autistic")
α = 0.0000
("autistic")
BD
12 34 567 8910
20000
40000
60000
12 34 567 8910
20000
40000
60000
12 34 567 8910
20000
40000
60000
80000
100000
120000
12 34 567 8910
20000
40000
60000
80000
100000
120000
χ
10
2
χ
8
2
χ
11
2
χ
8
2
Theoretical Biology and Medical Modelling 2005, 2:27 />Page 11 of 16
(page number not for citation purposes)
[36]. Similar results have been obtained by Launay et al.
[84] and other groups (reviewed in [31]).
(ii) Croonenberghs et al. [85] have shown that the 5-HT
synthesis in the gut of autistic individuals may be higher
than that in normal individuals, at least when subjects are
administered 5-hydroxytryptophan (5-HTP), an immedi-
ate precursor of 5-HT.
(iii) Carcinoid tumors, derived from gut EC cells, may
result in excessive synthesis and release of 5-HT, which in
turn may lead to elevated platelet 5-HT levels [86].
A more careful analysis reveals that these findings are not
only consistent with the model, but that the model can
reconcile some of the apparent contradictions among
them:
(i) It follows from the model that the measured correla-
tion between platelet 5-HT levels and 5-HT release rates
should be close to zero in autistic groups, even though
equation (18) holds.
In fact, we can rewrite equation (18) as
Now consider two random variables,
η
and
ξ
, that are lin-
early dependent such that
η
= w
ξ
+ q, (20)
where w and q are constants. It follows from equation
(20) that the correlation between them is either -1 or 1,
depending on the sign of w.
Denote the means of these variables
µ
η
and
µ
ξ
, respec-
tively, and their standard deviations
σ
η
and
σ
ξ
, respec-
tively. Suppose next that the errors of measurement of
η
and
ξ
are independent random variables
ε
η
and
ε
ξ
, such
that their expected values are zero and standard deviations
are
δ
η
and
δ
ξ
, respectively. Note that experimentally we
can measure only
η
* =
η
+
ε
η
and
ξ
* =
ξ
+
ε
ξ
. The expected
values of
η
* and
ξ
* are the same as those of
η
and
ξ
. How-
ever, the theoretical correlation coefficient between
η
*
and
ξ
* now becomes
If the standard deviations of the errors of measurement
are small, we obtain
ρ
(
η
*,
ξ
*) ≈ ± 1, as expected from
equation (20).
Now we return to equation (19). Any experimental meas-
urement of R (5-HT release) and ser(
α
,
γ
) (platelet 5-HT
levels) will contain a measurement error. Denoting these
measured values ser*(
α
,
γ
) and R*, one obtains from
equations (19), (20), and (21) that the correlation coeffi-
cient between R* and ser*(
α
,
γ
) is
where
w = -(
α
R
C
)/(KF
C
), (23)
σ
ser
> 0 is the standard deviation of ser(
α
,
γ
), and δ
R
> 0 and
δ
ser
> 0 are the standard deviations of the errors of meas-
urement of R and ser(
α
,
γ
), respectively. The estimated val-
ues of K, F
C
, R
C
, and
α
can be obtained from Table 1 and
the values of
σ
ser
from Table 2 or from the original pub-
lished data.
Consider now an autistic group whose
α
→ 0 (Table 1).
Then, from equation (23), w → 0, and it follows from
equation (22) that .
(ii) Croonenberghs et al. [85] have recently shown that
oral administration of 5-hydroxytryptophan (5-HTP)
leads to higher platelet 5-HT levels in autistic patients, and
the authors have suggested that the 5-HT synthesis rate
may be higher in the gut of autistic subjects compared
with normal subjects.
Suppose that the administered 5-HTP is converted to 5-
HT at the same rate in both normal and autistic groups. It
is likely that the exogenous influx of 5-HTP results in a
comparable exogenous influx of 5-HT, because the rate-
limiting step in the synthesis of 5-HT is not the 5-HTP
conversion to 5-HT, but rather the tryptophan conversion
to 5-HTP [87].
Notice that the system is not in its steady state during the
experiment and, therefore, we have to use equations (1)
and (2), which now should contain the exogenous source
of 5-HT. It is straightforward to see that the system then
becomes
F
n + 1
= (1 -
γ
)F
n
+ R
n + 1
+ R
EX
, (25)
where R
EX
is the exogenous flux of 5-HT.
R
R
KF
ser R
C
C
C
=− + +
()
α
αγ α
(,) ( ).119
ρη ξ
σ
σδ σδ
ξ
ξξ ξη
(*,*)
()( )
=
++
()
w
w
2
22222
21
ραγ
σ
σδ σδ
(*, *( ,))
()( )
,Rser
w
w
ser
ser ser ser R
=
++
()
2
22222
22
lim ( *, *( , ))
w
Rser
→
=
0
0
ραγ
RR
R
FF
F
nC
C
Cn
C
+
−
=
−−
()
1
1
24
α
γ
()
,
Theoretical Biology and Medical Modelling 2005, 2:27 />Page 12 of 16
(page number not for citation purposes)
Solving equations (24) and (25) step-by-step essentially
replicates the major finding of Croonenberghs et al. [85]
(Fig. 6). However, the model predicts that the higher
blood 5-HT levels in autistic subjects are not due to a
higher 5-HT synthesis rate, but rather to the failure of their
gut to decrease the release of endogenous 5-HT in
response to the high concentration of 5-HT caused by the
administration of 5-HTP.
(iii) In the case of carcinoid tumors, abnormally large
amounts of 5-HT may be released into the blood. It is
likely that the normal mechanisms regulating 5-HT
release are compromised or absent in carcinoid tumors.
Then instead of equations (1) and (2) one can consider
only one equation (2), which can be rewritten as
F
n + 1
= (1 -
γ
)F
n
+ R
CARCINOID
, (26)
where R
CARCINOID
is large and relatively constant. Then, at
the steady state,
F = R
CARCINOID
/
γ
and
It is obvious that in this abnormal case higher 5-HT
release rates will lead to higher platelet 5-HT levels, as
reported by Kema et al. [86].
Discussion
The presented model is based on the hypothesis that at
least one factor that interferes with normal brain develop-
ment in autism also participates in the regulation of 5-HT
release from enterochromaffin cells. When applied to the
data of three published studies, the model predicts that
this factor is virtually non-functional in autistic individu-
als (Table 1).
An exogenous source of 5-HT elevates platelet 5-HT levels in an autistic group more than in a normal groupFigure 6
An exogenous source of 5-HT elevates platelet 5-HT levels in an autistic group more than in a normal group.
For the simulation, the initial values of platelet 5-HT levels (ser(
α
,
γ
)) and 5-HT release rate (R) were set at zero and the system
developed according to equations (1) and (2). After the system reached its steady state, an exogenous 5-HT source was
"turned on" (+R
EX
) and the system developed according to equations (24) and (25). After 5 steps, the exogenous 5-HT source
was "turned off" (-R
EX
) and the system developed according to equations (1) and (2) until it returned to its steady state. Each
point is the mean of 10,000 simulated individuals whose
γ
had the beta distribution on the interval [0.8060, 0.9612] (see Table
1) with both shape parameters equal to 1.5 (see the text). Individual plots (not shown) looked essentially the same as the mean
plots. The ratio between the autistic and normal platelet 5-HT levels (A) at step 7 (at the steady state) is 1.25 and the same
ratio at step 13 is 1.35. The numerical values of the parameters were K = 0.0170, F
C
= 105, R
C
= 2000,
α
normal
= 0.1510,
α
autistic
=
0.0000 (Table 1) and R
EX
= 4000. Compare these plots with Figure 1 of Croonenberghs et al. [85].
A
5
10 15
20
25 30
2
4
6
8
10
12
14
1
0
B
5
10 15
20
25 30
1
1000
2000
3000
4000
5000
ser(α,γ)
R
STEP # STEP #
0 0
+R
ex
-R
ex
+R
ex
-R
ex
α=0.1510
α=0.0000
“normal”
“autistic”
α=0.1510
α=0.0000
“normal”
“autistic”
ser K F KR
CARCINOID
(,) ( ) .
αγ γ
γ
γ
=−≈
−
()
1
1
27
Theoretical Biology and Medical Modelling 2005, 2:27 />Page 13 of 16
(page number not for citation purposes)
Before the biological nature of this factor is discussed, it
should be noted that the parameter values obtained for
each of the three published studies were virtually the same
(Table 1). This underlying consistency of the data is not
trivial, since Mulder et al. [39] have suggested that their
autistic distribution may be bimodal and thus
qualitatively different from the control (normal) distribu-
tion, whereas Coutinho et al. [40] have reported a clearly
unimodal autistic distribution that so overlapped with the
control distribution that their means were not statistically
significant. It should also be noted that initially
γ
was
allowed to vary from zero to one, but the numerical opti-
mization based on the published data narrowed this
range down to approximately 0.8 – 1.0 (Table 1). This
agrees well with actual experimental data. An early study
has approximated the dog's
γ
as 0.99 and shown that the
5-HT clearance by the lungs varies from 0.80 to 0.98 [60].
The mean human
γ
may be somewhat smaller, because
the rate of 5-HT release by gut enterochromaffin cells has
been predicted to be around 3000 ng/min [53] and the
arterial flow of free 5-HT has been estimated to be around
210 ng/min [48,53,70]. This suggests that, in humans,
approximately 93% of free 5-HT is cleared in one circula-
tion and, therefore, the value of
γ
is close to 0.93. The
model predicted similar
γ
distributions in normal and
autistic groups, supporting the hypothesis that the fre-
quencies of SERT and MAO polymorphisms in normal
and autistic groups may be the same.
The most significant result is that the factor that regulates
5-HT release from EC cells (represented by the parameter
α
) appears to be virtually non-functional in autistic indi-
viduals (Table 1). What is the biological nature of
α
? Evi-
dence suggests that EC cells may express 5-HT
3
, 5-HT
4
and
5-HT
1A
receptors [55,88-90] and that they may also
express 5-HT
2
receptors [89]. Some of these receptors
appear to be involved in the autoregulation of 5-HT
release [89,90]. While one report has failed to find 5-HT
3
and 5-HT
4
receptor mRNAs in cultured EC cells [91], the
regulation of 5-HT release from EC cells may also be indi-
rect, by way of enteric neurons. These neurons are known
to express various 5-HT receptors [54,55,92,93] and can
control 5-HT release from EC cells by acting on their
cholinergic and other receptors [88,94-96].
The model is based on a negative feedback loop. It has
been shown that such negative feedback may be mediated
by 5-HT
4
receptors expressed by EC cells and that this neg-
ative feedback appears to dominate over the positive feed-
back mediated by 5-HT
3
receptors [89,90]. A recent study
has suggested that under normal circumstances (as
opposed to conditions such as carcinoid tumors) the con-
centration of endogenous 5-HT may not be high enough
to activate 5-HT
4
receptors and alter the 5-HT release from
EC cells [89]. At least superficially, this mirrors recent
findings in the brain, where 5-HT
1A
and 5-HT
1B
receptors,
long assumed to act as autoreceptors, may not actually be
activated by extracellular 5-HT unless its concentration
reaches excessive levels [51]. Since precise measurements
of 5-HT release in the gut and the brain are difficult, it is
more likely that these receptors do control 5-HT release
under normal circumstances, but that their effect on 5-HT
release is more subtle than we expect. The model's small
value of
α
appears to predict such subtle regulation.
Can 5-HT
4
receptors be involved in autism? One agonist
used to study the effects of 5-HT
4
receptors on the 5-HT
release from EC cells has been 5-methoxytryptamine (5-
MT) [89,90], which has high affinity for these receptors
[57]. While 5-MT has been reported to inhibit the 5-HT
release from EC cells, subcutaneous 5-MT injections in
pregnant rats produces pups with autistic-like symptoms
[97] and subcutaneous 5-MT injections in pregnant mice
may lead to an autistic-like disruption of cortical columns
in the pups [11,81]. Normal brain development may be
altered if brain 5-HT
4
receptors are compromised, because
these receptors appear to be expressed in the marginal
zone of the adult human brain [98] and, therefore, may
also be expressed in Cajal-Retzius cells of the developing
brain. It has been recently shown that an abnormal sero-
tonergic input to Cajal-Retzius cells during development
may lead to autistic-like cortical abnormalities [81]. Inter-
estingly, the expression of the 5-HT
4
receptor is very low
in the cerebral cortex of the guinea pig [99], suggesting
that this receptor may play a specific role in the primate
brain. Generally, we are only beginning to understand the
role of the 5-HT
4
in brain development, because the
human 5-HT
4
receptor gene consists of at least 38 exons
and at least eight C-terminal splice variants of the human
5-HT
4
receptor have been described [57].
Other 5-HT receptors, as well as other mechanisms, may
be involved both in the regulation of 5-HT release from
the gut and in brain development. For example, 5-HT
1A
and 5-HT
2
receptors have been implicated in autism
[31,100-102]. As already discussed, these receptors can
also regulate the 5-HT release from EC cells. Moreover, 5-
MT is a rather non-specific 5-HT receptor agonist [103]
and appears to be co-localized with 5-HT in most brain
neurons [104]. Therefore, some of its effects may be
produced by its acting on a few types of 5-HT receptors at
the same time, both in the gut and the brain.
The model assumes that the 5-HT clearance rate (
γ
) and
the gain of 5-HT release (
α
) are independent. Generally,
the expression of neurotransmitter receptors or their sen-
sitivity can dynamically change depending on the availa-
bility of the neurotransmitter. For example, gut 5-HT
3
receptors undergo structural and functional changes in
SERT-knockout mice [105] and 5-HT
1A
receptors in the
Theoretical Biology and Medical Modelling 2005, 2:27 />Page 14 of 16
(page number not for citation purposes)
human brain have different affinities in individuals with
different SERT polymorphic variants [106]. These and
other related findings are likely to become indispensable
for understanding the platelet hyperserotonemia of
autism; unfortunately, too little information is currently
available for quantitative modeling of these relationships.
Intriguingly,
α
may be represented by biological mecha-
nisms other than 5-HT receptors. For example, adenosine
and ATP may modulate the 5-HT release from human EC
cells [107,108] and ATP also activates microglia in the
brain [109]. A study, called by some researchers "the most
important postmortem study of autism to date" [110], has
found an abnormal activation of microglia in autistic
brains [111].
It should be noted in conclusion that the mathematical
framework of the model allows it to be modified so that it
no longer depends on free 5-HT in the blood. In fact, one
could conceivably build a model where 5-HT is released
by EC cells, cleared by SERT-expressing cells locally, and
where the remaining extracellular 5-HT acts on the mech-
anisms controlling 5-HT release from EC cells, without
leaving the gut. Assuming
γ
now denotes the local clear-
ance and
α
is the gain of the 5-HT release, one again may
arrive at a system of equations similar to equations (1)
and (2).
Conclusion
The origin of autism is as much a conceptual problem as
it is experimental. The theoretical approach introduced
here brings together information on the "central" and
"peripheral" 5-HT and offers new insights into early
abnormalities of the developing autistic brain that may
otherwise escape direct experimental detection.
Methods
All symbolic and numerical calculations were done in
Mathematica 5.0.0, 5.0.1, 5.1.0, or 5.1.1 (Wolfram
Research, Inc.). Where the numerical minimization of the
error function produced different sets of numerical values
in different releases of Mathematica, the values that
yielded the smallest error were used (for the purpose of
this study, Mathematica 5.1.1 was superior to the earlier
releases). The figures were generated in Mathematica and
prepared for publication in Adobe Illustrator 10 or CS
(Adobe Systems, Inc.).
Competing interests
The author(s) declare that they have no competing
interests.
Authors' contributions
SJ conceived of and carried out the presented study.
Acknowledgements
I thank Dr. P. Rakic and the National Alliance for Autism Research (NAAR)
for their financial support, the anonymous reviewers for their valuable sug-
gestions, and Dr. G.M. Anderson, Dr. A.E. Ayoub and Michael Fischer for
their comments on the revised manuscript. I also thank Vaiva, my
inspiration.
References
1. Williams RS, Hauser SL, Purpura DP, DeLong GR, Swisher CN:
Autism and mental retardation: neuropathologic studies
performed in four retarded persons with autistic behavior.
Arch Neurol 1980, 37:749-753.
2. Ritvo ER, Freeman BJ, Scheibel AB, Duong T, Robinson H, Guthrie D,
Ritvo A: Lower Purkinje cell counts in the cerebella of four
autistic subjects: initial findings of the UCLA-NSAC Autopsy
Research Report. Am J Psychiatry 1986, 143:862-866.
3. Kern JK: Purkinje cell vulnerability and autism: a possible eti-
ological connection. Brain Dev 2003, 25:377-382.
4. Woodhouse W, Bailey A, Rutter M, Bolton P, Baird G, Le CA: Head
circumference in autism and other pervasive developmental
disorders. J Child Psychol Psychiatry 1996, 37:665-671.
5. Courchesne E, Karns CM, Davis HR, Ziccardi R, Carper RA, Tigue
ZD, Chisum HJ, Moses P, Pierce K, Lord C, Lincoln AJ, Pizzo S, Sch-
reibman L, Haas RH, Akshoomoff NA, Courchesne RY: Unusual
brain growth patterns in early life in patients with autistic
disorder: an MRI study. Neurology 2001, 57:245-254.
6. Aylward EH, Minshew NJ, Field K, Sparks BF, Singh N: Effects of age
on brain volume and head circumference in autism. Neurology
2002, 59:175-183.
7. Courchesne E, Carper R, Akshoomoff N: Evidence of brain over-
growth in the first year of life in autism. JAMA 2003,
290:337-344.
8. Carper RA, Moses P, Tigue ZD, Courchesne E: Cerebral lobes in
autism: early hyperplasia and abnormal age effects. Neuroim-
age 2002, 16:1038-1051.
9. Carper RA, Courchesne E: Inverse correlation between frontal
lobe and cerebellum sizes in children with autism. Brain 2000,
123 ( Pt 4):836-844.
10. Casanova MF, Buxhoeveden DP, Brown C: Clinical and macro-
scopic correlates of minicolumnar pathology in autism. J
Child Neurol 2002, 17:692-695.
11. Casanova MF, Buxhoeveden DP, Switala AE, Roy E: Minicolumnar
pathology in autism. Neurology 2002, 58:428-432.
12. Casanova MF, Buxhoeveden D, Gomez J: Disruption in the inhibi-
tory architecture of the cell minicolumn: implications for
autisim. Neuroscientist 2003, 9:496-507.
13. Casanova MF: White matter volume increase and minicol-
umns in autism. Ann Neurol 2004, 56:453.
14. Raymond GV, Bauman ML, Kemper TL: Hippocampus in autism:
a Golgi analysis. Acta Neuropathol (Berl) 1996, 91:117-119.
15. Blatt GJ, Fitzgerald CM, Guptill JT, Booker AB, Kemper TL, Bauman
ML: Density and distribution of hippocampal neurotransmit-
ter receptors in autism: an autoradiographic study. J Autism
Dev Disord 2001, 31:537-543.
16. Kemper TL, Bauman ML: Neuropathology of infantile autism.
Mol Psychiatry 2002, 7 Suppl 2:S12-S13.
17. Amaral DG, Bauman MD, Schumann CM: The amygdala and
autism: implications from non-human primate studies. Genes
Brain Behav 2003, 2:295-302.
18. Bauman M, Kemper TL: Histoanatomic observations of the
brain in early infantile autism. Neurology 1985, 35:866-874.
19. Schumann CM, Hamstra J, Goodlin-Jones BL, Lotspeich LJ, Kwon H,
Buonocore MH, Lammers CR, Reiss AL, Amaral DG: The amygdala
is enlarged in children but not adolescents with autism; the
hippocampus is enlarged at all ages. J Neurosci 2004,
24:6392-6401.
20. Rodier PM, Ingram JL, Tisdale B, Nelson S, Romano J: Embryologi-
cal origin for autism: developmental anomalies of the cranial
nerve motor nuclei. J Comp Neurol 1996, 370:247-261.
21. Rodier PM: Converging evidence for brain stem injury in
autism. Dev Psychopathol 2002, 14:537-557.
22. Rodier PM: The early origins of autism. Sci Am 2000, 282:56-63.
Theoretical Biology and Medical Modelling 2005, 2:27 />Page 15 of 16
(page number not for citation purposes)
23. Belmonte MK, Allen G, Beckel-Mitchener A, Boulanger LM, Carper
RA, Webb SJ: Autism and abnormal development of brain
connectivity. J Neurosci 2004, 24:9228-9231.
24. Palmen SJ, Van EH, Hof PR, Schmitz C: Neuropathological findings
in autism. Brain 2004.
25. Courchesne E, Redcay E, Kennedy DP: The autistic brain: birth
through adulthood. Curr Opin Neurol 2004, 17:489-496.
26. Chugani DC: Serotonin in autism and pediatric epilepsies.
Ment Retard Dev Disabil Res Rev 2004, 10:112-116.
27. Duchala CS, Shick HE, Garcia J, Deweese DM, Sun X, Stewart VJ,
Macklin WB: The toppler mouse: A novel mutant exhibiting
loss of Purkinje cells. J Comp Neurol 2004, 476:113-129.
28. Schain RJ, Freedman DX: Studies on 5-hydroxyindole metabo-
lism in autistic and other mentally retarded children. J Pediatr
1961, 58:315-320.
29. Hanley HG, Stahl SM, Freedman DX: Hyperserotonemia and
amine metabolites in autistic and retarded children. Arch Gen
Psychiatry 1977, 34:521-531.
30. Anderson GM, Freedman DX, Cohen DJ, Volkmar FR, Hoder EL,
McPhedran P, Minderaa RB, Hansen CR, Young JG: Whole blood
serotonin in autistic and normal subjects. J Child Psychol
Psychiatry 1987, 28:885-900.
31. Anderson GM, Horne WC, Chatterjee D, Cohen DJ: The hyperse-
rotonemia of autism. Ann N Y Acad Sci 1990, 600:331-340.
32. Cook EHJ: Brief report: pathophysiology of autism:
neurochemistry. J Autism Dev Disord 1996, 26:221-225.
33. Anderson GM: Genetics of childhood disorders: XLV. Autism,
part 4: serotonin in autism. J Am Acad Child Adolesc Psychiatry
2002, 41:1513-1516.
34. Wenzel D, Felgenhauer K: The development of the blood-CSF
barrier after birth. Neuropadiatrie 1976, 7:175-181.
35. Virgintino D, Errede M, Robertson D, Capobianco C, Girolamo F,
Vimercati A, Bertossi M, Roncali L: Immunolocalization of tight
junction proteins in the adult and developing human brain.
Histochem Cell Biol 2004, 122:51-59.
36. Minderaa RB, Anderson GM, Volkmar FR, Akkerhuis GW, Cohen DJ:
Urinary 5-hydroxyindoleacetic acid and whole blood serot-
onin and tryptophan in autistic and normal subjects. Biol
Psychiatry 1987, 22:933-940.
37. Baker GR, Sullam PM, Levin J: A simple, fluorescent method to
internally label platelets suitable for physiological
measurements. Am J Hematol 1997, 56:17-25.
38. Heyssel RM: Determination of human platelet survival utiliz-
ing C-14-labeled serotonin. J Clin Invest 1961, 40:2134-2142.
39. Mulder EJ, Anderson GM, Kema IP, De BA, Van Lang ND, Den Boer
JA, Minderaa RB: Platelet Serotonin Levels in Pervasive Devel-
opmental Disorders and Mental Retardation: Diagnostic
Group Differences, Within-Group Distribution, and Behav-
ioral Correlates. J Am Acad Child Adolesc Psychiatry 2004,
43:491-499.
40. Coutinho AM, Oliveira G, Morgadinho T, Fesel C, Macedo TR, Bento
C, Marques C, Ataide A, Miguel T, Borges L, Vicente AM: Variants
of the serotonin transporter gene (SLC6A4) significantly
contribute to hyperserotonemia in autism. Mol Psychiatry 2004,
9:264-271.
41. Lesch KP, Wolozin BL, Murphy DL, Reiderer P: Primary structure
of the human platelet serotonin uptake site: identity with the
brain serotonin transporter. J Neurochem 1993, 60:2319-2322.
42. Cook EHJ, Courchesne R, Lord C, Cox NJ, Yan S, Lincoln A, Haas R,
Courchesne E, Leventhal BL: Evidence of linkage between the
serotonin transporter and autistic disorder. Mol Psychiatry
1997, 2:247-250.
43. Spielman RS, Ewens WJ: The TDT and other family-based tests
for linkage disequilibrium and association. Am J Hum Genet
1996, 59:983-989.
44. McCauley JL, Olson LM, Dowd M, Amin T, Steele A, Blakely RD, Fol-
stein SE, Haines JL, Sutcliffe JS: Linkage and association analysis
at the serotonin transporter (SLC6A4) locus in a rigid-com-
pulsive subset of autism. Am J Med Genet 2004, 127B:104-112.
45. Persico AM, Militerni R, Bravaccio C, Schneider C, Melmed R, Conci-
atori M, Damiani V, Baldi A, Keller F: Lack of association between
serotonin transporter gene promoter variants and autistic
disorder in two ethnically distinct samples. Am J Med Genet
2000, 96:123-127.
46. Betancur C, Corbex M, Spielewoy C, Philippe A, Laplanche JL, Launay
JM, Gillberg C, Mouren-Simeoni MC, Hamon M, Giros B, Nosten-Ber-
trand M, Leboyer M: Serotonin transporter gene polymor-
phisms and hyperserotonemia in autistic disorder. Mol
Psychiatry 2002, 7:67-71.
47. Wu S, Guo Y, Jia M, Ruan Y, Shuang M, Liu J, Gong X, Zhang Y, Yang
J, Yang X, Zhang D: Lack of evidence for association between
the serotonin transporter gene (SLC6A4) polymorphisms
and autism in the Chinese trios. Neurosci Lett 2005, 381:1-5.
48. Janusonis S: Serotonergic paradoxes of autism replicated in a
simple mathematical model. Med Hypotheses 2005, 64:742-750.
49. Walther DJ, Peter JU, Bashammakh S, Hortnagl H, Voits M, Fink H,
Bader M: Synthesis of serotonin by a second tryptophan
hydroxylase isoform. Science 2003, 299:76.
50. Gershon MD: Review article: serotonin receptors and trans-
porters roles in normal and abnormal gastrointestinal
motility. Aliment Pharmacol Ther 2004, 20 Suppl 7:3-14.
51. Adell A, Celada P, Abellan MT, Artigas F: Origin and functional
role of the extracellular serotonin in the midbrain raphe
nuclei. Brain Res Brain Res Rev 2002, 39:154-180.
52. Jacobs BL, Azmitia EC: Structure and function of the brain sero-
tonin system. Physiol Rev 1992, 72:165-229.
53. Anderson GM, Stevenson JM, Cohen DJ: Steady-state model for
plasma free and platelet serotonin in man. Life Sci 1987,
41:1777-1785.
54. Gershon MD: Plasticity in serotonin control mechanisms in
the gut. Curr Opin Pharmacol 2003, 3:600-607.
55. Kirchgessner AL, Liu MT, Raymond JR, Gershon MD: Identification
of cells that express 5-hydroxytryptamine1A receptors in
the nervous systems of the bowel and pancreas. J Comp Neurol
1996, 364:439-455.
56. Costall B, Naylor RJ: 5-HT3 receptors. Curr Drug Targets CNS Neu-
rol Disord 2004, 3:27-37.
57. Bockaert J, Claeysen S, Compan V, Dumuis A: 5-HT4 receptors.
Curr Drug Targets CNS Neurol Disord 2004, 3:39-51.
58. Ramamoorthy S, Bauman AL, Moore KR, Han H, Yang-Feng T, Chang
AS, Ganapathy V, Blakely RD: Antidepressant- and cocaine-sen-
sitive human serotonin transporter: molecular cloning,
expression, and chromosomal localization. Proc Natl Acad Sci U
S A 1993, 90:2542-2546.
59. Billett EE: Monoamine oxidase (MAO) in human peripheral
tissues. Neurotoxicology 2004, 25:139-148.
60. Thomas DP, Vane JR: 5-hydroxytryptamine in the circulation of
the dog. Nature 1967, 216:335-338.
61. Shiue GG, Choi SR, Fang P, Hou C, Acton PD, Cardi C, Saffer JR,
Greenberg JH, Karp JS, Kung HF, Shiue CY: N,N-dimethyl-2-(2-
amino-4-(18)F-fluorophenylthio)-benzylamine (4-(18)F-
ADAM): an improved PET radioligand for serotonin
transporters. J Nucl Med 2003, 44:1890-1897.
62. Lin KJ, Ye XX, Yen TC, Wey SP, Tzen KY, Ting G, Hwang JJ: Biodis-
tribution study of [(123)I] ADAM in mice: correlation with
whole body autoradiography. Nucl Med Biol 2002, 29:643-650.
63. Cohen IL, Liu X, Schutz C, White BN, Jenkins EC, Brown WT, Holden
JJ: Association of autism severity with a monoamine oxidase
A functional polymorphism. Clin Genet 2003, 64:190-197.
64. Jones MB, Palmour RM, Zwaigenbaum L, Szatmari P: Modifier
effects in autism at the MAO-A and DBH loci. Am J Med Genet
2004, 126B:58-65.
65. Filic V, Vladic A, Stefulj J, Cicin-Sain L, Balija M, Sucic Z, Jernej B:
Monoamine oxidases A and B gene polymorphisms in
migraine patients. J Neurol Sci 2005, 228:149-153.
66. Soeby K, Larsen SA, Olsen L, Rasmussen HB, Werge T: Serotonin
transporter: Evolution and impact of polymorphic transcrip-
tional regulation. Am J Med Genet B Neuropsychiatr Genet 2005.
67. Chen JX, Pan H, Rothman TP, Wade PR, Gershon MD: Guinea pig
5-HT transporter: cloning, expression, distribution, and
function in intestinal sensory reception. Am J Physiol 1998,
275:G433-G448.
68. Grundy D, Schemann M: Serotonin in the gut: pretty when it
gets down to the nitty gritty. Neurogastroenterol Motil 2004,
16:507-509.
69. Cash S, Yuste R: Linear summation of excitatory inputs by
CA1 pyramidal neurons. Neuron 1999, 22:383-394.
70. Beck O, Wallen NH, Broijersen A, Larsson PT, Hjemdahl P: On the
accurate determination of serotonin in human plasma. Bio-
chem Biophys Res Commun 1993, 196:260-266.
Theoretical Biology and Medical Modelling 2005, 2:27 />Page 16 of 16
(page number not for citation purposes)
71. Anderson GM, Feibel FC, Cohen DJ: Determination of serotonin
in whole blood, platelet-rich plasma, platelet-poor plasma
and plasma ultrafiltrate. Life Sci 1987, 40:1063-1070.
72. Chen JJ, Li Z, Pan H, Murphy DL, Tamir H, Koepsell H, Gershon MD:
Maintenance of serotonin in the intestinal mucosa and gan-
glia of mice that lack the high-affinity serotonin transporter:
Abnormal intestinal motility and the expression of cation
transporters. J Neurosci 2001, 21:6348-6361.
73. Anderson GM, Gutknecht L, Cohen DJ, Brailly-Tabard S, Cohen JH,
Ferrari P, Roubertoux PL, Tordjman S: Serotonin transporter
promoter variants in autism: functional effects and relation-
ship to platelet hyperserotonemia. Mol Psychiatry 2002,
7:831-836.
74. McBride PA, Anderson GM, Hertzig ME, Snow ME, Thompson SM,
Khait VD, Shapiro T, Cohen DJ: Effects of diagnosis, race, and
puberty on platelet serotonin levels in autism and mental
retardation. J Am Acad Child Adolesc Psychiatry 1998, 37:767-776.
75. Press WH: Numerical recipes in C: the art of scientific computing 2nd ed
edition. Cambridge, Cambridge University Press; 1992.
76. Rohatgi VK: Statistical inference Mineola, N.Y, Dover Publications;
2003.
77. Chandana SR, Behen ME, Juhasz C, Muzik O, Rothermel RD, Mangner
TJ, Chakraborty PK, Chugani HT, Chugani DC: Significance of
abnormalities in developmental trajectory and asymmetry
of cortical serotonin synthesis in autism. Int J Dev Neurosci 2005,
23:171-182.
78. Chugani DC, Muzik O, Behen M, Rothermel R, Janisse JJ, Lee J, Chu-
gani HT: Developmental changes in brain serotonin synthesis
capacity in autistic and nonautistic children. Ann Neurol 1999,
45:287-295.
79. Coon H, Dunn D, Lainhart J, Miller J, Hamil C, Battaglia A, Tancredi
R, Leppert MF, Weiss R, McMahon W: Possible association
between autism and variants in the brain-expressed tryp-
tophan hydroxylase gene (TPH2). Am J Med Genet B Neuropsy-
chiatr Genet 2005, 135:42-46.
80. Whitaker-Azmitia PM: Serotonin and brain development: role
in human developmental diseases. Brain Res Bull 2001,
56:479-485.
81. Janusonis S, Gluncic V, Rakic P: Early serotonergic projections to
Cajal-Retzius cells: relevance for cortical development. J
Neurosci 2004, 24:1652-1659.
82. Hendricks TJ, Fyodorov DV, Wegman LJ, Lelutiu NB, Pehek EA,
Yamamoto B, Silver J, Weeber EJ, Sweatt JD, Deneris ES: Pet-1 ETS
gene plays a critical role in 5-HT neuron development and is
required for normal anxiety-like and aggressive behavior.
Neuron 2003, 37:233-247.
83. McKinney J, Knappskog PM, Haavik J: Different properties of the
central and peripheral forms of human tryptophan
hydroxylase. J Neurochem 2005, 92:311-320.
84. Launay JM, Ferrari P, Haimart M, Bursztejn C, Tabuteau F, Braconnier
A, Pasques-Bondoux D, Luong C, Dreux C: Serotonin metabolism
and other biochemical parameters in infantile autism. A con-
trolled study of 22 autistic children. Neuropsychobiology 1988,
20:1-11.
85. Croonenberghs J, Verkerk R, Scharpe S, Deboutte D, Maes M: Sero-
tonergic disturbances in autistic disorder: L-5-hydroxytryp-
tophan administration to autistic youngsters increases the
blood concentrations of serotonin in patients but not in
controls. Life Sci 2005, 76:2171-2183.
86. Kema IP, de Vries EG, Slooff MJ, Biesma B, Muskiet FA: Serotonin,
catecholamines, histamine, and their metabolites in urine,
platelets, and tumor tissue of patients with carcinoid
tumors. Clin Chem 1994, 40:86-95.
87. Siegel GJ: Basic neurochemistry: molecular, cellular, and medical aspects
6th ed edition. Philadelphia, Lippincott Williams & Wilkins; 1999.
88. Racke K, Reimann A, Schworer H, Kilbinger H: Regulation of 5-HT
release from enterochromaffin cells. Behav Brain Res 1996,
73:83-87.
89. Schworer H, Ramadori G: Autoreceptors can modulate 5-
hydroxytryptamine release from porcine and human small
intestine in vitro. Naunyn Schmiedebergs Arch Pharmacol 1998,
357:548-552.
90. Gebauer A, Merger M, Kilbinger H: Modulation by 5-HT3 and 5-
HT4 receptors of the release of 5-hydroxytryptamine from
the guinea-pig small intestine. Naunyn Schmiedebergs Arch
Pharmacol 1993, 347:137-140.
91. Schafermeyer A, Gratzl M, Rad R, Dossumbekova A, Sachs G, Prinz
C: Isolation and receptor profiling of ileal enterochromaffin
cells. Acta Physiol Scand 2004, 182:53-62.
92. Wade PR, Tamir H, Kirchgessner AL, Gershon MD: Analysis of the
role of 5-HT in the enteric nervous system using anti-idi-
otopic antibodies to 5-HT receptors. Am J Physiol 1994,
266:G403-G416.
93. Kirchgessner AL, Tamir H, Gershon MD: Identification and stim-
ulation by serotonin of intrinsic sensory neurons of the sub-
mucosal plexus of the guinea pig gut: activity-induced
expression of Fos immunoreactivity. J Neurosci 1992,
12:235-248.
94. Ahlman H, Larsson I, Lundberg J, Dahlstrom A, Donahue PE, Bhargava
HN: Neural control of serotonin release from duodenal ente-
rochromaffin cells of the cat. Surg Forum 1978, 29:404-407.
95. Kuemmerle JF, Kraus H, Kellum JM: Serotonin release is medi-
ated by muscarinic receptors on duodenal mucosal cells. J
Surg Res 1987, 43:139-142.
96. Racke K, Schworer H: Nicotinic and muscarinic modulation of
5-hydroxytryptamine (5-HT) release from porcine and
canine small intestine. Clin Investig 1992, 70:190-200.
97. Kahne D, Tudorica A, Borella A, Shapiro L, Johnstone F, Huang W,
Whitaker-Azmitia PM: Behavioral and magnetic resonance
spectroscopic studies in the rat hyperserotonemic model of
autism. Physiol Behav 2002, 75:403-410.
98. Varnas K, Halldin C, Pike VW, Hall H: Distribution of 5-HT4
receptors in the postmortem human brain an autoradio-
graphic study using [125I]SB 207710. Eur Neuropsychopharmacol
2003, 13:228-234.
99. Vilaro MT, Cortes R, Mengod G: Serotonin 5-HT(4) receptors
and their mRNAs in rat and guinea pig brain: Distribution
and effects of neurotoxic lesions. J Comp Neurol 2005,
484:418-439.
100. McBride PA, Anderson GM, Hertzig ME, Sweeney JA, Kream J, Cohen
DJ, Mann JJ: Serotonergic responsivity in male young adults
with autistic disorder. Results of a pilot study. Arch Gen
Psychiatry 1989, 46:213-221.
101. Goldberg J, Szatmari P, Zwaigenbaum L: Diminished serotonin
receptor function: A potential endophenotype of autism.
International Meeting for Autism Research 2004, S3.2.3:.
102. Chugani DC: Role of altered brain serotonin mechanisms in
autism. Mol Psychiatry 2002, 7 Suppl 2:S16-S17.
103. Yu AM, Idle JR, Byrd LG, Krausz KW, Kupfer A, Gonzalez FJ: Regen-
eration of serotonin from 5-methoxytryptamine by poly-
morphic human CYP2D6. Pharmacogenetics 2003, 13:173-181.
104. Patel S, Dulluc J, Geffard M: Comparison of serotonin and 5-
methoxytryptamine immunoreactivity in rat raphe nuclei.
Histochemistry 1986, 85:259-263.
105. Liu MT, Rayport S, Jiang Y, Murphy DL, Gershon MD: Expression
and function of 5-HT3 receptors in the enteric neurons of
mice lacking the serotonin transporter. Am J Physiol Gastrointest
Liver Physiol 2002, 283:G1398-G1411.
106. David SP, Murthy NV, Rabiner EA, Munafo MR, Johnstone EC, Jacob
R, Walton RT, Grasby PM: A functional genetic variation of the
serotonin (5-HT) transporter affects 5-HT1A receptor bind-
ing in humans. J Neurosci 2005, 25:2586-2590.
107. Christofi FL, Kim M, Wunderlich JE, Xue J, Suntres Z, Cardounel A,
Javed NH, Yu JG, Grants I, Cooke HJ: Endogenous adenosine dif-
ferentially modulates 5-hydroxytryptamine release from a
human enterochromaffin cell model. Gastroenterology 2004,
127:188-202.
108. Bertrand PP: ATP and sensory transduction in the enteric
nervous system. Neuroscientist 2003, 9:243-260.
109. Davalos D, Grutzendler J, Yang G, Kim JV, Zuo Y, Jung S, Littman DR,
Dustin ML, Gan WB: ATP mediates rapid microglial response
to local brain injury in vivo. Nat Neurosci 2005, 8:752-758.
110. Courchesne E, Pierce K: Why the frontal cortex in autism
might be talking only to itself: local over-connectivity but
long-distance disconnection. Curr Opin Neurobiol 2005,
15:225-230.
111. Vargas DL, Nascimbene C, Krishnan C, Zimmerman AW, Pardo CA:
Neuroglial activation and neuroinflammation in the brain of
patients with autism. Ann Neurol 2005, 57:67-81.