Báo cáo y học: "Allometric scaling of the maximum metabolic rate of mammals: oxygen transport from the lungs to the heart is a limiting step" pdf
Bạn đang xem bản rút gọn của tài liệu. Xem và tải ngay bản đầy đủ của tài liệu tại đây (335.5 KB, 8 trang )
BioMed Central
Page 1 of 8
(page number not for citation purposes)
Theoretical Biology and Medical
Modelling
Open Access
Research
Allometric scaling of the maximum metabolic rate of mammals:
oxygen transport from the lungs to the heart is a limiting step
Page R Painter*
Address: Office of Environmental Health Hazard Assessment, California Environmental Protection Agency, P. O. Box 4010, Sacramento, California
95812, USA
Email: Page R Painter* -
* Corresponding author
Abstract
Background: The maximum metabolic rate (MMR) of mammals is approximately proportional to
M
0.9
, where M is the mammal's body weight. Therefore, MMR increases with body weight faster
than does the basal metabolic rate (BMR), which is approximately proportional to M
0.7
. MMR is
strongly associated with the capacity of the cardiovascular system to deliver blood to capillaries in
the systemic circulation, but properties of this vascular system have not produced an explanation
for the scaling of MMR.
Results: Here we focus on the pulmonary circulation where resistance to blood flow (impedance)
places a limit on the rate that blood can be pumped through the lungs before pulmonary edema
occurs. The maximum pressure gradient that does not produce edema determines the maximum
rate that blood can flow through the pulmonary veins without compromising the diffusing capacity
of oxygen. We show that modeling the pulmonary venous tree as a fractal-like vascular network
leads to a scaling equation for maximum cardiac output that predicts MMR as a function of M as
well as the conventional power function aM
b
does and that least-squares regression estimates of
the equation's slope-determining parameter correspond closely to the value of the parameter
calculated directly from Murray's law.
Conclusion: The assumption that cardiac output at the MMR is limited by pulmonary capillary
pressures that produce edema leads to a model that is in agreement with experimental
measurements of MMR scaling, and the rate of blood flow in pulmonary veins may be rate-limiting
for the pathway of oxygen.
Introduction
The maximum metabolic rate (MMR) of mammals is
measured as the rate of oxygen consumption during the
maximum sustainable rate of exercise [1]. Unlike the basal
metabolic rate (BMR), which consumes oxygen at rates far
below the delivery capacity of the cardiovascular system
[1,2], the MMR is largely determined by the maximal rate
that the cardiovascular system can deliver oxygen to mito-
chondria in muscle tissue [1].
MMR has been measured in mammals ranging in size, M,
from 0.007 kg (pygmy mice) to 575 kg (cattle). Regression
of the logarithm of MMR (denoted Q) on the logarithm of
M gives a maximum-likelihood estimate (MLE) of the
exponent b in the allometric expression
Published: 11 August 2005
Theoretical Biology and Medical Modelling 2005, 2:31 doi:10.1186/1742-4682-2-31
Received: 22 March 2005
Accepted: 11 August 2005
This article is available from: />© 2005 Painter; licensee BioMed Central Ltd.
This is an Open Access article distributed under the terms of the Creative Commons Attribution License ( />),
which permits unrestricted use, distribution, and reproduction in any medium, provided the original work is properly cited.
Theoretical Biology and Medical Modelling 2005, 2:31 />Page 2 of 8
(page number not for citation purposes)
Q = aM
b
(1)
of 0.872 with a 95% confidence interval (CI) of 0.812–
0.931 for MMR data from 32 mammalian species [1]. In
contrast, regression analysis of BMR data from 619 mam-
malian species gives a MLE of the slope, 0.69, with 95%
CI, 0.68–0.70 [3]
To explain the scaling of the metabolic rate in mammals,
West et al. [4] and Bengtson and Eden [5] model the arte-
rial network as a structure that starts with a single tube
(aorta) that repeatedly branches into two (or more)
smaller tubes. Branching continues until a tube (small
arteriole) that supplies capillaries is reached. They assume
that all paths from the heart to capillaries pass through n
tubes and that the arterial network is a truncated self-sim-
ilar fractal (i.e., a fractal-like network). The smallest ves-
sels of the circulatory system have dimensions that vary
little with body size, whereas the dimensions of the aorta
and other great vessels are highly dependent on size. For
convenience, we define level 1 of the arterial tree (or
venous tree) as the smallest arterioles (or venules). These
have radius r
1
and length l
1
. Each level 2 vascular tube with
radius r
2
and length l
2
is connected to
η
1
level 1 structures.
In general, each level i+1 tube of radius r
i+1
and length l
i+1
is connected to
η
i
level i tubes. It follows from the assump-
tion of a self-similar fractal that the branching ratio is a
constant (denoted
η
) and that the ratio of tube lengths,
l
i+1
/l
i
, is also a constant (denoted L) throughout the
network.
The theory of West et al. minimizes the (pressure) × (vol-
ume) work of the heart that is required to pump one unit
of blood against a difference in pressure equal to the pres-
sure in the aorta minus the pressure in capillaries. This
work per unit of blood flow is proportional to the imped-
ance in the arterial network. Minimization of this energy
cost for pulsatile flow in arteries is claimed to require area-
preserving branching of the network (i.e., the ratio r
i+1
/r
i
,
termed R, is equal to
η
1/2
) and, as a consequence, to
require that the density of capillaries in tissues is propor-
tional to M
-1/4
(assuming that the diameter of the aorta
scales proportionally to M
3/8
or that arterial blood volume
scales proportionally to M). The theory's 3/4-power scal-
ing prediction for metabolic rate follows from the
assumption that metabolic rate is proportional to the total
number of capillaries calculated as tissue capillary density
multiplied by M, an assumption that is reasonable for
MMR but not for BMR [1]. The theory of Bengtson and
Eden assumes that energy dissipation per endothelial sur-
face area is constant, leading to the conclusions that R is
equal to
η
2/5
and that the total number of capillaries is
proportional to M
15/17
if the volume of blood in arteries
scales proportionally to M. If it is assumed that the diam-
eter of the aorta scales proportionally to M
3/8
, the number
of capillaries is proportional to M
15/16
.
The scaling of the total number of capillaries in skeletal
muscle, where over 90% of energy metabolism occurs
during MMR exercise, is nearly identical to the scaling of
MMR [1], and, as noted above, this scaling is not propor-
tional to M
3/4
. The 95% CI for the scaling exponent for
total capillary volume, 0.909 – 1.0559, contains 15/16
but not 3/4. Moreover, if either of these theories is ade-
quate for predicting capillary density, it should correctly
predict the scaling exponent for capillaries in the lung,
which is 1.00 with 95% CI of 0.912 – 1.087 [6]. This CI
contains 15/16 but not 3/4.
A model for the maximum metabolic rate
While minimization of impedance does not by itself lead
to a correct prediction of capillary density in muscle and
lung tissue, it is clearly an important principle for design
of mammalian vascular systems [7,8]. The potential
importance of impedance is most apparent in the pulmo-
nary venous circulation, where the entire output of the
heart's right ventricle flows before blood enters the left
atrium of the heart. The driving force for pulmonary
venous return to the heart is the pressure at the venous
end of pulmonary capillaries minus the diastolic pressure
in the left atrium (denoted P
LA
).
The output of oxygen by the left ventricle of the heart into
the aorta is equal to the input of oxygen from the lungs to
the heart. This is equal to the cardiac blood output rate
multiplied by the maximum amount of oxygen per ml of
blood multiplied by the percent saturation of blood with
oxygen. Pressure in the model is strictly increasing with
flow. However, as pressure rises above oncotic pressure,
interstitial edema increases and then more and more fluid
accumulates within alveoli. Therefore, oxygen saturation
is strictly decreasing as a consequence of the increasing
barrier to oxygen diffusion from pulmonary air into cap-
illaries. As a result, there is a blood flow rate, denoted F
max
,
that produces the maximum uptake of oxygen in the
lungs, which is also the maximum output of oxygen to the
body. The pressure near the venous end of alveolar capil-
laries at F
max
is denoted Π
max
. Consequently, the pressure
gradient that drives the return of blood in pulmonary cap-
illaries back to the heart is
∆P
max
= F
max
I
p
(2)
where ∆P
max
= Π
max
- P
LA
and I
p
is the impedance of the pul-
monary venous network. It is assumed that Π
max
is propor-
tional to the oncotic pressure of blood, denoted Π
o
. The
value of Π
max
is assumed to be approximately the same in
mammals of different sizes because Π
o
appears to be
nearly invariant in mammalian species, being approxi-
Theoretical Biology and Medical Modelling 2005, 2:31 />Page 3 of 8
(page number not for citation purposes)
mately 20 mm Hg [9-11] and P
LA
is approximately 1 mm
Hg. (All pressures in this article are measured relative to
ambient pressure.) Therefore, the scaling of F
max
with
body size depends largely on the scaling of I
p
.
The impedance of the pulmonary venous network is a
consequence of its physical structure and the viscosity of
blood (termed
ν
). The pulmonary arteries and veins form
parallel fractal-like networks in each lung with arteries
and veins of the same level having similar dimensions
[12,13]. Small venules have dimensions that are body-
size-invariant (r
1
approximately 10
-5
m and l
1
approxi-
mately 10
-4
m). These vascular tubes receive blood from
the capillaries in pulmonary acini, the structures that
comprise approximately 10,000 alveoli and that appear to
be body-size-invariant in mammals [14].
The impedance of a fractal-like network is the sum of
impedances contributed by each level of the network. We
assume that the impedance I
i
due to level i is the value cal-
culated from the Poiseuille theory for non-turbulent fluid
flow, , where N
i
is the number of level i
vessels [4]. Consequently, I
i+1
is equal to
. The observation
that dimensions within acini are size-invariant leads to
the conclusion that
η
, R and L are size-invariant in acini.
We assume that these ratios remain constant throughout
the network. Therefore, the factor
η
L/R
4
(denoted
α
) is
assumed to be size-invariant, and the expression for I
p
is a
geometric series (when
α
≠ 1) that simplifies to
Substitution of this formula into Equation (2) gives
The assumption that the acinus is a size-invariant struc-
ture implies that the number of level 1 venules per acinus
is independent of body size. Consequently, the total
number of level 1 venules, N
1
, is proportional to lung vol-
ume, which is proportional to body mass M [6]. The
parameter n is the number of branchings from the pulmo-
nary vein to level 1 venules. Therefore
η
n
= N
1
∝
M, which
is written as
η
n
= M /M
1
. The constant M
1
is the mass of
body tissue supplied with the oxygen in blood flowing
through a single level 1 venule. This is estimated to be
approximately 10
-5
kg [15,16] leading to the equation n =
[log(M)-log(10
-5
)]/log(
η
). Substitution for N
1
and n in
Equation (4) gives F
max
= KM/ [1-
ζ
log(M)-log(0.00001)
], where
ζ
=
α
1/log(
η
)
and K is the constant
. The maximal rate oxygen
uptake in the lungs, Q, is U
o
F
max
,, where U
o
is the oxygen
uptake in the lungs per unit of blood. Therefore, when
α
≠ 1,
Q = U
o
C M/ [1-
ζ
log(M)-log(0.00001)
] (5)
where C is a constant. Note that
ζ
depends on the base
used to define the logarithm. The base 10 is used in the
following regression analysis. When
α
= 1, we have
Q = U
o
C M/ [log(M)-log(0.00001)]/ log(
η
) (6)
Equation (5) is termed the general pulmonary venous
flow capillary pressure model (PVFCP model), and Equa-
tion (6) is termed the constrained PVFCP model.
Testing model predictions
The conventional method for determining the best fit of
Equation (5) or Equation (1) to oxygen uptake data is to
find the values of the two parameters in the model that
correspond to a minimum of the sum of squares of resid-
uals (SSR), where a residual is defined as the logarithm of
(8 / )/(
νπ
l
i
/)Nr
ii
4
INrl N r l ILR
iiii ii i i
()/( )/
4
111
44
+++
=
η
IlNr
p
n
=−−
()
[( )/( )]( )/( )811 3
111
4
νπ α α
FPNr l
n
max max
=−−
()
∆ ()()/[()()]
πανα
11
4
1
181 4
∆Pr l
max
()( )/()
παν
1
4
1
18−
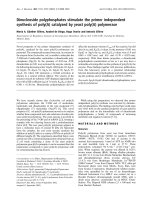
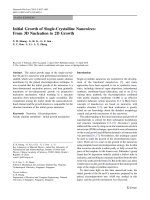
Regression analysis of MMR data in Table 1 (VO
2
max in ml/min and body weight in kg) using the standard linear model, Equation (1)Figure 1
Regression analysis of MMR data in Table 1 (VO
2
max in ml/
min and body weight in kg) using the standard linear model,
Equation (1). The minimum SSR is 1.6308.
Theoretical Biology and Medical Modelling 2005, 2:31 />Page 4 of 8
(page number not for citation purposes)
a measured value of the uptake rate minus the logarithm
of the uptake rate predicted by the model for a mammal
of the experimentally measured weight M. The technique
is termed least squares logarithmic regression (LSLR). Fig-
ure 1 shows the best fit of the standard allometric model,
Equation (1), to the data in Table 1. The minimal SSR
occurs when b is 0.872 and the SSR is 1.6307. Figure 2
shows that the model of Equation (5), assuming that U
o
is
constant, fits the data equally well: the minimal SSR
occurs when the parameter
ζ
, which determines the slope
of this scaling expression, is 1.193, and the SSR is 1.6269.
In the analysis of data in Table 1, it is assumed that maxi-
mum oxygen uptake is proportional to cardiac output (i.e.
U
o
is constant). A more reasonable assumption is that oxy-
gen uptake is proportional to cardiac output multiplied by
the hemoglobin concentration of blood. The data in Table
2 include values of the hematocrit, which is nearly propor-
tional to hemoglobin concentration. Therefore, the maxi-
mal rate of oxygen uptake multiplied by 0.42 and divided
by the hematocrit (i. e., the oxygen uptake adjusted to a
hematocrit of 0.42) is now assumed to be proportional to
maximum cardiac output.
LSLR using the data in Table 2 and the model of Equation
(1) gives the value of 0.957 for b (R
c
2
= .9697) and SSR =
0.5890) when the SSR is minimized. LSLR using Equation
(5) finds that the SSR is minimized when
ζ
equals 0.801
(SSR = 0.5833). LSLR of predicted values of cardiac output
from Equation (5) using values of M from Table 2 and the
estimate for
ζ
of 0.801 gives b = 0.958 and R
c
2
= 0.9991.
Clearly the predictions from Equation (5) are again nearly
indistinguishable from those of Equation (1), and Equa-
tion (5) fits these data as well as Equation (1) does.
Table 1: Maximum metabolic rates (V
O2
max) of mammals from
Weibel et al.[1].
Mammal M (kg) V
O2
max (ml/min)
Pygmy mouse 0.0072 1.884
Woodmouse 0.02 5.28
Deer mouse 0.022 4.928
Mouse 0.026 3.884
Chipmunk 0.09 21.485
Mole rat 0.136 14.58
Rat 0.278 23.13
Dwarf mongoose 0.43 54.44
Guinea pig 0.584 32.59
Rat kangaroo 1.1 194.7
Banded mongoose 1.14 130
Genet cat 1.38 146.6
Spring hare 3 291.6
Agouti 3.22 328.4
Suri 3.3 317.8
Dik-dik 4.2 228.1
Fox 4.51 897.5
Grant's gazelle 10.1 539.3
Coyote 12.4 2283.3
Pig 18.5 1731.6
African sheep 21.8 1013.7
Goat 24.3 1344.7
Dog 25.9 3825
Wolf 27.6 4310
Pronghorn 28.4 8435
Lion 30 1800
Wildebeest 102 4468
Waterbuck 110 5172
Calf 141 5161
Pony 171 15185
Zebu cattle 193 5660
Eland 240 8640
Horse 453 56005
Steer 475 24225
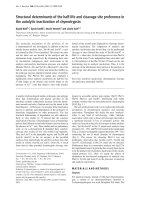
Regression analysis of MMR data in Table 1 (VO
2
max in ml/min and body weight in kg) using the model of Equation (5)Figure 2
Regression analysis of MMR data in Table 1 (VO
2
max in ml/
min and body weight in kg) using the model of Equation (5).
The closed circles are the data points from Table 1, and the
open circles are the graph of the physiologically-based model,
Equation (5), with parameters calculated from LSLR. The
minimum SSR is 1.6263.
Theoretical Biology and Medical Modelling 2005, 2:31 />Page 5 of 8
(page number not for citation purposes)
While the logarithm of the function Q defined in Equa-
tion (5) is a nonlinear function of the logarithm of M, it is
clear from Figure 2 that the logarithm of Q closely approx-
imates a linear function of the logarithm of M. This obser-
vation is confirmed by substituting first-order
approximations into Equations (5) and (6): The scaling of
Q when
α
= 1 can be predicted directly from Equation (6).
Multiplying and dividing by log(M
1
) gives Q ∝ (M/
log(M
1
))/(1 - log(M)/log(M
1
)). Using logarithms to the
base e and the first-order approximation log
e
(1+x) = x
shows that log
e
(Q) is approximately equal to log
e
(M) +
log
e
(M)/log
e
(M
1
) plus a constant , i.e., Q is approximately
proportional to M
b
where b = 1 + 1/log
e
(M
1
). For M
1
=
0.00001 b = 0.914, which is close to the value from LSLR
of data simulated using Equation (6). A similar approxi-
mation analysis of Equation (5) shows that it too is
approximately a power function when
α
is approximately
equal to 1. Figure 3 shows that, with the parameters used
in Figure 2, the logarithm of Q defined in Equation (5) is
nearly identical to a linear function of the logarithm of M.
Comparison with Murray's law
The estimate of
α
=
η
L/R
4
corresponding to
ζ
is
ζ
log(
η
)
. For
a branching ratio of 2 and
ζ
= 1.193,
α
is estimated to be
1.054. For a volume-filling fractal distribution network, it
has been conjectured that [4]
L =
η
1/3
, (7)
and this equation for L leads to the formula
R
3
= 1.04
η
. (8)
Equation (8) is remarkably similar to Murray's law for the
scaling of radii of arterial or venous networks, which states
that flow rate is proportional to the third power of vessel
radius [7]. For our network model, Murray's law implies
R
3
=
η
, and this equation together with the condition L =
η
1/3
implies
α
= 1. With this value of
α
, the slope of the
logarithm of Equation (6) depends only on the estimate
of M
1
. For M
1
= 0.00001 kg, Equation (6) is nearly identi-
cal to a power function with b = 0.916. Therefore, Murray's
law and the fractal length scaling relationship lead to the
constrained PVFCP model and predict that the slope
parameter of the scaling function is in the range of
observed values.
Discussion
The PVFCP model predicts that the logarithm of maxi-
mum oxygen uptake in mammals is approximately pro-
portional to the logarithm of body mass. If the radii of
veins in the pulmonary venous tree obey Murray's law,
then the constant of proportionality is in the range of
experimentally observed values for MMR. The PVFCP
model, like other published explanations for MMR scal-
ing, focuses on the supply of oxygen to the tissues. How-
ever, the PVFCP model differs from other explanations for
MMR scaling because it focuses on pulmonary blood
flow.
The PVFCP model and the model of Bengtson and Eden
[5] use the same mathematical description of pressure-
flow relationships in a vascular tree. While the model of
Bengtson and Eden [5] is consistent with current data on
MMR, the model's assumption of energy dissipation that
is proportional to vascular surface area is questionable as
a principle of mammalian design. For example, a hypo-
thetical mammalian species that replaces the R =
η
2/5
requirement of their theory with the R =
η
1/3
relationship
of Murray's law would reduce total energy dissipation in
arteries. This replacement would also give a higher pre-
dicted capillary density and consequently a higher MMR.
Table 2: Maximum metabolic rates of mammals adjusted to a standard hematocrit of 0.42 from Weibel et al.[1].
Mammal Body mass (kg) Hematocrit V
O2
max (ml/min)
Measured value Adjusted value
Woodmouse 0.02 0.42 5.28 5.28
Mole rat 0.129 0.42 13.61 13.61
Rat 0.148 0.42 15.55 15.55
Guinea pig 0.595 0.5 33.2 27.888
Agouti 3.22 0.42 328.44 328.44
Fox 4.4 0.42 955.7 955.7
Goat 21 0.299 1386 1946.89
Dog 23.7 0.5 3455.5 2902.62
Pronghorn 28.4 0.456 8434.8 7768.895
Horse 446 0.55 60745.2 46387.24
Steer 475 0.4 24225 25436.25
Theoretical Biology and Medical Modelling 2005, 2:31 />Page 6 of 8
(page number not for citation purposes)
It is instructive to compare the number of independent
parameters and assumptions in the PVFCP model with the
number of parameters and assumptions in the two fractal-
like models of the arterial network that predict metabolic
scaling [4,5]. All three models describe the vascular net-
work as a self-similar fractal-like tubular structure with
pressure gradients determined by Poiseuille's law. All
assume that the size of terminal (smallest) network tubes
is the same in mammals of different size and that blood
viscosity does not vary with body size. All contain the
branching ratio parameter
η
and the network length
parameter n. In the PVFCP model, a relationship between
η
, n and body mass is derived from the assumption that
the number of terminal segments is proportional to body
mass, an assumption that is supported by observations. In
the other two models, a relation between these parameters
is derived from the assumption that arterial blood volume
is proportional to body mass, an assumption without
direct observational support. Network structure is related
to metabolic rate in the PVFCP model by Equation (5),
which specifies the maximum rate of blood flow that does
not compromise pulmonary function. In the other mod-
els, such a relation is derived from the assumption that
metabolic rate is proportional to the number of capillaries
in the systemic circulation. In the PVFCP model, there is
one more independent parameter,
α
, which is defined by
fitting experimental data. The other models have two
additional parameters, L and R. Both models specify L
indirectly using the assumption of Equation (7). The
parameter R is specified by an energy minimization prin-
ciple in one model [4] and by an energy dissipation prin-
ciple in the other [5]. While the number of parameters
and assumptions in the PVFCP model is relatively large, it
is less than the number in the fractal-like network models
previously published. Another recent mathematical
description of metabolic scaling, the "Allometric Cascade"
model [2], is not discussed here because it is not a mech-
anistic model. Indeed, the two models appear compatible
because the PVFCP model could be integrated into the
"Allometric Cascade" model to provide a mechanism-
based scaling term for the maximum rate of blood flow.
Weibel et al. [1] argue that it is the volume of mitochon-
dria in muscle tissue and the blood supply in capillaries in
muscle tissue that determine the scaling of MMR. This
view is supported by their demonstration that MMR is
remarkably correlated with and is proportional to mito-
chondrial volume (b = 1.09, R
c
2
= 0.9939) and to esti-
mated capillary blood volume in muscle tissue (b = 0.975,
R
c
2
= 0.9846). However, total mitochondrial volume and
blood volume in muscle capillaries can be increased by
exercise conditioning, and the correlation between capil-
lary surface area and MMR or between mitochondrial vol-
ume and MMR may arise from such conditioning.
In the formulation of the PVFCP model, the role of gravity
in facilitating or impeding the return of pulmonary blood
to the heart has been ignored. Blood that is one inch
higher than the left atrium has potential energy to facili-
tate its return to the heart that is approximately equivalent
to a 2 mm Hg pressure gradient. For small mammals (e.g.,
mice), gravitational effects would be small compared with
the approximately 20 mm Hg pressure gradient that we
assume drives blood return during MMR exercise. How-
ever, for large mammals (e.g., elephants and whales), the
effects of gravity will significantly increase blood return
from regions of lung above the heart, but decrease blood
return from regions below the heart. Therefore, Equation
(5) may not adequately describe MMR blood flow in large
mammals.
A second reason for doubting the validity of Equation (5)
for large mammals is that intervals of the heart cycle
increase with body size. The minimum length of the heart
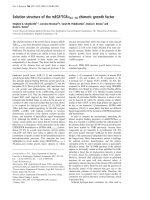
Predicted values of MMR from Equation (5) for mammals with the body weights in Table 1Figure 3
Predicted values of MMR from Equation (5) for mammals
with the body weights in Table 1. The straight line is the best
fit of the standard allometric model, Equation (1), to the pre-
dicted values.
Theoretical Biology and Medical Modelling 2005, 2:31 />Page 7 of 8
(page number not for citation purposes)
cycle (at maximum heart rate) is largely composed of the
time required for the ventricles to fill plus the time
required for the ventricles to eject blood into the pulmo-
nary artery and aorta. At maximal heart rate, ventricular
filling time is nearly equal to the PR interval, which is
approximately proportional to the 1/4-power of body
mass [17]. If the sum of the QRS interval and the ST seg-
ment, which is nearly equal to the time required to eject
blood from the ventricles, has similar scaling, then the
scaling exponent for maximum heart rate is less than the
scaling exponent for the MMR divided by body mass, i.e.,
the specific maximum metabolic rate (SMMR). Thus,
maximum heart rate, not the limitation posed by pulmo-
nary venous impedance, may limit MMR for very large
mammals.
The biological plausibility of the relation between MMR
and I
p
proposed in the PVFCP model depends on whether
pressures in lung capillaries approach the oncotic pressure
of blood during periods of maximal exertion. In healthy
humans at rest, the pressure difference between pulmo-
nary capillaries and the left atrium ranges from approxi-
mately 5 to 11 mm Hg [18]. Assuming that the value of 5
mm Hg occurs when pulmonary veins are dilated, this
pressure difference is predicted to increase by a factor of
approximately 4 during heavy exercise in a trained athlete
when cardiac output increases by a factor of 4 (assuming
that the pulmonary veins are in a comparable state of dila-
tion). This would require the capillary pressure to rise to
approximately 21 mm Hg. It is noteworthy that signs of
pressure stress are sometimes observed in pulmonary tis-
sue from trained endurance athletes [19].
Studies of human patients with narrowing of the mitral
valve, the valve between the left atrium and left ventricle,
are consistent with the hypothesis that I
p
limits maximum
metabolic rate. This condition, termed mitral stenosis,
causes an increase in P
LA
. Patients with a P
LA
below 20 mm
Hg usually do not have pulmonary edema at rest but may
develop it with exercise. Furthermore, women with a P
LA
between 18 and 20 mm Hg are at risk for developing pul-
monary edema during pregnancy where the cardiac out-
put at rest increases on average by approximately 50%
[20-22].
Additional support for the proposed role of pulmonary
impedance in determining MMR comes from studies of
horses, which have an MMR well above the value pre-
dicted by the allometric equation fitted to the data in
Table 1[1]. Horses at rest have pulmonary capillary blood
pressures that are above those in humans with mitral ste-
nosis and pulmonary edema with exercise. Horses are
apparently able to exercise without developing pulmo-
nary edema because they are able to "concentrate" their
blood during periods of exertion. The concentration of
erythrocytes (measured as the hematocrit) is increased
during exercise [23]. This requires a preferential loss of
water that likely occurs in capillaries of the systemic circu-
lation. As a result, the concentration of albumin in blood
is increased and the oncotic pressure of blood is increased.
This adaptation enables a horse at a gallop to tolerate pul-
monary capillary pressures as high as 38 mm Hg [24].
Horses possess a second adaptation that allows them to
increase their SMMR. Their ratio of lung volume to body
mass is approximately 20% greater than the average value
for mammals [6]. To pump blood through their large
lungs at an unusually high rate per unit lung volume,
horses possess a heart that is larger (as a fraction of body
mass) than the average value for mammals [25]. This ena-
bles them to achieve a SMMR that is more than twice that
of a cow of similar size. However, even with its remarka-
ble adaptations, no horse can sustain the SMMR that
pygmy mice and other small mammals can achieve [1].
Competing interests
The author(s) declare that they have no competing
interests.
Acknowledgements
I thank Charles Salocks and Danielle Ketchum for their careful reviews and
helpful comments.
References
1. Weibel ER, Bacigalupe LD, Schmitt B, Hoppeler H: Allometric scal-
ing of maximal metabolic rate in mammals: muscle aerobic
capacity as determinant factor. Respir Physiol Neurobiol 2004,
140:115-132.
2. Darveau C-A, Suarez RK, Andrews RD, Hochachka PW: Allometric
cascade as a unifying principle of body mass effects on
metabolism. Nature 2002, 417:166-170.
3. White CR, Seymour RS: Mammalian basal metabolic rate is
proportional to body mass
2/3
. Proc Natl Acad Sci USA 2003,
100:4046-4049.
4. West GB, Brown JH, Enquist BJ: A general model for the origin
of allometric scaling laws in biology. Science 1997, 276:122-126.
5. Bengtson H-U, Eden P: A simple model for the arterial system.
J Theoret Biol 2003, 221:437-443.
6. Gehr P, Mwangi DK, Ammann A, Maloiy GM, Taylor CR, Weibel ER:
Design of the mammalian respiratoey system. V. Scaling
morphometric pulmonary diffusing capacity to body mass:
wild and domestic animals. Respir Physiol 1981, 44:61-86.
7. Murray CD: The physiological principle of minimum work. I.
The vascular system and the cost of blood volume. Proc Natl
Acad Sci USA 1926, 12:207-214.
8. LaBarbera M: Principles of design of fluid transport systems in
zoology. Science 1990, 249:992-1000.
9. Stohrer M, Boucher Y, Stangassinger M, Jain RK: Oncotic pressure
in solid tumors is elevated. Cancer Res 2000, 60:4251-4255.
10. Gabel JC, Scott RL, Adair TH, Drake RE, Traber DL: Errors in cal-
culated oncotic pressure of dog plasma. Am J Physiol 1980,
239:H810-H812.
11. Madigan JE, Rahal CJ: Measurement of Plasma Colloid Osmotic Pressure in
Normal Thoroughbred Neonatal Foals Davis California: University of
California; 2003.
12. Agur AM, Ming JL, Grant JC: Grant's Atlas of Anatomy Baltimore: Lip-
pincott, Williams and Williams; 2004.
13. Bergman RA, Afifi AK, Heidger PM: Atlas of Microscopic Anatomy Phil-
adelphia: WB Saunders; 1996.
14. Weibel ER: Fractal geometry: a design principle for living
organisms. Am J Physiol 1991, 261:L361-L369.
Publish with BioMed Central and every
scientist can read your work free of charge
"BioMed Central will be the most significant development for
disseminating the results of biomedical research in our lifetime."
Sir Paul Nurse, Cancer Research UK
Your research papers will be:
available free of charge to the entire biomedical community
peer reviewed and published immediately upon acceptance
cited in PubMed and archived on PubMed Central
yours — you keep the copyright
Submit your manuscript here:
/>BioMedcentral
Theoretical Biology and Medical Modelling 2005, 2:31 />Page 8 of 8
(page number not for citation purposes)
15. Turcotte DL, Pelletier JD, Newman WI: Networks with side
branching in biology. J Theoret Biol 1998, 193:577-592.
16. Fung YC: Biomechanics New York: Springer-Verlag; 1990.
17. Noujaim SF, Lucca E, Munoz V, Persaud D, Berenfeld O, Meijler FL,
Jalife J: From mouse to whale: a universal scaling relation for
the PR Interval of the electrocardiogram of mammals. Circu-
lation 2004, 110:2802-2808.
18. Tabata T, Oki T, Fukuda N, Iuchi A, Manabe K, Kageji Y, Sasaki M,
Yamada H, Ito S: Influence of left atrial pressure on left atrial
appendage flow velocity patterns in patients in sinus rhythm.
J Am Soc Echocardiogr 1996, 9:857-864.
19. West JB: Vulnerability of pulmonary capillaries during
exercise. Exerc Sport Sci Rev 2004, 32:24-30.
20. Reis G, Motta MS, Barbosa MM, Esteves WA, Souza SF, Bocchi EA:
Dobutamine stress echocardiography for noninvasive assess-
ment and risk stratification of patients with rheumatic
mitral stenosis. J Am Col Cardiol 2004, 43:393-401.
21. Desai DK, Adanlawo M, Naidoo DP, Moodley J, Kleinschmidt I:
Mitral stenosis in pregnancy: a four-year experience at King
Edward VIII Hospital, Durban, South Africa. BJOG 2000,
107:953-958.
22. van Oppen AC, Stigter RH, Bruinse HW: Cardiac output in nor-
mal pregnancy: a critical review. Obstet Gynecol 1996,
87:310-318.
23. Weber J-M, Dobson GP, Parkhouse WS, Wheeldon D, Harman JC,
Snow DH, Hochachka PW: Cardiac output and oxygen con-
sumption in exercising Thoroughbred horses. Am J Physiol
1987, 253:R890-R895.
24. Hackett RP, Ducharme NG, Gleed RD, Mitchell L, Soderholm LV,
Erickson BK, Erb HN: Do Thoroughbred and Standardbred
horses have similar increases in pulmonary vascular pres-
sures during exercise? Can J Vet Res 2003, 67:291-296.
25. Hoppeler H, Lindstedt SL, Claassen H, Taylor CR, Mathieu O, Weibel
ER: Scaling mitochondrial volume in heart to body mass.
Respir Physiol 1984, 55:131-137.