Báo cáo y học: "On the number of founding germ cells in humans" ppt
Bạn đang xem bản rút gọn của tài liệu. Xem và tải ngay bản đầy đủ của tài liệu tại đây (272.31 KB, 6 trang )
BioMed Central
Page 1 of 6
(page number not for citation purposes)
Theoretical Biology and Medical
Modelling
Open Access
Research
On the number of founding germ cells in humans
Chang-Jiang Zheng*
1
, E Georg Luebeck
2
, Breck Byers
3
and
Suresh H Moolgavkar
2
Address:
1
Department of Occupational and Environmental Medicine, Regions Hospital, University of Minnesota, 640 Jackson Street, Saint Paul,
MN 55101, USA,
2
Division of Public Health Sciences Fred Hutchinson Cancer Research Center, 1100 Fairview Avenue North, Seattle, WA 98109,
USA and
3
Department of Genome Sciences, University of Washington, Seattle, WA 98195, USA
Email: Chang-Jiang Zheng* - ; E Georg Luebeck - ; Breck Byers - ;
Suresh H Moolgavkar -
* Corresponding author
Abstract
Background: The number of founding germ cells (FGCs) in mammals is of fundamental
significance to the fidelity of gene transmission between generations, but estimates from various
methods vary widely. In this paper we obtain a new estimate for the value in humans by using a
mathematical model of germ cell development that depends on available oocyte counts for adult
women.
Results: The germline-development model derives from the assumption that oogonial
proliferation in the embryonic stage starts with a founding cells at t = 0 and that the subsequent
proliferation can be defined as a simple stochastic birth process. It follows that the population size
X(t) at the end of germline expansion (around the 5
th
month of pregnancy in humans; t = 0.42 years)
is a random variable with a negative binomial distribution. A formula based on the expectation and
variance of this random variable yields a moment-based estimate of a that is insensitive to the
progressive reduction in oocyte numbers due to their utilization and apoptosis at later stages of
life. In addition, we describe an algorithm for computing the maximum likelihood estimation of the
FGC population size (a), as well as the rates of oogonial division and loss to apoptosis. Utilizing
both of these approaches to evaluate available oocyte-counting data, we have obtained an estimate
of a = 2 – 3 for Homo sapiens.
Conclusion: The estimated number of founding germ cells in humans corresponds well with
values previously derived from chimerical or mosaic mouse data. These findings suggest that the
large variation in oocyte numbers between individual women is consistent with a smaller founding
germ cell population size than has been estimated by cytological analyses.
1. Introduction
Despite great strides in our understanding of the genetic
regulation of germ cell determination in recent years [1],
the size of the founding germ cell population in humans
remains obscure. Due to this uncertainty, it is difficult in
a clinical environment to estimate the probability that a
mutant allele known to be mosaic in the somatic tissues
of a parent will be transmitted to offspring. Even in the
mouse, where experimental approaches are feasible, the
number of founding germ cells (FGCs) has proven
Published: 24 August 2005
Theoretical Biology and Medical Modelling 2005, 2:32 doi:10.1186/1742-4682-2-32
Received: 01 June 2005
Accepted: 24 August 2005
This article is available from: />© 2005 Zheng et al; licensee BioMed Central Ltd.
This is an Open Access article distributed under the terms of the Creative Commons Attribution License ( />),
which permits unrestricted use, distribution, and reproduction in any medium, provided the original work is properly cited.
Theoretical Biology and Medical Modelling 2005, 2:32 />Page 2 of 6
(page number not for citation purposes)
difficult to establish. Cytochemical methods have sug-
gested FGC numbers varying from 45 cells [2] to 193 cells
[3]. On the other hand, genetic analysis of artificially gen-
erated chimerical cellular populations in the mouse indi-
cate that there are only 2 to 9 cells that actually contribute
to the germ cell population [4-10]. In this communica-
tion, we derive a new method that is applicable to both
humans and laboratory animals. This approach exploits a
"founder effect" phenomenon that has previously been
shown to be amenable to mathematical analysis [11,12].
Specifically, such analysis has shown that, if a population
is descended from a small set of ancestral founders, the
population size should exhibit substantial variance. Due
to exponential expansion of the germline from the small
number of founding cells, modest variation of cell cycle
parameters between individual founding cells would be
amplified into substantially higher levels of variance at
later stages of development. Using a stochastic model to
reconstruct the germ-cell development in human females,
we show that the large variance observed in counts of
human oocytes is consistent with the initial origin of these
cells from a much smaller FGC population than is often
assumed.
2. Overview
Our approach enables us to derive an estimate of the ini-
tial FGC population size on the basis of reliable data
describing the number of oocytes present at various later
stages of human development, when ovarian tissue is
more readily available for analysis. Cytological counts of
oocytes have shown not only that the size of the female
germ cell population varies substantially between individ-
uals of the same age, but also that its age-dependent mag-
nitude is biphasic [13]. Numbers of germ cells increase
during the first half of fetal development and then begin
a progressive decline that extends throughout the repro-
ductive years. The initial phase initiates with the separa-
tion of the germline from the soma, probably taking place
no later than the peri-implantation stage (about 9 days
after fertilization) [13,14]. Following this initial establish-
ment, mitotically active oogonia undergo an exponential
increase in number while only a small fraction of them
show any sign of degeneration. At about five months of
fetal development (5/12 = 0.42 year), the population
reaches its peak as the oogonia enter into meiotic arrest.
The germ cells (now defined as primary oocytes) become
invested by layers of nurturing granulosa cells to form the
follicles, which are readily recognized and enumerated by
microscopic examination. The second phase of female
germline development, spanning the period from the late
embryonic stage to the onset of menopause in adult
females (t = 0.42 – 52 years), is characterized by a progres-
sive decline in the number of follicles, largely due to
apoptosis [15]. This decline is approximately exponential,
but is accelerated in women older than age 38 [16].
Among the million or so oocytes present late in fetal
development of the mother, the vast majority will
undergo apoptosis while only 300–400 will progress fully
through maturation and undergo ovulation during the
woman's reproductive life. Eventually, when the number
of oocytes in the resting pool falls below 1000, meno-
pause occurs [16].
3. Germ-Cell Kinetics
Oogonium-Birth Model
The stochastic model we use to describe germline devel-
opment consists of two separate dynamic components
(Figure 1). During the early embryonic stage (t = 0 – 0.42
year), a pure-birth model [11] can be used to describe the
rapid proliferation of oogonia. At time t = 0, the germline
is founded by a ancestral cells (FGCs) that are newly sep-
arated from the soma. At time t (0 ≤ t ≤ 0.42), the number
X(t) of oogonia follows a negative-binomial probability
distribution [11]:
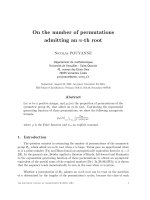
The number of female germ cells in humans undergoes three distinct rate changes, as diagrammed here and defined in the modelFigure 1
The number of female germ cells in humans undergoes three
distinct rate changes, as diagrammed here and defined in the
model. For the sake of clarity, the age coordinate is
expanded artificially during the embryonic phase. The prolif-
erative phase initiates at the time of germline-soma separa-
tion (ca. 9 days after fertilization; t = 0.0 year) and ends after
5 months of gestation (t = 0 – 0.42 year). The declining
phases begin later in fetal life and continue into adulthood (t
= 0.42 – 52 years) with an accelerated rate of oocyte deple-
tion beginning at age 38 [16]. The dotted line shown during
the embryonic stage emphasizes that oogonial cell counts
from this period are inaccessible to reliable determination.
1.E+00
1.E+02
1.E+04
1.E+06
0.0 0.42 0.75 38 Age (years)
Number of germ cells
Embryonic stage Post-embryonic stage
Birth
Pr[ ( ) ] ( ) ( ) . ( )Xt n
n
a
ee
ta tna
==
−
−
−
−−−
1
1
11
λλ
Theoretical Biology and Medical Modelling 2005, 2:32 />Page 3 of 6
(page number not for citation purposes)
Here
λ
is the oogonial division rate. The expectation and
variance of the random variable X(t) are E[X(t)] = ae
λ
t
,
Var[X(t)] = ae
λ
t
(e
λ
t
-1) ≈ ae
2
λ
t
, respectively. Note that the
approximation holds true if e
λ
t
is large (for humans,
ae
λ
·0.42
≥ 10
6
). The moment ratio a ≈ E
2
[X(t)]/Var[X(t)]
then yields an estimate of the number of FGCs.
If one were dependent on using the pure-birth model to
estimate a, this could be accomplished by collecting
gonadal tissues from a series of abortices and establishing
the total number of oogonia in each specimen (x
i
(t
i
), i =
1,2, , I) by microscopic evaluation. However, reliance on
access to fetal tissue clearly has several drawbacks. First,
many spontaneous abortions are associated with chromo-
somal aberrations [17] and may therefore display an
abnormal pattern of growth kinetics. Second, access to
non-diseased fetuses for research is limited by ethical con-
cerns. And, third, microscopic examination of fetal tissues
from an early stage of pregnancy is technically challeng-
ing. The boundaries of fetal gonad are not clearly demar-
cated from surrounding cell types and the oogonial cells
are difficult to distinguish from the somatic cells. On the
other hand, the ovarian follicles that arise at later stages of
development are cytologically distinct and can be enu-
merated with precision. The following derivation of a
pure-death model for germ cell dynamics enables us to
use this more precise enumeration to advantage.
Oocyte-Death Model
A pure-death model, as described by Bailey [11], can be
used to obtain an explicit formulation for the declining
phase of germ cell numbers after proliferation has ceased
and the apoptotic decline has begun (t = 0.42 – 52 years).
Consistent with the findings of Faddy et al. [16], we per-
mit the rate of oocyte loss from the resting pool to vary
with age t. The cumulative rate function f(t) is defined as
follows:
Conditional on the initial number X(t) = n of oocytes at t
= 0.42 year, the number of oocytes in the resting pool at
age t (0.42 ≤ t ≤ 52 years) now follows a binomial proba-
bility distribution [11]:
4. Estimation Methods
The unknown parameters (a,
λ
,
µ
1
,
µ
2
) can be estimated
using two different methods. The moment-based method
estimates only the number of FGCs (parameter a), while
the maximum likelihood method estimates all four
parameters (a,
λ
,
µ
1
,
µ
2
) simultaneously.
Moment-Based Method
As mentioned above regarding the oogonium-birth
model, the random variable X(t) follows a negative bino-
mial distribution, and therefore the moment ratio
E
2
[X(t)]/Var[X(t)] yields an estimate of a. This relation-
ship holds true with oocyte depletion (oocyte-death
model) following the period of exponential growth. As a
verification, notice first that the probability-generating
function for the negative binomial probability distribu-
tion at t = 0.42 is P
X(0.42)
(s) = {1 - e
λ
·0.42
(1 - s
-1
)}
-a
. There-
fore, the probability-generating function for the binomial
probability distribution at t > 0.42 (conditional on X
(0.42) = n) is P
X(t)|X(.42)
(s) = ((1 - e
- f(t)
) + e
- f(t)
s)
n
. The com-
pounded probability-generating function (t > 0.42) is
then given by P
X(t)
(s) = . The
mean and variance for oocyte population size in adult
women can be derived from the first and second deriva-
tives of ,
.
Maximum Likelihood Estimation (MLE)
Although the moment ratio is simple to compute, its der-
ivation requires a large sample size and provides no esti-
mates of the oogonium-birth rate (
λ
) and the oocyte-
death rates (
µ
1
,
µ
2
). The maximum likelihood method is
not subject to these difficulties. To derive the likelihood
function, note first that Equation 3 (pure-death model) is
a probability function conditional on Pr[X(0.42) = n]
(Equation 1; pure-birth model). For each of the oocyte
counts obtained from a series of autopsies (x
i
(t
i
), i = 1,2, ,
I) during the post-embryonic stage (0.42 ≤ t
i
≤ 52 years),
we can combine them to define:
Since each observation x
i
(t
i
) makes a contribution like L(x
i
| a,
λ
,
µ
1
,
µ
2
) to the likelihood, the final likelihood of
the entire data set is the product of all such terms (0.42 ≤
t
i
≤ 52 years), such that . To
maximize , note that the term
is (for a fixed x
i
(t
i
) but var-
iable n) a negative binomial up to a constant. Therefore,
we use importance sampling [18] from negative binomi-
als to evaluate the likelihood in Equation 4 numerically.
In practice, we first generate samples of n from this distri-
bution and then sum the values of the negative binomial
probabilities for a given the sampled values of n. We
obtain stable likelihood estimates with as few as 100 sam-
ples of n. During the process of searching the parameter
space, we also restrict the parameter a to be a positive inte-
ger (i.e., a = 1,2,3, ).
ft
tt
tt
()
(.),.
(.)(),
.(=
−≤<
−+− ≤<
µ
µµ
1
12
0 42 0 42 38
38 0 42 38 38 52
22)
Pr[ ( ) ( . )] Pr[ ( ) ( . ) ] ( ) (
()
Xt X Xt mX n
n
m
ee
ft m
042 042 1== ==
−
−−fft nm()
). ()
−
3
{
()
()
}
()
1
1
11
+
−
−−
⋅
−
−
es
es
ft
a
λ−
0.42 ft()
PsEXtP ae
Xt Xt() ()
(): [ ()] ()=
′
=
⋅
1
λ−
0.42 ft()
Var X t P P P ae
Xt Xt Xt
ft
[ ()] () () () (
() () ()
.()
=
′′
+
′
−
′
()
=
⋅−
11 1
2
042
λ
eeeae
ft ft ft
λλ
⋅− − ⋅−
+− ≈
042 042
12
.() () (.())
)
2
Lx a
n
x
ee
n
inx
i
ft x ft nx
i
ii i i
(,,,) ( )( )
() ()
λµ µ
12
1=
−⋅
−
≥
−−−
∑
11
1
14
042 042
a
ee
ana
−
−
−−−
()( ). ()
λλ
L
LLxta
ii
i
=
∏
((), , )
λ,µ µ
12
L
n
x
ee
i
ft x ft nx
ii i i
−
−−−
()( )
() ()
1
Theoretical Biology and Medical Modelling 2005, 2:32 />Page 4 of 6
(page number not for citation purposes)
5. Analysis of Oocyte-Counting Data
Using the above algorithms, we have analyzed published
oocyte counts from 102 human females [16,19]. These
computations yield MLEs of the four parameters, which
are: = 2, = 31.2/year (95% CI: 30.3 – 31.9), =
0.079/year (0.067 – 0.090) and = 0.248/year (0.204 –
0.283). The 95% confidence intervals (95% CI) are based
on Markov chain Monte Carlo methods [20]. The
expected number of oocytes (solid curve) and the point-
wise 80% CI (shaded region) for the predicted counts on
the basis of the model are shown together with oocyte
counts in Figure 2.
The large MLE of
λ
justifies our use of the moment-based
method to estimate the parameter a. To enable moment-
based analysis we have grouped the data into 5 discrete
age intervals [16] and calculated the mean and variance
for each age interval. Computing the moment ratio index
for each age interval yields the values shown (Table 1) and
an overall average of = 2.7. This value agrees well with
the MLE and with those values ( = 2 – 9) that were
derived from the segregation of genetic markers in the
mouse [4-10].
6. Discussion
Our estimated values of the founding germ cell number a
(MLE = 2, moment estimate = 2.7) differ substan-
tially from the estimates made in previous studies [2,3]
that relied on cytochemical staining of embryonic mate-
rial. This discrepancy might best be explained by assum-
ing that not all cells sharing the same cytological
phenotype (alkaline phosphatase staining) in common
with a FGC population proceed through that course of
development. This view is supported by the observation
that alkaline phosphatase is present not only in germ cells
of the mouse, but also in somatic cells that surround these
germ cells [21]. Recent description of cytochemical mark-
ers that are more specifically restricted to the germ cells
confirms that the expression of alkaline phosphatase
occurs in a wider spectrum of cell types [22].
Genetic analysis provides a more stringent approach to
germ cell enumeration in the mouse, where experimental
crosses permit reliable determination of marker transmis-
sion. If a mutation or other stably transmissible cellular
property arises early in development, only a subset of cells
will display the mutation at later stages. Such mosaic pres-
ence of the trait provides an opportunity to help define
the stage at which the germ cell precursors (FGFs) had
become segregated from the predominant somatic cell
population [23,24]. If the extent of mosaicism were
closely similar between soma and germline, this would
indicate that the size of the FGC population is large, since
it would have provided a representative sample of the
mosaicism originally present throughout the early
embryo. To the contrary, if the correlation between
somatic and germline mosaicism is weak, the number of
FGCs must be limited and the transmission of any
somatic markers to offspring should be more stochastic.
This type of analysis [4-10] generally predicts small
number of FGCs, consistent with our derivation from the
stochastic modeling of oocyte counts.
The present statistical analysis indicates that germ cell pro-
liferation occurring during embryogenesis is characterized
both by a small FGC population ( = 2) and by a rapid
Shown in this diagram are published counts of follicles per individual [16,19] obtained by autopsy in adult stages, when each follicle contains a single oocyteFigure 2
Shown in this diagram are published counts of follicles per
individual [16,19] obtained by autopsy in adult stages, when
each follicle contains a single oocyte. The data are analyzed
with the compound birth-then-death model as described in
the text. Observations with follicle counts < 100 were con-
sidered unreliable and were excluded from the analysis. The
solid line represents the expected number of oocytes at each
age in the postembryonic stages based on the model given
these data. The shaded area is the pointwise 80% confidence
interval. The MLEs of the parameters are: = 2, = 31.2/
year, = 0.079/year, = 0.248/year.
0 1020304050
age
follicle counts
10
2
10
3
10
4
10
5
10
6
ˆ
a
ˆ
λ
ˆ
µ
1
ˆ
µ
2
ˆ
a
ˆ
λ
ˆ
µ
1
ˆ
µ
2
ˆ
a
ˆ
a
Table 1: Oocyte-counting data from Faddy et al. [16].
Age Sample Size Mean S.E.
Ratio Index
19–30 years 5 78980 15580 5.1
31–35 years 13 25300 4860 2.1
36–40 years 14 21450 2650 4.7
41–45 years 32 7320 1450 0.8
>45 years 36 1880 310 1.0
ˆ
a
ˆ
a
ˆ
a
ˆ
a
Theoretical Biology and Medical Modelling 2005, 2:32 />Page 5 of 6
(page number not for citation purposes)
rate of cell division ( = 31.2/year). Although we have
estimated all four parameters of the model (a,
λ
,
µ
1
and
µ
2
) in concert using the oocyte-counting data collected
post-embryonically, the division rate
λ
can be verified
independently by microscopic study of embryonic tissues.
In a recent publication, Bendsen et al. [25] reported their
evaluation of 10 fetal gonad specimens between the ages
of 6 and 9 weeks. Using morphological clues to distin-
guish germ cells from somatic cells, these authors were
able to establish the number of germ cells per tissue sam-
ple throughout this period. We used exponential regres-
sion against fetal age t to analyze the data of Bendsen et al.
and obtained a direct estimate of = 35.4/year (95% CI:
17.2/year – 53.7/year). Thus, our estimate of the division
rate of the FGC is in good agreement with the experimen-
tal data.
It has recently been reported [26] that mammalian ovaries
contain stem germ cells that are competent to enter into
mitosis at a late stage of development. If confirmed by fur-
ther work, this finding would necessitate some modifica-
tion of the model proposed here. However, additional
computation suggests that the potential effect on the esti-
mate of a is likely to be small. To show this, we replace the
pure death model for oocyte dynamics with a birth-and-
death model. Also we assume that both the cell-death rate
µ
and the cell-birth rate
ν
(
µ
>
ν
) are constant during the
post-embryonic stage (t > 0.42). The re-derived com-
pounded probability generating function then becomes
. From this, we obtain the expectation (E[X(t)] = ae
λ
.0.42-(
µ
-
ν
)t
) and the variance of the oocyte population. Numerical
evaluations of Var[X (t)] using a range of parameter values
suggest that the variance and the estimate of a are largely
determined by the observed difference between
µ
and
ν
(Var[X(t)] ≈ ae
2(
λ
·0.42-(
µ
-
ν
)t)
). In other words, our conclu-
sion will change very little as long as the cell-death rate
µ
is substantially larger than the cell-birth rate
ν
(even if
ν
>
0). Because the observation on continued proliferation of
germ cells in the adult female is new [26] and additional
evidence will need to be collected, a fuller discussion of
the modeling issues is deferred here.
The validity of our model clearly relies on certain assump-
tions that might be refuted by future analyses of tissue
dynamics. Specifically, we have assumed that growth of
the germ cell population is exponential and involves no
significant cell death during gestation and also that the
subsequent apoptotic decline is exponential. Further-
more, we have assumed that the sub-populations derived
from each individual FGC grow and decline independ-
ently of one another. In addition, the model depends cru-
cially on the concept that the cessation of proliferation
and entry into meiotic arrest is controlled by the stage of
development rather than by the size of the germ cell pop-
ulation. A more detailed analysis than the present report
would be required to establish how robust the proposed
mechanism may be to departures from each of these
assumptions. There clearly are numerous models of
greater complexity that could be proposed to account for
the observed substantial variance among human oocyte
populations. Our realization that the distribution of
oocyte counts between individuals can be explained so
simply by the computation described here encourages us
to suggest that the small-founder effect may be a predom-
inant cause of this variance.
Finally, we note that the squared root of an inversed
moment ratio is mathematically equivalent to the coeffi-
cient of variation – the quotient of the standard deviation
divided by the mean. This parameter is commonly used in
biostatistics to characterize the extent of random variation
across a broad range of biological processes. This coinci-
dence suggests that the founder-effect interpretation that
we have proposed may have broader applications.
Competing interests
The author(s) declare that they have no competing
interests.
Authors' contributions
CJZ carried out the initial mathematical derivations and
analyzed the oocytes-counting data using the moment-
ratio method. EGL and SHM extended the mathematical
derivations and completed the maximum-likelihood esti-
mation. BB reviewed the biological implications of the
models. All authors participated in preparations and revi-
sions of the manuscript.
Acknowledgements
We would also like to acknowledge financial support from the National
Institutes of Health (BB, EGL & SHM) and the National Institute of Occu-
pational Safety and Health (CJZ).
References
1. Hubbard EJA, Pera RAR: A germ-cell odyssey: fate, survival,
migration, stem cells and differentiation. Meeting on germ
cells. EMBO Rep 2003, 4:352-7.
2. Lawson KA, Hage WJ: Clonal analysis of the origin of primordial
germ cells in the mouse. Ciba Foundation Symposium 1994,
182:68-91.
3. McMahon A, Fosten M, Monk M: X-chromosome inactivation
mosaicism in the three germ layers and the germ line of the
mouse embryo. J Embryol Exp Morphol 1983, 74:207-20.
4. Mintz B: Hermaphroditism, sex chromosomal mosaicism and
germ cell selection in allophenic mice. J Animal Sci 1968,
27(suppl 1):51-60.
5. Mintz B: Gene control of mammalian differentiation. Annu Rev
Genet 1974, 8:411-70.
ˆ
λ
ˆ
λ
Ps e
esv
e
Xt()
.
(
(
()
() ()
() (
=− −
−−
−
⋅
−
−
11
1
1
042
λ
µ−
µ−
µ−
µ−
sv
sv
v)t
v)t
−−
−
s
a
)
µ
Publish with BioMed Central and every
scientist can read your work free of charge
"BioMed Central will be the most significant development for
disseminating the results of biomedical researc h in our lifetime."
Sir Paul Nurse, Cancer Research UK
Your research papers will be:
available free of charge to the entire biomedical community
peer reviewed and published immediately upon acceptance
cited in PubMed and archived on PubMed Central
yours — you keep the copyright
Submit your manuscript here:
/>BioMedcentral
Theoretical Biology and Medical Modelling 2005, 2:32 />Page 6 of 6
(page number not for citation purposes)
6. Russell LB: Genetic and functional mosaicism in the mouse. In
Role of Chromosomes in Development Edited by: Locke M. Academic,
New York; 1964:153-81.
7. Russell LB: Analysis of the albino-locus region of the mouse. II.
Mosaic mutants. Genetics 1979, 91:141-7.
8. Searle AG: Evidence from mutable genes concerning the ori-
gin of the germline. Basic Life Sci 1978, 12:209-24.
9. Soriano P, Jaenisch R: Retroviruses as probes for mammalian
development: allocation of cells to the somatic and germ cell
linkages. Cell 1986, 46:19-29.
10. Wilkie TM, Brinster RL, Palmiter RD: Germline and somatic
mosaicism in transgenic mice. Dev Biol 1986, 118:9-18.
11. Bailey NTJ: The elements of stochastic processes with applications to the
natural sciences John Wiley & Sons, New York; 1964.
12. Yule GU: A mathematical theory of evolution, based on the
conclusions of Dr. J. C. Willis, F.R.S. Proc R Soc London Ser B
1924, 213:21-87.
13. Gosden RG: Ovulation 1: Oocyte development throughout
life. In Gametes – The Oocyte Edited by: Grudzinskas JG, Yovich JL.
Cambridge University Press, Cambridge; 1995:119-149.
14. Wilcox AJ, Baird DD, Weinberg CR: Time of implantation of the
conceptus and loss of pregnancy. N Engl J Med 1999, 340:1796-9.
15. Tilly JL: Commuting the death sentence: how oocytes strive
to survive. Nat Rev Mol Cell Biol 2001, 2:838-48.
16. Faddy MJ, Gosden RG, Gougeon A, Richardson SJ, Nelson JF: Accel-
erated disappearance of ovarian follicles in mid-life: implica-
tions for forecasting menopause. Hum Reprod 1992, 7:1342-6.
17. Boue J, Bou A, Lazar P: Retrospective and prospective epidemi-
ological studies of 1500 karyotyped spontaneous human
abortions. Teratology 1975, 12:11-26.
18. Morgan BJT: Applied Stochastic Modelling Arnold Texts in Statistics,
Oxford University Press; 2000.
19. Leidy LE, Godfrey LR, Sutherland MR: Is follicular atresia
biphasic? Fertil Steril 1998, 70:851-9.
20. Gilks WR, Richardson S, Spiegelhalter DJ, eds: Markov Chain Monte
Carlo in Practice Chapman & Hall, New York; 1996.
21. MacGregor GR, Zambrowicz BP, Soriano P: Tissue non-specific
alkaline phosphatase is expressed in both embryonic and
extraembryonic lineages during mouse embryogenesis but is
not required for migration of primordial germ cells. Develop-
ment 1995, 121:1487-96.
22. Saitou M, Barton SC, Surani MA: A molecular programme for
the specification of germ cell fate in mice. Nature 2002,
418(6895):293-300.
23. Nesbitt MN, Gartler SM: The Applications of Genetic Mosai-
cism to Developmental Problems. Annu Rev Genet 1971,
5:143-162.
24. McLaren A: Numerology of development. Nature 1972,
239(5370):274-6.
25. Bendsen E, Byskov AG, Laursen SB, Larsen HP, Andersen CY, West-
ergaard LG: Number of germ cells and somatic cells in human
fetal testes duringthe first weeks after sex differentiation.
Hum Reprod 2003, 18:13-8.
26. Johnson J, Canning J, Kaneko T, Pru JK, Tilly JL: Germline stem cells
and follicular renewal in the postnatal mammalian ovary.
Nature 2004, 428:145-50.