Báo cáo y học: "A mathematical model of the euglycemic hyperinsulinemic clamp" ppsx
Bạn đang xem bản rút gọn của tài liệu. Xem và tải ngay bản đầy đủ của tài liệu tại đây (322.05 KB, 11 trang )
BioMed Central
Page 1 of 11
(page number not for citation purposes)
Theoretical Biology and Medical
Modelling
Open Access
Research
A mathematical model of the euglycemic hyperinsulinemic clamp
Umberto Picchini*
1
, Andrea De Gaetano
1
, Simona Panunzi
1
,
Susanne Ditlevsen
2
and Geltrude Mingrone
3
Address:
1
CNR-IASI BioMatLab, Rome, Italy,
2
Department of Biostatistics, University of Copenhagen, Denmark and
3
Istituto di Medicina Interna
e Geriatria, Divisione di Malattie del Ricambio, Università Cattolica del Sacro Cuore, Policlinico Universitario "A. Gemelli", Rome, Italy
Email: Umberto Picchini* - ; Andrea De Gaetano - ;
Simona Panunzi - ; Susanne Ditlevsen - ;
Geltrude Mingrone -
* Corresponding author
Abstract
Background: The Euglycemic Hyperinsulinemic Clamp (EHC) is the most widely used
experimental procedure for the determination of insulin sensitivity, and in its usual form the patient
is followed under insulinization for two hours. In the present study, sixteen subjects with BMI
between 18.5 and 63.6 kg/m
2
were studied by long-duration (five hours) EHC.
Results: From the results of this series and from similar reports in the literature it is clear that, in
obese subjects, glucose uptake rates continue to increase if the clamp procedure is prolonged
beyond the customary 2 hours. A mathematical model of the EHC, incorporating delays, was fitted
to the recorded data, and the insulin resistance behaviour of obese subjects was assessed
analytically. Obese subjects had significantly less effective suppression of hepatic glucose output and
higher pancreatic insulin secretion than lean subjects. Tissue insulin resistance appeared to be
higher in the obese group, but this difference did not reach statistical significance.
Conclusion: The use of a mathematical model allows a greater amount of information to be
recovered from clamp data, making it easier to understand the components of insulin resistance in
obese vs. normal subjects.
Background
With the growing epidemiological importance of insulin
resistance states such as obesity and Type 2 Diabetes Mel-
litus, T2DM, and with increasing clinical recognition of
the impact of the so-called metabolic syndrome, the
assessment of insulin sensitivity has become highly rele-
vant to metabolic research.
The experimental procedures currently employed to
gather information on the degree of insulin resistance of a
subject are the Oral Glucose Tolerance Test (OGTT), the
Intra-Venous Glucose Tolerance Test (IVGTT), the Euglyc-
emic Hyperinsulinemic Clamp (EHC), the Hyperglycemic
Clamp, the insulin-induced hypoglycemia test (K
ITT
), and
less commonly used methods based on tracer administra-
tion [1-3]. Of these, the EHC is considered the tool of
choice in the diabetological community, in spite of its
labor-intensive execution, because it is usually considered
that the results obtained can be interpreted simply [4,5].
The favor with which the EHC is viewed in this context
stems in part from the belief that while mathematical
models of the glucose insulin system make untenable
Published: 03 November 2005
Theoretical Biology and Medical Modelling 2005, 2:44 doi:10.1186/1742-4682-2-44
Received: 05 August 2005
Accepted: 03 November 2005
This article is available from: />© 2005 Picchini et al; licensee BioMed Central Ltd.
This is an Open Access article distributed under the terms of the Creative Commons Attribution License ( />),
which permits unrestricted use, distribution, and reproduction in any medium, provided the original work is properly cited.
Theoretical Biology and Medical Modelling 2005, 2:44 />Page 2 of 11
(page number not for citation purposes)
assumptions, the EHC approach is relatively assumption-
free, or model-independent.
In general, insulin resistance expresses an imbalance
between the amount of pancreatic insulin secreted in
response to a glucose load and the levels of plasma glu-
cose attained. In other words, in order to obtain the same
plasma glucose concentration, higher levels of plasma
insulin are necessary in insulin-resistant subjects than in
normal controls [6].
The clamp, as usually employed, yields easy-to-compute
indices, which are commonly used as measures of insulin
resistance. The M value [5] is defined as the average glu-
cose infusion rate over a period of 80–120 minutes from
the start of the insulin infusion. The M/I ratio is the ratio
of the M value to the average plasma insulin concentra-
tion during the same period. If a two-step clamp is per-
formed (though see negative comments [4]) the ∆M/∆I
ratio is defined as the increment of M produced by raising
the insulin infusion rate over the corresponding incre-
ment of I. The use of these indices, however, makes two
fundamental assumptions: first, that at the end of 120' of
insulin infusion the experimental subject is at steady state
with regard to glucose uptake rate; and second, that the
glucose uptake rate increases linearly with increasing
insulinemia, either throughout the insulin concentration
range (when using the M/I index for characterizing the
subject's response) or between successive insulin concen-
trations reached in the two-step clamp (when using the
∆M/∆I index). These assumptions are, however, only a
first approximation to the real state of things. On the one
hand, it has already been shown that if a clamp experi-
ment is continued beyond the customary 2 hours " [ ]
glucose utilization increases progressively through(out)
five hours of moderate hyperinsulinemia." [7]. On the
other hand [8], carefully measured average glucose uptake
rates at two hours are nonlinearly related to increasing lev-
els of plasma insulin, and from the reported data, glucose
uptake may approach a maximal value asymptotically as
insulinemia increases. In spite of these observations, the
vast majority of experimental diabetologists ([9], [4],
[10]) consider the EHC the procedure of choice and many
studies have already been conducted using it. It would be
interesting to be able to reinterpret this vast mass of obser-
vations using a more explicitly quantitative approach. The
goal of the present work is to formulate a model of the
EHC and fit it to EHC data recorded from human subjects.
The structure of the model we have developed allows us to
discuss the mechanisms whereby a sufficiently long insu-
lin infusion might be able to increase glucose uptake pro-
gressively, and to explore the possible implications of the
commonly observed insulin resistance pattern in obese
subjects.
Methods
Subjects
Sixteen subjects were enrolled in the study, 8 normal vol-
unteers and 8 patients from the Obesity Outpatient Clinic
of the Department of Internal Medicine at the Catholic
University School of Medicine. For one normal subject the
recorded glycemia values were accidentally lost and this
subject was therefore discarded from the following math-
ematical analysis. The subjects had widely differing BMIs
(from 18.5 to 63.6). All subjects were clinically euthyroid,
had no evidence of diabetes mellitus, hyperlipidemia, or
renal, cardiac or hepatic dysfunction and were undergoing
no drug treatments that could have affected carbohydrate
Table 2: Definitions of the state variables.
Variables
G(t) [mM] plasma glucose concentration at time t
I(t) [pM] serum insulin concentration at time t
t [min] time from insulin infusion start
T
gx
(t) [mmol/min/kgBW] glucose infusion rate at time t
T
ix
(t) [pmol/min/kgBW] insulin infusion rate at time t
T
gh
(t) [mmol/min/kgBW] net Hepatic Glucose Output (HGO) at time t
Table 1: Anthropometric and metabolic characteristics for lean (BMI ≤ 25) and overweight or obese (BMI > 25) subjects.
Lean subjects (n = 7) Overweight and Obese subjects (n = 8) p
BMI [kg/m
2
] 20.0 [18.5, 22.7] 37.0 [27.8, 63.6] 0.001
BSA [m
2
] 1.55 [1.49, 1.73] 2.1 [1.83, 2.38] 0.001
G
fast
[mM] 3.67 [3.4, 5.4] 5.2 [4.61, 5.9] 0.024
I
fast
[pM] 27.8 [13.9, 49.4] 123.7 [79.2, 152.9] 0.001
I
max
[pM] 482.14 [464.5, 526.9] 606.3 [497.3, 683.2] 0.004
Values are median [min, max]. All comparisons were performed by the Mann-Whitney U-test. BSA is the Body Surface Area [m
2
] calculated via the
DuBois formula (BSA = 0.20247 · height
0.725
[m] · weight
0.425
[kg])
Theoretical Biology and Medical Modelling 2005, 2:44 />Page 3 of 11
(page number not for citation purposes)
or insulin metabolism. The subjects consumed a weight-
maintaining diet consisting of at least 250 g of carbohy-
drate per day for 1 week before the study. Table 1 reports
the main anthropometric and metabolic characteristics of
the subjects.
The study protocol followed the guidelines of the Medical
Ethics Committee of the Catholic University of Rome
Medical School; written informed consent was obtained
from all subjects.
Experimental protocol
Each subject was studied in the postabsorptive state after
a 12–14 h overnight fast. Subjects were admitted to the
Department of Metabolic Diseases at the Catholic Univer-
sity School of Medicine in Rome the evening before the
study. At 07.00 hours on the following morning, the infu-
sion catheter was inserted into an antecubital vein; the
sampling catheter was introduced in the contralateral dor-
sal hand vein and this hand was kept in a heated box
(60°C) in order to obtain arterialized blood. A basal
blood sample was obtained in which insulin and glucose
levels were measured. At 08.00 hours, after a 12–14 h
overnight fast, the Euglycemic Hyperinsulinemic glucose
Clamp was performed according to [5]. A priming dose of
short-acting human insulin was given during the initial 10
min in a logarithmically decreasing manner so that the
plasma insulin was raised acutely to the desired level. Dur-
ing the five-hour clamp procedure, the glucose and insu-
lin levels were monitored every 5 min and every 20 min
respectively, and the rate of infusion of a 20% glucose
solution was adjusted during the procedure following the
published algorithm [5]. Because serum potassium levels
tend to fall during this procedure, KCl was given at a rate
of 15–20 mEq/h to maintain the serum potassium
between 3.5 and 4.5 mEq/l.
Serum glucose was measured by the glucose oxidase
method using a Beckman Glucose Analyzer II (Beckman
Instruments, Fullerton, Calif., USA). Plasma insulin was
measured by microparticle enzyme immunoassay (Abbott
Imx, Pasadena, Calif., USA).
Modelling
In order to explain the oscillations of glycemia occurring
in response to hyperinsulinization and to continuous glu-
cose infusion at varying speeds, we hypothesized the fol-
lowing system:
where
ω(s) = α
2
se
-αs
, T
gx
(s) = 0 ∀s [-τ
g
,0] and T
ix
(0) = T
ixb
.
T
gx
(t) and T
ix
(t) are (input or forcing) state variables of
which the values are known at each time; the state varia-
bles and the parameters are defined in tables 2 and 3. The
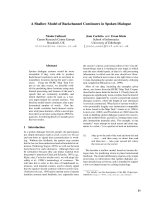
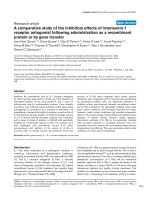
model is diagrammatically represented in Figure 1.
Equations (1) and (2) express the variations of plasma
glucose and plasma insulin concentrations. Equation (3)
represents the rate of net Hepatic Glucose Output, starting
at maximal HGO at zero glucose and zero insulin and
decaying monotonically with increases in both glucose
and effective insulin concentrations in the plasma.
The variation of glucose concentration in its distribution
space may be attributed to the external glucose infusion
rate, liver glucose output and delayed-insulin-dependent
as well as insulin-independent glucose tissue uptake.
Infused glucose raises glycemia after a delay τ
g
due to the
time required to equilibrate the intravenously infused
quantity throughout the distribution space. The net HGO
is assumed to be equal to T
ghb
at the beginning of the
experiment and to decrease toward zero as glycemia or
insulinemia levels increase. Serum insulin, after a delay
depending on its transport to the periphery and the sub-
sequent activation of cellular membrane glucose trans-
porters, affects glucose clearance through equation (1)
and the glucose synthesis rate through equation (3).
We hypothesize that ω(s) represents the density of the
metabolic effect at time t for unit serum insulin concentra-
tion at time t - s (s ≤ t). We could choose ω(s) as a single
function or as a linear combination of functions (with
positive coefficients adding up to unity) from the family
of Erlang-functions:
The first two functions of the family are
ω
(1)
(s) = αe
-α s
dG(t)
dt
Tt- Tt
V
T
G(t)
0.1+G(t)
K s)I(t-s
gx g gh
g
xg xgI
=
()
+
()
()
−−
τ
ω( ))ds G(t), G(0)=G
b
0
1
+∞
∫
)
dI(t)
dt
T G(t) + T t)
V
K I(t), I(t)=I t 0 2)
iG ix
i
xi b
=
()
−∀≤
(
T t)=T exp - G(t) s)I(t-s) ds T T
gh gh max
0
+
gh g
(,()λω(
∞
∫
=0
hhb ghmax b b
T exp(- G I=λ))3
ω
α
α,
α(k)
k
k-1 - s
(s)=
k-1)!
se k s
(
,, .∈∈∈
++
\`\
0
Theoretical Biology and Medical Modelling 2005, 2:44 />Page 4 of 11
(page number not for citation purposes)
ω
(2)
(s) = α
2
se
-α s
We note that while ω
(1)
(s) is monotonically decreasing,
ω
(2)
(s) increases to a maximum at s = 1/α, then decreases
monotonically and asymptotically to zero. We choose the
second Erlang-function as our kernel because it is the sim-
plest member of the family with a peak. This embodies
the concept that, in order to produce its metabolic effect,
insulin has to reach the tissues and activate intracellular
enzymatic mechanisms (hence its maximal action on glu-
cose metabolism is delayed) and that natural breakdown
of insulin induces a progressive loss of effect of increased
concentrations of the hormone as they become more dis-
tant in the past. A high α value determines a concentrated
kernel corresponding to a fast-rising, fast-decaying effect
of insulin on peripheral tissues. We therefore set
and we define as the average
time for the metabolic effect of insulin in changing glyc-
emia. The insulin-independent glucose tissue uptake
process is modelled as a Hill function rapidly increasing
to its (asymptotic) maximum value T
xg
; thus for glycemia
values near 2 mM the insulin-independent glucose tissue
uptake is already close to its maximum. This formulation
is intended to represent the aggregated apparent zero-
order (fixed) glucose utilization mechanism at rest
(mainly the brain and heart [11]; W. Sacks in [12] p. 320),
with the mathematical and physiological requirement
that glucose uptake tends to zero as glucose concentration
in plasma approaches zero.
The variation of insulin concentration in its distribution
space (equation 2) may be thought of as due to the exter-
nal insulin infusion, glucose dependent pancreatic insulin
secretion and the apparently first-order insulin removal
from plasma.
We use steady-state conditions to decrease the number of
free parameters to be estimated: at steady state, before the
start of the clamp (G = G
b
, I = I
b
, T
gx
= T
ix
= 0), we have
Therefore the parameters T
ghb
, T
xg
, and T
iG
are completely
determined by the values of the other parameters (and ρ
is determined from
α
).
Statistical analysis
The system (1), (2) and (3) has been numerically inte-
grated by means of a fourth order Runge-Kutta scheme;
the solutions thus obtained have been fitted by Weighted
Least Squares (WLS) separately on each subject's glycemia
and insulinemia time-points, estimating only the free
parameters G
b
, I
b
, K
xgI
, K
xi
, T
ghmax
, V
g
, V
i
,
α
, τ
g
, λ. The sta-
tistical weight associated with each observed glucose and
insulin concentration point has been defined as 1/CV
2
,
where CV is the coefficient of variation, equal to 0.015 for
glucose and 0.07 for insulin [13]. The weighted quadratic
loss function was minimized by a Nelder-Mead simplex
algorithm in order to obtain the WLS parameter estimates
for each subject. In order to highlight possible physiolog-
ical differences among subjects depending on their BMI,
two groups were defined: a group consisting of lean sub-
ω( α
2α
s)I(t-s)ds = se I(t-s)ds
-s
0
+∞+∞
∫∫
0
ρ= α α
2
0
+
α
s( se ds
-s
∞
∫
=)/2
TTexp(-GI
T
V
TG
0.1+G
KIG T
ghb ghmax b b
ghb
g
xg b
b
xgI b b xg
=
=
+
−− ⇒=
λ )
0
0
TT
V
KIG
G
G
TG
V
KI T
K
ghb
g
xgI b b
b
b
iG b
i
xi b iG
x
−
+
=
+
−⇒=
(. )01
0
0
iib i
b
IV
G
Table 3: Definitions of the parameters.
Parameters
G
b
[mM] basal glycemia
I
b
[pM] basal insulinemia
T
xg
[mM / min] maximal insulin-independent rate constant for glucose tissue uptake
K
xgI
[min
-1
/pM] insulin-dependent apparent first-order rate constant for glucose tissue uptake at insulinemia I
K
xi
[min
-1
] apparent first-order rate constant for insulin removal from plasma
T
iG
[pM/min/mM] apparent zero-order net insulin synthesis rate at unit glycemia (after liver first-pass effect)
T
ixb
[pmol/min/kgBW] basal insulin infusion rate, which is given by the measured value of T
ix
at time zero according to [18]
T
ghmax
[mmol/min/kgBW] maximal Hepatic Glucose Output at zero glycemia, zero insulinemia
T
ghb
[mmol/min/kgBW] basal value of T
gh
V
g
[L/kgBW] volume of distribution for glucose
V
i
[L/kgBW] volume of distribution for insulin
α
[#] time constant for the insulin delay kernel ω(·)
τ
g
[min] discrete (distributional) delay of the change in glycemia following glucose infusion
λ [mM
-1
pM
-1
] rate constant for Hepatic Glucose Output decrease with increase of glycemia and insulinemia
ρ [#] average delay of insulin effect
Theoretical Biology and Medical Modelling 2005, 2:44 />Page 5 of 11
(page number not for citation purposes)
jects (BMI ≤ 25) and a group consisting of overweight or
obese subjects (BMI > 25). Comparisons of anthropomet-
ric characteristics, metabolic characteristics and model
parameter values between these groups were performed
by the Mann-Whitney U-test owing to the small number
of subjects in each group. Comparisons within groups
were performed by the Wilcoxon test for matched pairs.
Results
Table 1 shows anthropometric characteristics (BMI, BSA),
measured plasma glucose and insulin concentrations
(G
fast
, I
fast
) in the two groups immediately before the
clamp, and the average levels of insulin after 80' of clamp
insulinization (I
max
). All differences in the characteristics
were highly significant, with the median values in the
obese/overweight group markedly higher than those in
the lean group. Even though there was a significant differ-
ence in fasting glycemia between the groups, average lev-
els remained within the norm. However, fasting
insulinemia was more than four-fold higher in the obese/
overweight group, consistent with what is usually
observed in this patient population.
For each parameter fitted and determined, the median,
minimum and maximum from the sample of values
obtained are reported in Table 4.
The predicted basal glycemia and insulinemia values (G
b
,
I
b
) were close to the observed fasting values and were sig-
nificantly different between groups (respectively p = 0.001
and p = 0.002). Lean subjects have a greater ability (about
3-fold higher) to reduce hepatic glucose output when gly-
Schematic representation of the model (1), (2) and (3)Figure 1
Schematic representation of the model (1), (2) and (3).
Theoretical Biology and Medical Modelling 2005, 2:44 />Page 6 of 11
(page number not for citation purposes)
cemia and insulinemia increase (expressed by the param-
eter λ, p = 0.037). The parameter T
iG
(glucose-dependent
pancreatic secretion of insulin) is also significantly differ-
ent between groups (p = 0.011) and the insulin synthesis
rate in obese/overweight subjects is about three-fold
higher than in lean subjects. The delay coefficient τ
g
is of
the order of 3 to 5 minutes, which seems a reasonable
time for glucose infused through an arm vein to be distrib-
uted throughout the body, equilibrate, and be detected by
sampling through the arterialized contralateral arm vein.
In Table 5 the measured values of the M/I index over the
time periods 80'–120' and 260'–300' are shown for nor-
mal and obese/overweight subjects: as expected, the rate
of glucose uptake per unit plasma insulin concentration is
significantly higher in lean subjects in both the 80'–120'
(p = 0.001) and the 260'–300' periods (p = 0.015). How-
ever, whereas in lean subjects the M/I value remains stable
between the two periods (p = 0.6), in the obese/over-
weight group it increases significantly (p = 0.02).
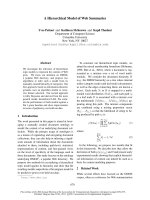
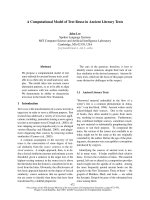
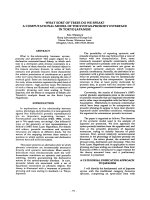
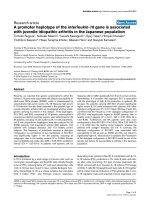
Figures 2, 3, 4, 5 show the time course of observed and
predicted glycemia, observed and predicted insulinemia
and glucose infusion rate for four experimental subjects
(two lean and two obese).
Discussion
It was shown in the early '80s [7] that a significant increase
of glucose tissue uptake during the euglycemic hyperin-
sulinemic clamp could be obtained in obese subjects by
waiting for up to 4–6 hours. This basic observation, con-
firmed by the series of obese subjects studied in the
present work, challenges the assumption that steady state
is attained after 2 hours of the clamp, at least in one
patient subpopulation of great metabolic interest. Nolan
et al. [14], while performing an isoglycemic hyperin-
sulinemic clamp, also demonstrated a marked delay in
activation of whole-body glucose disposal rate, arterio-
venous glucose difference and leg glucose uptake in seven
subjects with Type 2 Diabetes Mellitus and in seven obese
non-diabetic subjects, as compared to healthy controls.
The concept of insulin resistance as a decreased effect of
the hormone on whole body glucose uptake can be made
more specific: on the one hand we might wish to measure
the speed with which a given level of metabolic response
is attained; on the other, we might wish to quantify the
maximal response attainable by a suitably raised insulin
plasma concentration. It is clear now that when using the
classical two-hour clamp, subpopulations of subjects
respond within different time frames. Concentrating on
the level of response at 2 hours would label subjects with
Table 4: Estimated and determined parameter values for lean (BMI ≤ 25) and overweight or obese (BMI > 25) subjects.
Lean (n = 7) Overweight or Obese (n = 8) p
Estimated Parameters
G
b
[mM] 3.67 [2.80, 4.36] 5.11 [4.52, 5.97] 0.001
I
b
[pM] 17.91 [8.59, 63.41] 121.05 [61.55, 256.41] 0.002
K
xgI
[min
-1
/pM] 9.94 · [7.1, 21.2] · 10
-6
6.34 · [0, 13.3] · 10
-6
0.132
K
xi
[min
-1
] 0.039 [0.022, 0.057] 0.029 [0.021, 0.045] 0.203
T
ghmax
[mmol/min/kgBW] 0.069 [0.05, 0.12] 0.128 [0.026, 0.274] 0.105
V
g
[L/kgBW] 0.49 [0.33, 0.90] 0.47 [0.25, 0.67] 0.643
V
i
[L/kgBW] 0.4 [0.36, 0.78] 0.39 [0.21, 0.65] 0.487
α
[#] 0.017 [0.015, 0.082] 0.024 [0.008, 0.048] 0.908
τ
g
[min] 3.00 [1.00, 11.50] 5.14 [0.50, 9.00] 0.917
λ [mM
-1
pM
-1
] 8.9 [1.2, 21.3] · 10
-3
3.1 [0.2, 4] · 10
-3
0.037
Determined Parameters
T
ghb
[mmol/min/kgBW] 0.042 [0.028, 0.052] 0.019 [0.009, 0.117] 0.36
T
xg
[mM / min] 0.085 [0.057, 0.126] 0.046 [0.012, 0.397] 0.203
T
iG
[pM/min/mM] 0.096 [0.031, 0.29] 0.267 [0.128, 0.668] 0.011
ρ [#] 115.4 [24.3, 136.2] 83.6 [42.1, 267.7] 0.908
Comparisons were performed by the Mann-Whitney U-test. Values are expressed as median [min, max].
Table 5: M/I index values for lean and overweight or obese subjects measured over the 80'–120' and on the 260'–300' time periods.
Lean (n = 7) Overweight or Obese (n = 8) p (M-W U)
M / I (80'–120') 9.75 · 10
-5
[6.97, 11.42] · 10
-5
2.66 · 10
-5
[1.57, 5.2] · 10
-5
0.001
M / I (260'–300') 8.9 · 10
-5
[4.9, 13.2] · 10
-5
3.86 · 10
-5
[2.54, 7.44] · 10
-5
0.015
p (Wilcoxon) 0.6 0.02
Comparisons between groups were performed by the Mann-Whitney U-test. Comparisons within groups were performed via the Wilcoxon test
for matched pairs. Values are expressed as median [min, max].
Theoretical Biology and Medical Modelling 2005, 2:44 />Page 7 of 11
(page number not for citation purposes)
a residual metabolic capacity as insulin-resistant: this may
or may not be appropriate depending on the mode of
insulin resistance that the physiologist is interested in,
whether the speed or the capacity of response. The case of
the obese subject represents this ambiguity very well: if by
insulin resistance we mean the result of the EHC at 2
hours, that is to say a decreased effect of insulin on whole
body glucose uptake under hyperinsulinization with
respect to a specific and short time frame, then obese sub-
jects can be adequately diagnosed by the clamp as being
generally insulin resistant. If, on the other hand, we aban-
don the time frame requirement and address the maximal
ability to respond to the hormone, then the standard
clamp procedure is not adequate since it fails to allow
slowly-responding subjects to develop a complete
response. A way out of this ambiguity for diagnostic pur-
poses could be to use the parameters of a mathematical
model of the metabolic response during the clamp. Hope-
fully, this model would be able to quantify both the max-
imal response obtainable by the subject and the rate at
which this response is generated. Hence the diabetologist
would be offered separate, independent and complemen-
tary items of information on which to base the diagnosis.
Given the above considerations, the approach followed in
the present work was therefore to construct a determinis-
tic mathematical model of the time course of glucose
uptake rate during a clamp experiment.
A series of studies [15-17] demonstrated that insulin-stim-
ulated glucose uptake correlates with the appearance of
insulin in lymph fluid, a marker for interstitial insulin,
rather than with the appearance of insulin in the circula-
tory stream. Whether trans-endothelial passage of insulin
Composite plot for subject 2 (BMI = 35.9)Figure 2
Composite plot for subject 2 (BMI = 35.9). Observed (◆) and predicted ( ) glycemia; observed (o) and predicted ( )
insulinemia; glucose infusion rate (solid line). For ease of comparison, the insulin concentrations and the glucose infusion rates
are divided by factors of 300 and 0.01 respectively.
Theoretical Biology and Medical Modelling 2005, 2:44 />Page 8 of 11
(page number not for citation purposes)
from the circulation to the interstitial space is the sole or
the main mechanism for the delay is debatable, even
though it may be rate-limiting in the activation of glucose
uptake, since the pancreatic response to glucose should be
fast and since, once insulin is in the interstitial space, fur-
ther endocellular steps are very rapid. In any case, out of
the many models we tried in order to explain the observed
insulin and glucose concentration time courses, the
model that best explains the data includes a delay in the
action of plasma insulin in correcting glycemia. Of the
many alternative explicit representations of such delay
that could have been used, one of the simplest was cho-
sen, a Erlang-function kernel, to simplify the model's
mathematical treatment.
It has been shown [14] that Hepatic Glucose Output
(HGO) suppression after step insulinization is not imme-
diate, HGO decreasing towards 0 in an approximately
exponential manner from its pre-insulinization level. In
the present work, HGO was not independently measured
by tracer techniques. The model proposed here assumes
that the variable representing HGO (identified with the
symbol T
gh
) falls progressively to a new equilibrium value
as delayed insulin increases progressively to its new equi-
librium level after a step increase in plasma insulin. In
this, our model agrees with Nolan's observation. Further,
in the model proposed in the present work, equilibrium
T
gh
falls exponentially (with parameter λ) as equilibrium
insulin increases from baseline to full insulinization lev-
els.
The two parameters T
ghmax
and K
xgI
express respectively the
maximum Hepatic Glucose Output and the sensitivity of
glucose uptake to insulin concentration. Neither was sig-
Composite plot for subject 6 (BMI = 19.33)Figure 3
Composite plot for subject 6 (BMI = 19.33). Observed (◆) and predicted ( ) glycemia; observed (o) and predicted ( )
insulinemia; glucose infusion rate (solid line). For ease of comparison, the insulin concentrations and the glucose infusion rates
are divided by factors of 300 and 0.01 respectively.
Theoretical Biology and Medical Modelling 2005, 2:44 />Page 9 of 11
(page number not for citation purposes)
nificantly different between lean and obese subjects.
However, T
ghmax
was higher and K
xgI
was lower in obese
subjects, and both these changes would point to a
decreased insulin sensitivity in this patient group. While
the observed lack of significance may well be a conse-
quence of the limited power of the present study, given
the small number of subjects considered, the fact that
these two parameters were not much changed in obese
subjects while λ was significantly lower again indicates a
relative slowness in mounting an appropriate response
rather than a relative incapacity to mount a sustained
response eventually.
From the modelling point of view, the present study
prompts two considerations. The first is that a clamp that
is medically very successful (i.e. during which the physi-
cian manages to clamp glycemia effectively to within a
narrow range) may be less informative about the actual
subject's compensation mechanisms than a clamp where
imprecise correction of glycemia gives rise to oscillations.
The second is that, especially for subjects such as the one
reported in Figure 5, where sustained oscillations are pro-
duced, random perturbations of the system may give rise
to accidental phase shifts. This makes it very hard or
impossible to follow the oscillations unless for the model
can accommodate random variations of metabolism.
Future efforts in modelling the clamp will have to con-
sider this feature.
Conclusion
In conclusion, the present paper describes a possible
deterministic modelling of the EHC, which may prove
useful for studying obese subjects who show delayed
expression of their maximal increase of glucose uptake
Composite plot for subject 9 (BMI = 63.6)Figure 4
Composite plot for subject 9 (BMI = 63.6). Observed (◆) and predicted ( ) glycemia; observed (o) and predicted ( )
insulinemia; glucose infusion rate (solid line). For ease of comparison, the insulin concentrations and the glucose infusion rates
are divided by factors of 300 and 0.01 respectively.
Theoretical Biology and Medical Modelling 2005, 2:44 />Page 10 of 11
(page number not for citation purposes)
under insulinization. Considering the amplitude of
response independently of the time factor, the whole
body capacity of glucose uptake in obese subjects does not
appear to be decreased with respect to lean subjects.
Competing interests
The author(s) declare that they have no competing inter-
ests.
Authors' contributions
UP: mathematical modeling, statistical analysis, drafting
of the manuscript;
ADG: mathematical modeling, drafting of the manuscript;
SP: mathematical modeling;
SD: mathematical modeling;
GM: design of the experiment, collection of data, drafting
of the "Experimental protocol" and "Discussion" sections
of the manuscript.
All authors read and approved the final manuscript.
References
1. Ferrannini E, Mari A: How to measure insulin sensitivity. J Hypertens
1998, 16:895-906.
2. Wallace TM, Matthews DR: The assessment of insulin resistance
in man. Diabet Med 2002, 19:527-534.
3. Starke AA: Determination of insulin sensitivity: methodologi-
cal considerations. J Cardiovasc Pharmacol 1992, 20:S17-S21.
4. Zierler K: Whole body glucose metabolism. Am J Physiol 1999,
276:E409-E426.
5. Defronzo RA, Tobin JD, Andres R: Glucose clamp technique: a
method for quantifying insulin secretion and resistance. Am
J Physiol 1979, 237:E214-E223.
Composite plot for subject 10 (BMI = 18.6)Figure 5
Composite plot for subject 10 (BMI = 18.6). Observed (◆) and predicted ( ) glycemia; observed (o) and predicted ( )
insulinemia; glucose infusion rate (solid line). For ease of comparison, the insulin concentrations and the glucose infusion rates
are divided by factors of 300 and 0.01 respectively.
Publish with Bio Med Central and every
scientist can read your work free of charge
"BioMed Central will be the most significant development for
disseminating the results of biomedical research in our lifetime."
Sir Paul Nurse, Cancer Research UK
Your research papers will be:
available free of charge to the entire biomedical community
peer reviewed and published immediately upon acceptance
cited in PubMed and archived on PubMed Central
yours — you keep the copyright
Submit your manuscript here:
/>BioMedcentral
Theoretical Biology and Medical Modelling 2005, 2:44 />Page 11 of 11
(page number not for citation purposes)
6. Felber JP, Acheson KJ, Tappy L: From obesity to diabetes Chichester:
John Wiley and Sons; 1993.
7. Doberne L, Greenfield MS, Schulz B, Reaven GM: Enhanced glu-
cose utilization during prolonged glucose clamp studies. Dia-
betes 1981, 30:829-835.
8. Thiebaud D, Jacot E, Defronzo RA, Maeder E, Jequier E, Felber JP:
The effect of graded doses of insulin on total glucose uptake,
glucose oxidaton and glucose storage in man. Diabetes 1982,
31:957-963.
9. Ferrannini E, Smith JD, Cobelli C, Toffolo G, Pilo A, Defronzo RA:
Effect of insulin on the distribution and disposition of glucose
in man. J Clin Invest 1985, 76:357-364.
10. Ferrannini E, Natali A, Bell P, Cavallo-Perin P, Lalic N, Mingrone G:
Insulin resistance and hypersecretion in obesity. J Clin Invest
1997, 100:1166-1173.
11. Olson AL, Pessin JE: Structure, function, and regulation of the
mammalian facilitative glucose transporter gene family.
Annu Rev Nutr 1996, 16:235-256.
12. Lajtha A, ed: Handbook of Neurochemistry Volume 1. New York: Ple-
num; 1969.
13. Bergman RN, Ider YZ, Bowden CR, Cobelli C: Quantitative esti-
mation of insulin sensitivity. Am J Physiol 1979, 236:E667-E677.
14. Nolan JJ, Ludvik B, Baloga J, Reichart D, Olefsky JM: Mechanisms of
the kinetic defect in insulin action in obesity and IDDM. Dia-
betes 1997, 46:994-1000.
15. Yang YJ, Hope ID, Ader M, Bergman RN: Insulin transport across
capillaries is rate limiting for insulin action in dogs. J Clin Invest
1989, 84:1620-1628.
16. Bergman RN, Yang YJ, Hope ID, Ader M: The role of the transcap-
illary insulin transport in the efficiency of insulin action: stud-
ies with glucose clamps and the minimal model. Horm Metab
Res Suppl 1990, 24:49-56.
17. Ader M, Poulin RA, Yang YJ, Bergman RN: Dose-response rela-
tionship between lymph insulin and glucose uptake reveals
enhanced insulin sensitivity of peripheral tissues. Diabetes
1992, 41:241-253.
18. Defronzo RA, Ferrannini E: Insulin resistance. A multifaceted
syndrome responsible for NIDDM, obesity, hypertension,
dyslipidemia, and atherosclerotic cardiovascular disease.
Diabetes Care 1991, 14:173-194.