third quarter results and outlook for 2004 strength performance passion holcim ltd
Bạn đang xem bản rút gọn của tài liệu. Xem và tải ngay bản đầy đủ của tài liệu tại đây (669.75 KB, 21 trang )
Third quarter results and outlook for 2004
Strength.
Performance.
Passion.
Key facts at a glance
Solid internal growth outweighs rising energy prices and
partly weaker Group currencies.
Thanks to strong positions in growth markets, sales volumes
were up across all segments in all five Group regions.
Efficiency-enhancing measures in sales, administration and
production are taking hold.
Stronger operating result and further margin improvements
confirm that Holcim continues to stay on the road to success.
Above-average increase in consolidated net income after
minority interests.
2
3Q 2004
1
Europe
Ongoing progress in third quarter.
Except for Germany, strong
construction activity in Western
Europe.
Encouraging development in
Southeast Europe, too.
New kiln line at the Alesd plant (Romania)
3
3Q 2004
Facts on Europe
Higher deliveries across all segments.
In Western Europe, Holcim reports impressive increase
in cement sales in Spain, and deliveries are higher in
Switzerland, too.
In a still difficult market, Holcim Germany lifts turnover
thanks to improved prices.
We achieve above-average growth rates in Bulgaria
and Romania.
Our Russian Group company’s sales are positively impacted
by the construction boom in the Greater Moscow region.
Consolidated operating profit in Europe grew by
20.7 percent to CHF 577 million.
4
3Q 2004
2
Operations in Europe
Group:
Cement plant
Grinding plant
Terminal
Grinding plant
under construction
Participation:
Cement plant
Cement capacity Group (Europe): 44.7 million t; further 1.0 million t with partners.
5
3Q 2004
North America
Continued dynamic growth in
the construction sector.
Strong demand on the back of
private residential construction
and modernization work on the
transport infrastructure.
Cement still being imported
despite new capacity.
New kiln line at the Holly Hill plant (USA)
6
3Q 2004
3
Facts on North America
Holcim US and St. Lawrence Cement achieved higher
sales volumes.
In financial terms, both companies made considerable
progress.
Increased productivity largely helped cushion the impact
of rising energy costs.
Despite a weak US dollar, Group region North America
posted a 35.2 percent increase in operating profit to
CHF 242 million.
7
3Q 2004
Operations in North America
Cement plant
Grinding plant
Terminal
Cement plant
(project)
Cement capacity Group (North America): 21.3 million t.
8
3Q 2004
4
Latin America
Solid construction activity.
Cement demand sound in most
markets.
Brazilian and Chilean construction
markets regained momentum.
Marked upsurge, especially in
Argentina, Venezuela and
Ecuador.
New kiln line at the Cartago plant (Costa Rica)
9
3Q 2004
Facts on Latin America
In Latin America delivery volumes increased in all
segments.
Group companies in Mexico and Central America also
performed well.
Argentina, Venezuela and Ecuador posted the biggest
increases in cement deliveries.
In Mexico Holcim Apasco lifted sales of ready-mix concrete
very significantly.
Steps taken early to increase efficiency largely countered
heightened competitive pressure and rising energy prices.
Despite a weaker USD, operating profit in Group region Latin
America declined by only 5.7 percent to CHF 559 million.
10
3Q 2004
5
Operations in Latin America
Group:
Cement plant
Grinding plant
Terminal
Participation:
Cement plant
Grinding plant
Terminal
Cement capacity Group (Latin America): 31.0 million t; further 9.5 million t with partners.
11
3Q 2004
Africa Middle East
Lively construction activity, despite
different growth pattern across
regions.
Growth driven by road network
expansion projects and an upturn
in new housing starts.
Especially in South Africa high
construction investment outlays.
Modernized kiln line at Dudfield (South Africa)
12
3Q 2004
6
Facts on Africa Middle East
All Group companies increased cement deliveries.
Ready-mix concrete sales volumes were also encouraging.
Group companies in Egypt and Lebanon benefited
from an increase in export contracts.
Group companies in West and Southern Africa also
showed a good performance.
With the exception of Holcim Morocco, all Group
companies improved their performance.
Group region Africa Middle East lifted operating
profit by 29.3 percent to CHF 269 million.
13
3Q 2004
Operations in Africa Middle East
Group:
Cement plant
Grinding plant
Terminal
Participation:
Cement plant
Grinding plant
Terminal
Cement capacity Group (Africa Middle East): 12.9 million t; further 5.1 million t with partners.
14
3Q 2004
7
Asia Pacific
Economies sound in Asia, Australia
and New Zealand.
Housing construction and transport
infrastructure expansion the main
growth drivers.
The winners in the construction
sector include Thailand, the
Philippines and Vietnam.
Grinding plant and terminal at Cat Lai (Vietnam)
15
3Q 2004
Facts on Asia Pacific
Consolidated cement sales in Asia Pacific have gone up
substantially.
The largest volume increases were posted by Group
companies in Thailand, the Philippines and Vietnam.
In financial terms, the strongest improvements were
achieved by our companies in the Philippines, Thailand
and New Zealand.
Group region Asia Pacific increased operating profit
by 23.8 percent to CHF 187 million.
16
3Q 2004
8
Operations in Asia Pacific
Group:
Cement plant
Grinding plant
Terminal
Participation:
Cement plant
Grinding plant
Terminal
Cement capacity Group (Asia Pacific): 36.0 million t; further 18.4 million t with partners.
17
3Q 2004
Key financial figures
Full
Year +/-
2003 2003 2004
in
CHF
in
loc.
curr.
Net sales 12'600 9'395 10'017 6.6% 8.8%
Operating EBITDA 3'311 2'537 2'792 10.1% 13.1%
Operating profit 1'925 1'550 1'787 15.3% 18.6%
Group net income
after minority interests 686 518 691 33.4% 39.1%
Cash flow from
operating activities 2'619 1'527 1'669 9.3% 11.8%
EPS in CHF 3.51 2.65 3.33 25.7% 31.1%
Cash EPS in CHF
1
4.96 3.81
4.51
18.4%
22.4%
1
Excludes the amortization of goodwill and other intangible assets
18
3Q 2004
9
Million
CHF
9
Months
Balance
sheet
exchange
rates
in
30.9.03
31.12.03
30.9.04
+/-
1 EUR 1.54 1.56 1.55 -0.6%
1 USD 1.32 1.24 1.26 1.6%
1
African
Basket
(EGP,
ZAR,
MAD)
2
1.02 1.00 1.03 3.0%
1
Asian
Basket
(AUD,
NZD,
THB,
PHP)
2
1.02 1.00 0.99 -1.0%
Statement
of
income
average
exchange
9M
02
9M
03
9M
04
+/-
1 EUR 1.47 1.51 1.55 2.6%
1 USD 1.59 1.36 1.27 -6.6%
1
African
Basket
(EGP,
ZAR,
MAD)
1
0.98 1.00 1.04 4.0%
1
Asian
Basket
(AUD,
NZD,
THB,
PHP)
1
1.09 1.00 1.00 0.0%
Effective
as
at
Cement
capacity
+
Proportionate consolidation of Cement
Australia (integration of Queensland Cement)
June 1, 2003 –
–
Eternit AG, Switzerland
November 10, 2003 –
+
Alpha Cement, Russia
December 31, 2003 4.3 million t
+
Rohrbach Zement /
–
Geisingen
January 1, 2004 –
+/–
Various smaller companies
Major changes in the scope of consolidation
19
3Q 2004
2
weighted by net sales full year 2003
20
3Q 2004
10
Exchange rates
1
weighted by net sales 9 months 2003
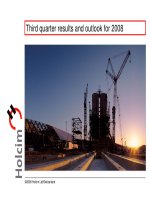
Cement and clinker sales volumes by region
Million t
23.6
9 months 2003
12.6
14.3
13.2
15.4
9 months 2004
20.0
19.1
17.6
9.5
10.6
∆ 9M 03/9M 04
Volume
Change in
Total
structure
Europe 2.5% 15.5% 18.0%
North America 4.8% 0.0% 4.8%
Latin America 7.7% 0.0% 7.7%
Africa Middle East 11.4% 0.2% 11.6%
Asia Pacific 8.3% 0.2% 8.5%
Total 5.0% 4.6% 9.6%
21
3Q 2004
Sales volumes aggregates and ready-mix concrete
Aggregates sales in million t
Ready-mix concrete sales in million m
3
78.5
+13.9%
67.9
68.9
+4.8%
+1.5%
18.9
+0.5%
19.7
+4.2%
21.9
+ 11.2%
9M 2002 9M 2003 9M 2004
22
3Q 2004
11
Net sales
Million CHF
9'928
9'395
10'017
Volume/price -12 -0.1% 39 0.4% 732 7.8%
Change
in
structure 319 3.1% 71 0.7% 98 1.0%
Forex
movements -680 -6.6% -643 -6.5% -208 -2.2%
Total
change -373 -3.6% -533 -5.4% 622 6.6%
9M 2002 9M 2003 9M 2004
23
3Q 2004
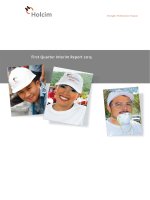
Net sales by region
Million CHF
1'844
1'932
3'343
3'631
921
1'141
9 months 2003
9 months 2004
1'308
1'459
2'136 2'177
∆ 9M 03/9M 04
Volume/
Change in
Currency
Total
price structure
Europe 4.9% 1.8% 1.9% 8.6%
North America 7.8% 1.4% -4.4% 4.8%
Latin America 9.2% 0.1% -7.4% 1.9%
Africa Middle East 23.5% 1.2% -0.8% 23.9%
Asia Pacific 15.5% -0.2% -3.8% 11.5%
Total 7.8% 1.0% -2.2% 6.6%
24
3Q 2004
12
Net sales by region
Sales 9 months 2004
Europe
35%
North
America
19%
Latin
Asia
Pacific
14%
America
21%
Africa
Middle East
11%
25
3Q 2004
Operating EBITDA
Million CHF Margin
26.3%
2'616
27.0%
2'537
27.9%
2'792
Volume/price/cost 183 7.1% 82 3.2% 302
11.9%
Change in structure 53 2.1% 53 2.0% 30 1.2%
Forex movements -185 -7.2% -214 -8.2% -77 -3.0%
Total
change 51 2.0% -79 -3.0% 255
10.1%
9M
2002 9M
2003 9M
2004
26
3Q 2004
13
EBITDA
Million CHF
Margin
27.4%
2'719
- 1.0%
27.6%
2'597
- 4.5%
28.2%
2'820
+ 8.6%
9M
2002 9M
2003 9M
2004
27
3Q 2004
Operating profit
Million CHF
Margin
17.8%
15.7%
16.5%
1'787
1'559
1'550
Volume/price/cost 132 8.5% 97 6.2% 265
17.1%
Change in structure -8 -0.5% 29 1.9% 23 1.5%
Forex movements -118 -7.6% -135 -8.7% -51 -3.3%
Total
change 6 0.4% -9 -0.6% 237
15.3%
9M 2002 9M 2003 9M 2004
28
3Q 2004
14
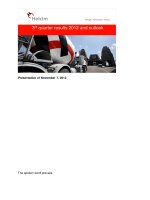
Operating profit by region
Million CHF
478
242
179
577
269
9 months 2003
9 months 2004
593
559
208
151
187
∆ 9M 03/9M 04 Volume/
Change in
Currency Total
price/cost structure
Europe 13.8% 5.0% 1.9% 20.7%
North America 38.0% 3.9% -6.7% 35.2%
Latin America 1.3% 0.2% -7.2% -5.7%
Africa Middle East 28.8% 0.4% 0.1% 29.3%
Asia Pacific 33.7% -6.6% -3.3% 23.8%
Total 17.1% 1.5% -3.3% 15.3%
29
3Q 2004
Group net income
Before minority interests in million CHF
After minority interests in million CHF
877
+21.3%
727 723
-6.0% -0.6%
691
+33.4%
514 518
-16.2% +0.8%
9M 2002 9M 2003 9M 2004
30
3Q 2004
Cash flow from operating activities
Million C HF
17.4%
1'732
16.3%
16.7%
1'669
9
Months +/-
2003 2004
1'527 1'669
9.3%
-510 -415 -18.6%
1'017 1'254
23.3%
-323 -238 -26.3%
-483 -1'421 194.2%
-335 -365 9.0%
-124 -770
521.0%
1'527
Volume/price/cost 363
25.0% -141 -8.1% 158
10.4%
Change
in
structure 37 2.6% 55 3.2% 22 1.4%
Forex mov ements
-115
-7.9%
-119
-6.9%
-38
-2.5%
Total
chan ge 285
19.7%
-205
-11.8%
142 9.3%
9M 2002 9M 2003
9M 2004
31
3Q 2004
Cash flow statement
Investments to maintain productive
32
3Q 2004
16
Financing
Million
CHF
Full
Year
2003
Cash
flow
from
operating
activities
2'619
capacity and to secure competitiveness -802
Free
cash
flow
1'817
Expansion investments -490
Financial investments net -
442
Dividends paid -
368
Financing
surplus
(requirement)
517
9
Months +/-
2003 2004
-124 -770
521.0%
- 1'456
4 -48
661 -555
-22 44
519 127
-75.5%
(De)Increase
in
cash
33
3Q 2004
Financial position
94.3%
87.4%
70.9%
10'891
9'695
9'144
9'499
8'299
7'726
30.09.2003 31.12.2003 30.09.2004
Equity
in
million
CHF Net
financial
debt
in
million
CHF Gearing
34
3Q 2004
17
Outlook for 2004
Substantial operating progress in Europe.
Million
CHF
Full
Year
2003
Financing
surplus
(requirement)
517
Capital paid-in 26
Movements of treasury shares net 4
(De)Increase in financing liabilities -676
De(In)crease in marketable securities 30
and
cash
equivalents
-99
Improved market environment in North America.
Robust performance in Latin America.
Encouraging results in Africa Middle East and
Asia Pacific.
We expect the annual forecast of 8 percent internal
growth on the operating profit level to be clearly
exceeded.
The positive development in the Group’s operating
EBITDA margin is likely to continue.
35
3Q 2004
Strength. Performance. Passion.
36
3Q 2004
18
Contact information and event calendar
Contact information
Corporate Communications
Phone
+41 58 858 87 10
Fax +41 58 858 87 19
Investor Relations
Phone
+41 58 858 87 87
Fax +41 58 858 87 19
www.holcim.com/investors
Mailing list:
www.holcim.com/subscribe
Event calendar
March 2, 2005 Annual results 2004
Conference for press and analysts
May 2, 2005 First quarter results 2005
May 3, 2005 General Meeting of Shareholders
May 6, 2005 Dividend payment
August 18, 2005 Half-year results 2005
November 9, 2005 Third quarter results 2005
Conference for press and analysts
37
3Q 2004
19