Excel 2002 Power Programming with VBA phần 7 pps
Bạn đang xem bản rút gọn của tài liệu. Xem và tải ngay bản đầy đủ của tài liệu tại đây (997.99 KB, 99 trang )
555
Chapter 18 ✦ Working with Charts
Case xlXErrorBars: Id = “XErrorBars”
Case xlYErrorBars: Id = “YErrorBars”
Case xlLegendEntry: Id = “LegendEntry”
Case xlLegendKey: Id = “LegendKey”
Case xlAxis: Id = “Axis”
Case xlMajorGridlines: Id = “MajorGridlines”
Case xlMinorGridlines: Id = “MinorGridlines”
Case xlAxisTitle: Id = “AxisTitle”
Case xlUpBars: Id = “UpBars”
Case xlDownBars: Id = “DownBars”
Case xlSeriesLines: Id = “SeriesLines”
Case xlHiLoLines: Id = “HiLoLines”
Case xlDropLines: Id = “DropLines”
Case xlRadarAxisLabels: Id = “RadarAxisLabels”
Case xlShape: Id = “Shape”
Case xlNothing: Id = “Nothing”
Case Else: Id = “Some unknown thing”
End Select
MsgBox “Selection type:” & Id
End Sub
This procedure displays a message box that contains a description of the selected
item. When the
Select event occurs, the ElementID argument contains an integer
that corresponds to what was selected. The
Arg1 and Arg2 arguments provide
additional information about the selected item (see the online help for details). The
Select Case structure converts the built-in constants to descriptive strings.
Enabling events for an embedded chart
As I noted in the previous section, Chart events are automatically enabled for chart
sheets, but not for charts embedded in a worksheet. To use events with an embed-
ded chart, you need to perform the following steps:
Create a class module
In the VB Editor window, select your project in the Project window and select
Insert ➪ Class Module. This will add a new (empty) class module to your project.
If you like, you can use the Properties window to give the class module a more
descriptive name.
Declare a public Chart object
The next step is to declare a Public variable that will be used as the class name.
The variable should be of type
Chart, and it must be declared in the class module
using the
WithEvents keyword. If you omit the WithEvents keyword, the object
will not respond to events. Following is an example of such a declaration:
Public WithEvents myChartClass As Chart
4799-2 ch18.F 6/11/01 9:40 AM Page 555
556
Part V ✦ Advanced Programming Techniques
Connect the declared object with your chart
Before your event-handler procedures will run, you must connect the declared
object in the class module with your embedded chart. You do this by declaring an
object of type
Class1 (or whatever your class module is named). This should be a
module-level object variable, declared in a regular VBA module (not in the class
module). Here’s an example:
Dim MyChart As New MyChartClass
Then you must write code to actually instantiate the object, such as this instruction:
Set myChart.myChartClass = ActiveSheet.ChartObjects(1).Chart
After the preceding statement is executed, the myChartClass object in the class
module points to the first embedded chart on the active sheet. Consequently, the
event-handler procedures in the class module will execute when the events occur.
Write event-handler procedures for the chart class
In this section, I describe how to write event-handler procedures in the class mod-
ule. Recall that the class module must contain a declaration such as:
Public WithEvents myChartClass As Chart
After this new object has been declared using the WithEvents keyword, it appears
in the Object drop-down list box in the class module. When you select the new
object in the Object box, the valid events for that object are listed in the Procedure
drop-down box on the right (see Figure 18-16).
Figure 18-16: The Procedure list displays valid events for the new Chart object.
4799-2 ch18.F 6/11/01 9:40 AM Page 556
557
Chapter 18 ✦ Working with Charts
The following example is a simple event-handler procedure that is executed when
the embedded chart is activated. This procedure simply pops up a message box
that displays the name of the
Chart object’s parent (which is a ChartObject
object).
Private Sub myChartClass_Activate()
MsgBox myChartClass.Parent.Name & “ was activated!”
End Sub
The companion CD-ROM contains a workbook that demonstrates the concepts
described in this section.
Example: Using Chart events with an embedded chart
The example in this section provides a practical demonstration of the information
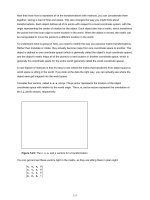
presented in the previous section. The example shown in Figure 18-17 consists of an
embedded chart that functions as a clickable image map. Clicking one of the chart
columns activates a worksheet that shows detailed data for the region.
Figure 18-17: This chart serves as a clickable image map.
The workbook is set up with four worksheets. The sheet named Main contains the
embedded chart. The other sheets are named
North, South, and West. Formulas in
B1:B4 sum the data in the respective sheets, and this summary data is plotted in
the chart. Clicking a column in the chart triggers an event, and the event-handler
procedure activates the appropriate sheet so the user can view the details for the
desired region.
On the
CD-ROM
4799-2 ch18.F 6/11/01 9:40 AM Page 557
558
Part V ✦ Advanced Programming Techniques
The workbook contains a class module named EmbChartClass, and also a normal
VBA module named
Module1. For demonstration purposes, the Main worksheet
also contains two buttons: One executes a procedure named
EnableChartEvents,
the other executes a procedure named
DisableChartEvents (both are located in
Module1). In addition, each of the other worksheets contains a button that exe-
cutes the
ReturntoMain macro that reactivates the Main sheet.
The complete listing of Module1 follows:
Dim SummaryChart As New EmbChartClass
Sub EnableChartEvents()
‘ Called by worksheet button
Range(“A1”).Select
Set SummaryChart.myChartClass = _
Worksheets(1).ChartObjects(1).Chart
End Sub
Sub DisableChartEvents()
‘ Called by worksheet button
Set SummaryChart.myChartClass = Nothing
Range(“A1”).Select
End Sub
Sub ReturnToMain()
‘ Called by worksheet button
Sheets(“Main”).Activate
End Sub
The first instruction declares a new object variable SummaryChart to be of type
EmbChartClass — which, as you recall, is the name of the class module. When the
user clicks the Enable Chart Events button, the embedded chart is assigned to the
SummaryChart object, which, in effect, enables the events for the chart. Listing 18-4
shows the class module for
EmbChartClass.
Clicking the chart generates a MouseDown event, which executes the
myChartClass_MouseDown procedure. This procedure uses the GetChartElement
method to determine what element of the chart was clicked. The GetChartElement
method returns information about the chart element at specified X and Y coordi-
nates (information that is available via the arguments for the
myChartClass_MouseDown procedure.
Listing 18-4: Reacting to which column has been clicked on
Public WithEvents myChartClass As Chart
Private Sub myChartClass_MouseDown(ByVal Button As Long, _
ByVal Shift As Long, ByVal X As Long, ByVal Y As Long)
4799-2 ch18.F 6/11/01 9:40 AM Page 558
559
Chapter 18 ✦ Working with Charts
Dim IDnum As Long
Dim a As Long, b As Long
‘ The next statement returns values for
‘ IDNum, a, and b
myChartClass.GetChartElement X, Y, IDnum, a, b
‘ Was a series clicked?
If IDnum = xlSeries Then
Select Case b
Case 1
Sheets(“North”).Activate
Case 2
Sheets(“South”).Activate
Case 3
Sheets(“West”).Activate
End Select
End If
Range(“A1”).Select
End Sub
This workbook is available on the companion CD-ROM.
Charting Tricks
I conclude this chapter by sharing a few charting tricks that I’ve discovered over
the years. Some of these techniques may be useful in your applications, and others
are simply for fun. At the very least, studying them may give you some new insights
into the object model for charts.
Printing embedded charts on a full page
When an embedded chart is selected, you can print the chart by choosing File ➪
Print. The embedded chart will be printed on a full page by itself (just as if it were
on a chart sheet), yet it will remain an embedded chart.
The following macro prints all embedded charts on the active sheet, and each chart
is printed on a full page:
Sub PrintEmbeddedCharts()
For Each chtObj In ActiveSheet.ChartObjects
chtObj.Chart.Print
Next chtObj
End Sub
On the
CD-ROM
4799-2 ch18.F 6/11/01 9:40 AM Page 559
560
Part V ✦ Advanced Programming Techniques
Creating a “dead chart”
Normally, an Excel chart uses data stored in a range. Change the data in the range,
and the chart is updated automatically. In some cases, you may want to “unlink” the
chart from its data ranges and produce a “dead chart” (a chart that never changes).
For example, if you plot data generated by various what-if scenarios, you may want
to save a chart that represents some baseline so you can compare it with other
scenarios.
There are two ways to create such a chart:
✦ Paste it as a picture. Activate the chart and choose Edit ➪ Copy. Then press the
Shift key and select Edit ➪ Paste Picture (the Paste Picture command is avail-
able only if you press Shift when you select the Edit menu). The result will be
a picture of the copied chart.
✦ Convert the range references to arrays. Click on a chart series and then click
the formula bar. Press F9 to convert the ranges to an array. Repeat this for
each series in the chart.
The xl8galry.xls file uses this technique. This file is a special workbook used by
Excel to store its custom chart formats. If you open this workbook, you’ll find 20
chart sheets. Each chart sheet has “dummy” data, which uses an array rather than
a range as its source.
Another way to create a dead chart is to use VBA to assign an array rather than a
range to the XValues or Values properties of the Series object.
Controlling a data series by hiding data
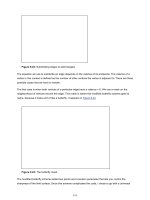
Figure 18-18 shows a chart that displays daily data for 365 days. What if you only
want to plot, say, the data for February? You could, of course, redefine the chart’s
data range. Or, you could take advantage of Excel’s AutoFilter command.
By default, a chart does not display data that’s hidden. Since Excel’s AutoFilter
feature works by hiding rows that don’t meet your criteria, it’s a simple solution.
Select Data ➪ Filter➪AutoFilter to turn on the AutoFilter mode. Each row heading
in the filtered list displays a drop-down arrow. Click the arrow and select Custom
from the list. Then enter filter criteria that will select the dates that you want to
plot. The setting shown in Figure 18-19, for example, hides all rows except those
that have a date in February.
Note
4799-2 ch18.F 6/11/01 9:40 AM Page 560
561
Chapter 18 ✦ Working with Charts
Figure 18-18: You can use Excel’s AutoFilter feature to plot only a subset of the data.
This workbook is available on the companion CD-ROM.
Figure 18-19: Use the Custom AutoFilter
dialog box to filter a list.
The resulting chart is shown in Figure 18-20.
On the
CD-ROM
4799-2 ch18.F 6/11/01 9:40 AM Page 561
562
Part V ✦ Advanced Programming Techniques
Figure 18-20: Only visible cells are displayed in a chart.
If this technique doesn’t seem to be working, you need to change a setting for the
chart. Activate the chart, then choose Tools➪ Options. In the Options dialog box,
click the Chart tab and place a check mark next to Plot visible cells only. Also, to
ensure that the chart doesn’t disappear when its rows are hidden, set its position-
ing to Don’t move or size with cells. Use the Format➪ Selected Chart Area com-
mand to change this setting.
Storing multiple charts on a chart sheet
Most Excel users who take the time to think about it would agree that a chart sheet
holds a single chart. Most of the time, that’s a true statement. However, it’s cer-
tainly possible to store multiple charts on a single chart sheet. In fact, Excel lets
you do this directly. If you activate an embedded chart and then select Chart ➪
Location, Excel displays its Chart Location dialog box. If you select the As new
sheet option and specify an existing chart sheet as the location, the chart will
appear on top of the chart in the chart sheet.
Most of the time, you’ll want to add embedded charts to an empty chart sheet. To
create an empty chart sheet, select a single blank cell and press F11.
One advantage of storing multiple charts on a chart sheet is that you can take
advantage of the View➪ Sized with Window command to automatically scale the
charts to the window size and dimensions. Figure 18-21 shows an example of a
chart sheet that contains six embedded charts.
Note
4799-2 ch18.F 6/11/01 9:40 AM Page 562
563
Chapter 18 ✦ Working with Charts
Figure 18-21: This chart sheet contains six embedded charts.
This workbook is available on the companion CD-ROM.
Using linked pictures in a chart
Excel has a feature that lets you display a data table inside of a chart. You can select
this option in Step 3 of the ChartWizard. The data table option displays a table that
shows the values used in a chart. This is a handy feature, but it’s not very flexible.
For example, your formatting options are limited, and you have no control over the
position of the data table (it always appears below the chart).
An alternative to the data table is to use a linked picture of a range. Figure 18-22
shows an example.
On the
CD-ROM
4799-2 ch18.F 6/11/01 9:40 AM Page 563
564
Part V ✦ Advanced Programming Techniques
Figure 18-22: This chart contains a linked picture of a range used
in the chart.
To create a linked picture in a chart, first create the chart as you normally would.
Then:
1. Select the range that you would like to include in the chart.
2. Select Edit ➪ Copy.
3. Activate the chart.
4. Press Shift, and then select Edit ➪ Paste Picture. This pastes an unlinked pic-
ture of the range.
5. To create the link, select the picture and then type a reference to the range in
the formula bar. The easiest way to do this is to type an equals sign, and then
reselect the range.
The picture now contains a live link to the range. If you change the values or cell
formatting, they will be reflected in the linked picture.
This workbook is available on the companion CD-ROM.
On the
CD-ROM
4799-2 ch18.F 6/11/01 9:40 AM Page 564
565
Chapter 18 ✦ Working with Charts
Animated charts
Most people don’t realize it, but Excel is capable of performing simple animations.
For example, you can animate shapes and charts. Consider the XY chart shown in
Figure 18-23.
Figure 18-23: A simple VBA procedure will turn this graph into an
interesting animation.
The X values (column A) depend on the value in cell A1. The value in each row is
the previous row’s value, plus the value in A1. Column B contains formulas that
calculate the SIN of the corresponding value in column A. The following simple
procedure produces an interesting animation. It simply changes the value in cell A1,
which causes the values in the X and Y ranges to change.
Sub AnimateChart()
Range(“A1”) = 0
For i = 1 To 150
Range(“A1”) = Range(“A1”) + 0.035
Next i
Range(“A1”) = 0
End Sub
The companion CD-ROM contains a workbook that includes this animated chart,
plus several other animation examples.
On the
CD-ROM
4799-2 ch18.F 6/11/01 9:40 AM Page 565
566
Part V ✦ Advanced Programming Techniques
Creating a hypocycloid chart
Even if you hated your high school trigonometry class, you’ll probably like the
example in this section — which relies heavily on trigonometric functions. The
workbook shown in Figure 18-24 can display an infinite number of dazzling hypocy-
cloid curves. A hypocycloid curve is the path formed by a point on a circle that
rolls inside of another circle. This, as you may recall from your childhood, is the
same technique used in Hasbro’s popular Spirograph toy.
Figure 18-24: This workbook generates an infinite number of hypocycloid curves.
This workbook is available on the companion CD-ROM.
The chart is an XY chart. The X and Y data are generated using formulas stored in
columns A and B. The Scrollbar controls at the top let you adjust the three parame-
ters that determine the look of the chart. These controls are linked to cells B1, B2,
and B3. These are controls from the Forms toolbar, and are not ActiveX controls. In
addition, the chart has a Random button that generates random values for the
three parameters.
On the
CD-ROM
4799-2 ch18.F 6/11/01 9:40 AM Page 566
567
Chapter 18 ✦ Working with Charts
The workbook contains only one macro (which follows), which is executed when
the Random button is clicked. This macro simply generates three random numbers
between 1 and 250 and inserts them into the worksheet.
Sub Random_Click()
Randomize
Range(“B1”) = Int(Rnd * 250)
Range(“B2”) = Int(Rnd * 250)
Range(“B3”) = Int(Rnd * 250)
End Sub
Creating a “clock” chart
Figure 18-25 shows an XY chart formatted to look like a clock. It not only looks like a
clock, it also functions as a clock. I can’t think of a single reason why anyone would
need to display a clock like this on a worksheet, but creating the workbook was
challenging and you may find it instructive.
Figure 18-25: This clock is fully functional,
and is actually an XY chart in disguise.
This workbook is available on the companion CD-ROM.
Besides the clock chart, the workbook contains a text box that displays the time as
a normal string, as shown in Figure 18-26. Normally this is hidden, but it can be
displayed by deselecting the Analog clock check box.
On the
CD-ROM
4799-2 ch18.F 6/11/01 9:40 AM Page 567
568
Part V ✦ Advanced Programming Techniques
Figure 18-26: Displaying a digital clock in
a worksheet is much easier, but not as fun
to create.
As you explore this workbook from the CD-ROM, here are a few things to keep in
mind:
✦ The
ChartObject is named ClockChart, and it covers up a range named
DigitalClock, which is used to display the time digitally.
✦ The two buttons on the worksheet are from the Forms toolbar, and each has a
macro assigned (
StartClock and StopClock).
✦ The check box control (named
cbClockType) on the worksheet is from the
Forms toolbar, not from the Control Toolbox toolbar. Clicking the object exe-
cutes a procedure named
cbClockType_Click, which simply toggles the
Visible property of the ChartObject. When it’s invisible, the digital clock is
revealed.
✦ The chart is an XY chart with four
Series objects. These series represent the
hour hand, the minute hand, the second hand, and the 12 numbers.
✦ The
UpdateClock procedure is executed when the Start Clock button is
clicked. This procedure determines which clock is visible and performs the
appropriate updating.
✦ The
UpdateClock procedure uses the OnTime method of the Application
object. This method lets you execute a procedure at a specific time. Before
the
UpdateClock procedure ends, it sets up a new OnTime event that will
occur in one second. In other words, the
UpdateClock procedure is called
every second.
✦ The
UpdateClock procedure uses some basic trigonometry to determine the
angles at which to display the hands on the clock.
✦ Unlike most charts, this one does not use any worksheet ranges for its data.
Rather, the values are calculated in VBA and transferred directly to the
Values and XValues properties of the chart’s Series object.
4799-2 ch18.F 6/11/01 9:40 AM Page 568
569
Chapter 18 ✦ Working with Charts
Drawing with an XY chart
The final example has absolutely no practical value, but you may find it interesting . . .
and maybe even a bit entertaining. The worksheet consists of an embedded XY chart,
along with a number of controls (these are controls from the Forms toolbar; and are
not ActiveX controls).
This workbook is available on the companion CD-ROM.
Clicking one of the arrow buttons draws a line in the chart, the size of which is
determined by the “step” value, which is set with one of the Spinner controls. With
a little practice (and patience), you can create simple sketches. Figure 18-27 shows
an example.
Figure 18-27: This drawing is actually an embedded XY chart.
Clicking an arrow button executes a macro that adds two values to a range: an X
value and a Y value. It then redefines two range names (
XRange and YRange) that
are used in the chart’s
SERIES formula. Particularly handy is the multilevel Undo
button. Clicking this button simply erases the last two values in the range, and then
redefines the range names. Additional accoutrements include the ability to change
the color of the line, and display “smoothed” lines.
On the
CD-ROM
4799-2 ch18.F 6/11/01 9:40 AM Page 569
570
Part V ✦ Advanced Programming Techniques
Summary
In this chapter, I introduced the object model for charts, and showed how to write
VBA code to create and manipulate charts.
This chapter included several examples that made use of events. In the next chap-
ter, I cover the concept of events in detail.
✦✦✦
4799-2 ch18.F 6/11/01 9:40 AM Page 570
Understanding
Excel’s Events
I
n several previous chapters in this book, I presented exam-
ples of VBA “event-handler” procedures. An event-handler
procedure is a specially named procedure that is executed
when a specific event occurs. A simple example is the
CommandButton1_Click procedure that is executed when
the user clicks a CommandButton stored on a UserForm or on
a worksheet.
Excel is capable of monitoring a wide variety of events, and
executing your VBA code when a particular event occurs.
Following are just a few examples of the types of events that
Excel can recognize:
✦ A workbook is opened or closed
✦ A window is activated
✦ A worksheet is activated or deactivated
✦ Data is entered into a cell, or the cell is edited
✦ A workbook is saved
✦ A worksheet is calculated
✦ An object is clicked
✦ The data in a chart is updated
✦ A particular key or key combination is pressed
✦ A cell is double-clicked
✦ A particular time of day occurs
This chapter provides comprehensive coverage of the con-
cept of Excel events, and I include many examples that you
can adapt to your own needs. As you’ll see, understanding
events can give your Excel applications a powerful edge.
19
19
CHAPTER
✦✦✦✦
In This Chapter
An overview of the
types of events Excel
can monitor
Essential background
information for
working with events
Examples of
Workbook events,
Worksheet events,
Chart events, and
UserForm events
Using
Application
events to monitor all
open workbooks
Examples of
processing time-
based events and
keystroke events
✦✦✦✦
4799-2 ch19.F 6/11/01 9:40 AM Page 571
572
Part V ✦ Advanced Programming Techniques
Event Types That Excel Can Monitor
Excel is programmed to monitor many different events that occur. These events
may be classified as the following:
✦ Workbook events. Events that occur for a particular workbook. Examples of
such events include
Open (the workbook is opened or created), BeforeSave
(the workbook is about to be saved), and NewSheet (a new sheet is added).
✦ Worksheet events. Events that occur for a particular worksheet. Examples
include
Change (a cell on the sheet is changed), SelectionChange (the user
moves the cell indicator), and
Calculate (the worksheet is recalculated).
✦ Chart events. Events that occur for a particular chart. These events include
Select (an object in the chart is selected) and SeriesChange (a value of a
data point in a series is changed). To monitor events for an embedded chart,
you use a class module as demonstrated in Chapter 17.
✦ Application events. Events that occur for the application (Excel). Examples
include
NewWorkbook (a new workbook is created), WorkbookBeforeClose
(any workbook is about to be closed), and SheetChange (a cell in any open
workbook is altered). To monitor
Application-level events, you need to use
a class module.
✦ UserForm events. Events that occur for a particular UserForm or an object
contained on the UserForm. For example, a UserForm has an
Initialize
event (occurs before the UserForm is displayed), and a CommandButton on a
UserForm has a
Click event (occurs when the button is clicked).
✦ Events not associated with objects. The final category consists of two useful
Application-level events that I call “On-” events: OnTime and OnKey. These
work in a different manner than other events.
This chapter is organized according to the preceding list. Within each section, I
provide examples to demonstrate some of the events.
What You Should Know about Events
This section provides some essential information relevant to working with events
and writing event-handler procedures.
Understanding event sequences
As you’ll see, some actions trigger multiple events. For example, when you insert a
new worksheet into a workbook, this action triggers three
Application-level
events:
4799-2 ch19.F 6/11/01 9:40 AM Page 572
573
Chapter 19 ✦ Understanding Excel’s Events
✦ WorkbookNewSheet: Occurs when a new worksheet is added.
✦
SheetDeactivate event: Occurs when the active worksheet is deactivated.
✦
SheetActivate event: Occurs when the newly added worksheet is activated.
Event sequencing is a bit more complicated than you might think. The events
listed above are Application-level events. When adding a new worksheet, addi-
tional events occur at the Workbook level and at the Worksheet level.
At this point, just keep in mind that events fire in a particular sequence, and know-
ing what the sequence is can be critical when writing event-handler procedures.
Later in this chapter, I describe how to determine the order of the events that occur
for a particular action (see “Monitoring Application-level events”).
Where to put event-handler procedures
VBA newcomers often wonder why their event-handler procedures aren’t being exe-
cuted when the corresponding event occurs. The answer is almost always because
these procedures are located in the wrong place.
In the VB Editor window, each project is listed in the Projects window. The project
components are arranged in a collapsible list, as shown in Figure 19-1.
Figure 19-1: The components for each VBA
Project are listed in the Project window.
Each of the following components has its own code module:
✦ Sheet objects (for example, Sheet1, Sheet2, and so on).
✦
Chart objects (that is, chart sheets).
✦
ThisWorkbook object.
Note
4799-2 ch19.F 6/11/01 9:40 AM Page 573
574
Part V ✦ Advanced Programming Techniques
✦ General VBA modules. You never put event-handler procedures in a general
(that is, nonobject) module.
✦ Class modules.
Even though the event-handler procedure must be located in the correct module,
the procedure can call other standard procedures stored in other modules. For
example, the following event-handler procedure, located in the module for the
ThisWorkbook object, calls a procedure named WorkbookSetup, which could be
stored in a regular VBA module:
Private Sub Workbook_Open()
Call WorkbookSetup
End Sub
Disabling events
By default, all events are enabled. To disable all events, execute the following VBA
instruction:
Application.EnableEvents = False
To enable events, use:
Application.EnableEvents = True
Disabling events does not apply to events triggered by UserForm controls —for
example, the Click event generated by clicking a CommandButton control on a
UserForm.
Why would you need to disable events? The main reason is to prevent an infinite
loop of cascading events.
For example, suppose that cell A1 of your worksheet must always contain a value
less than or equal to 12. You can write some code that is executed whenever data is
entered into a cell to validate the cell’s contents. In this case, you are monitoring
the
Change event for a Worksheet using a procedure named Worksheet_Change.
Your procedure checks the user’s entry, and if the entry isn’t less than or equal to
12, it displays a message and then clears that entry. The problem is, clearing the
entry with your VBA code generates a new
Change event, so your event-handler
procedure is executed again. This is not what you want to happen, so you need to
disable events before you clear the cell, and then enable events again so you can
monitor the user’s next entry.
Another way to prevent an infinite loop of cascading events is to declare a Static
Boolean variable at the beginning of your event-handler procedure, such as this:
Static AbortProc As Boolean
Note
4799-2 ch19.F 6/11/01 9:40 AM Page 574
575
Chapter 19 ✦ Understanding Excel’s Events
Whenever the procedure needs to make its own changes, set the AbortProc vari-
able to True (otherwise, make sure it is set to False). Insert the following code at
the top of the procedure:
If AbortProc Then
AbortProc = False
Exit Sub
End if
The event procedure is reentered, but the True state of AbortProc causes the
procedure to end. In addition,
AbortProc is reset back to False.
For a practical example of validating data, see “Validating data entry,” later in this
chapter.
Disabling events in Excel applies to all workbooks. For example, if you disable
events in your procedure and then open another workbook that has, say, a
Workbook_Open procedure, that procedure will not execute.
Caution
Cross-
Reference
Programming Events in Older Versions of Excel
Versions of Excel prior to Office 97 also supported events, but the programming techniques
required to take advantage of those were quite different from those described in this chapter.
For example, if you have a procedure named
Auto_Open stored in a regular VBA module,
this procedure will be executed when the workbook is opened. Beginning with Excel 97,
the
Auto_Open procedure is supplemented by the Workbook_Open event-handler proce-
dure, stored in the code module for the
ThisWorkbook object, and executed prior to
Auto_Open.
Before Excel 97, it was often necessary to explicitly set up events. For example, if you
needed to execute a procedure whenever data was entered into a cell, you would need to
execute a statement such as:
Sheets(“Sheet1”).OnEntry = “ValidateEntry”
This statement instructs Excel to execute the procedure named ValidateEntry whenever
data is entered into a cell. With Excel 97 and later, you simply create a procedure named
Worksheet_Change and store it in the code module for the Sheet1 object.
For compatibility reasons, Excel 97 and later versions still support the older event mecha-
nism (although they no longer are documented in the online help system). If you’re devel-
oping applications that will be used only with Excel 97 or later, you’ll definitely want to use
the techniques described in this chapter.
4799-2 ch19.F 6/11/01 9:40 AM Page 575
576
Part V ✦ Advanced Programming Techniques
Entering event-handler code
Every event-handler procedure has a predetermined name. Following are some
examples of event-handler procedure names:
Worksheet_SelectionChange
Workbook_Open
Chart_Activate
Class_Initialize
You can declare the procedure by typing it manually, but a much better approach is
to let the VB Editor do it for you.
Figure 19-2 shows the code module for the
ThisWorkbook object. To insert a proce-
dure declaration, select
Workbook from the objects list on the left. Then select the
event from the procedures list on the right. When you do so, you’ll get a procedure
“shell” that contains the procedure declaration line and an
End Sub statement.
Figure 19-2: The best way to create an event procedure is
to let the VB Editor do it for you.
For example, if you select Workbook from the objects list and Open from the proce-
dures list, the VB Editor will insert the following (empty) procedure:
Private Sub Workbook_Open()
End Sub
Your code, of course, goes between these two statements.
4799-2 ch19.F 6/11/01 9:40 AM Page 576
577
Chapter 19 ✦ Understanding Excel’s Events
Event-handler procedures that use arguments
Some event-handler procedures use an argument list. For example, you may need to
create an event-handler procedure to monitor the
SheetActivate event for a work-
book. If you use the technique described in the previous section, the VB Editor will
create the following procedure:
Private Sub Workbook_SheetActivate(ByVal Sh As Object)
End Sub
This procedure uses one argument (Sh), which represents the sheet that was acti-
vated. In this case,
Sh is declared as an Object datatype rather than a Worksheet
datatype. That’s because the activated sheet can also be a chart sheet.
Your code can, of course, make use of the data passed as an argument. The follow-
ing procedure is executed whenever a sheet is activated. It displays the type and
name of the activated sheet by using VBA’s
TypeName function and accessing the
Name property of the object passed in the argument:
Private Sub Workbook_SheetActivate(ByVal Sh As Object)
MsgBox TypeName(Sh) & vbCrLf & Sh.Name
End Sub
Several event-handler procedures use a Boolean argument named Cancel. For
example, the declaration for a workbook’s
BeforePrint event is as follows:
Private Sub Workbook_BeforePrint(Cancel As Boolean)
The value of Cancel passed to the procedure is False. However, your code can
set
Cancel to True, which will cancel the printing. The following example
demonstrates:
Private Sub Workbook_BeforePrint(Cancel As Boolean)
Msg = “Have you loaded the 5164 label stock?”
Ans = MsgBox(Msg, vbYesNo, “About to print ”)
If Ans = vbNo Then Cancel = True
End Sub
The Workbook_BeforePrint procedure is executed before the workbook is
printed. This routine displays the message box shown in Figure 19-3. If the user
clicks the No button, Cancel is set to True and nothing is printed.
The BeforePrint event also occurs when the user previews a worksheet.
Note
4799-2 ch19.F 6/11/01 9:40 AM Page 577
578
Part V ✦ Advanced Programming Techniques
Figure 19-3: You can cancel the print operation by changing
the
Cancel argument.
Unfortunately, Excel does not provide a sheet-level BeforePrint event. Therefore,
your code cannot determine what is about to be printed.
Workbook-Level Events
Workbook-level events are events that occur within a particular workbook. Table
19-1 lists the workbook events, along with a brief description of each.
Workbook
event-handler procedures are stored in the code module for the ThisWorkbook
object.
Table 19-1
Workbook Events
Event Action that triggers the event
Activate A workbook is activated.
AddinInstall A workbook is installed as an add-in.
AddinUninstall A workbook is uninstalled as an add-in.
BeforeClose A workbook is about to be closed.
BeforePrint A workbook (or anything in it) is about to be printed
or previewed.
BeforeSave A workbook is about to be saved.
Deactivate A workbook is deactivated.
NewSheet A new sheet is created in a workbook.
Open A workbook is opened.
PivotTableCloseConnection* An external data source connection for a pivot table
is closed.
PivotTableOpenConnection* An external data source connection for a pivot table
is opened.
SheetActivate Any sheet is activated.
SheetBeforeDoubleClick Any worksheet is double-clicked. This event occurs
before the default double-click action.
4799-2 ch19.F 6/11/01 9:40 AM Page 578
579
Chapter 19 ✦ Understanding Excel’s Events
Event Action that triggers the event
SheetBeforeRightClick Any worksheet is right-clicked. This event occurs
before the default right-click action.
SheetCalculate Any worksheet is calculated (or recalculated).
SheetChange Any worksheet is changed by the user or by an
external link.
SheetDeactivate Any sheet is deactivated.
SheetFollowHyperlink A hyperlink on a sheet is clicked.
SheetPivotTableUpdate* A pivot table is updated with new data.
SheetSelectionChange The selection on any worksheet is changed.
WindowActivate Any workbook window is activated.
WindowDeactivate Any workbook window is deactivated.
WindowResize Any workbook window is resized.
* These events occur only in Excel 2002, and are not supported in previous versions.
If you need to monitor events for any workbook, you need to work with
Application-level events (see “Application Events,” later in this chapter).
The remainder of this section presents examples of using
Workbook-level
events. All of the example procedures that follow must be located in the
code module for the
ThisWorkbook object. If you put them into any other
type of code module, they won’t work.
The Open event
One of the most common events that is monitored is the Open event for a work-
book. This event is triggered when the workbook (or add-in) is opened, and exe-
cutes the
Workbook_Open procedure. A Workbook_Open procedure can do almost
anything, and often is used for tasks such as:
✦ Displaying welcome messages
✦ Opening other workbooks
✦ Setting up custom menus or toolbars
✦ Activating a particular sheet or cell
✦ Ensuring that certain conditions are met. For example, a workbook may
require that a particular add-in is installed.
✦ Setting up certain automatic features. For example, you can define key combi-
nations (see “The
OnKey event” later in this chapter).
Cross-
Reference
4799-2 ch19.F 6/11/01 9:40 AM Page 579