A Basic Guide for valuing a company phần 6 ppsx
Bạn đang xem bản rút gọn của tài liệu. Xem và tải ngay bản đầy đủ của tài liệu tại đây (121.68 KB, 30 trang )
140 Retail Home-Decorating Business Valuation
Retail Home-Decorating Business
Balance Sheet Reconstructed for Valuation
Recast
1992
Current Assets
Accounts Rec. $ 66,390
Inventory 220,660
Sales Promo. 92,155
Prepaid Exp. 7,005
Total Current Assets $ 386,210
Property & Equipment
Land (Fair Market Value) $ 75,000
Buildings (FMV) 577,900
Furniture/Fixture (FMV) 42,100
Machinery/Equipment (FMV) 4,000
Vehicle(s) (FMV) 27,250
Net Property/Equipment $ 726,250
TOTAL ASSETS $1,112,460
Current Liabilities
Accounts Payable $ 48,540
Customer Advances 12,455
Total Current Liabilities $ 60,995
TOTAL LIABILITIES $ 60,995
Adjusted Stockholder Equity $1,051,465
TOTAL LIABILITIES & EQUITY $1,112,460
Retail Home-Decorating Business
Reconstructed Income Statements
1990 1991 1992
Sales $1,236,425 $1,204,880 $1,107,585
Cost of Sales 754,920 756,205 677,580
Gross Profit $ 481,505 $ 448,675 $ 430,005
Expenses
Wages $ 69,620 $ 95,885 $ 92,725
Advertising 26,585 21,465 20,965
Vehicle Exp. 20,890 18,610 20,220
Bank Charges 475 1,270 1,280
Commissions 21,495 11,215 11,130
Brief Case Background 141
1990 1991 1992
Dues/Subs./Cont. 1,530 2,485 1,840
Freight 29,675 20,985 14,765
Insurance 24,400 25,475 14,675
Prof. Fees 4,755 4,195 6,595
Miscellaneous Exp. 810 200
Office Exp. 3,515 7,380 5,410
Equip. Lease 360 225 —
Repair/Maint. 21,105 12,085 13,985
Rubbish/Snow Rem. 2,340 2,295 2,385
Sales Promotion 6,000 17,665 9,710
Shop Supplies 3,485 3,690 6,540
Taxes 31,340 32,525 32,560
Telephone 9,905 10,925 8,500
Travel/Meetings 445 8,895 3,500
Utilities 16,590 25,530 16,835
Total Expenses $ 294,510 $ 323,610 $ 283,820
Rental Income $ 54,875 $ 61,250 $ 75,750
Recast Income $ 241,870 $ 186,315 $ 221,935
Income Without Rental $ 186,995 $ 125,065 $ 146,185
Retail Home-Decorating Business
Balance Sheet
1992
Current Assets
Cash $ 25,785
Accounts Rec. 66,390
Inventory 220,660
Sales Promo. 92,155
Prepaid Exp. 7,005
Total Current Assets $411,995
Property & Equipment
Land $ 25,000
Buildings 547,080
Furniture/Fixture 59,615
Machinery/Equipment 6,885
Vehicle(s) 68,205
Less: Accum. Deprec. מ 170,980
Net Property/Equipment $535,805
142 Retail Home-Decorating Business Valuation
Other Assets
Organization Exp. $ 190
Security Deposits 1,500
Const. in Process 18,850
Total Other Assets $ 20,540
TOTAL ASSETS $968,340
Current Liabilities
Current L-T Debt $ 10,260
Accounts Payable 48,540
Accrued Expense 8,800
Customer Advances 12,455
Total Current Liabilities $ 80,055
Long-Term Debt
Mortgage & Notes $313,270
Total Long-Term Debt $313,270
TOTAL LIABILITIES $393,325
Stockholder Equity
Common Stock $474,715
Retained Earnings $100,300
Total Stockholder Equity $575,015
TOTAL LIABILITIES & EQUITY $968,340
Retail Home-Decorating Business
Detail Reconstructed Income Statements
1990 1991 1992
Sales
Paint $ 122,985 $ 116,220 $ 159,900
Wallpaper 111,530 115,115 118,340
Custom Drapery 275,285 294,030 252,500
Carpet/Tile 529,520 468,430 394,375
Art Gallery 6,380 18,870 19,015
Labor 215,995 191,615 166,685
Accounts Receivable מ 21,675 — —
Miscellaneous 3,625 3,760 210
Less Returns מ 7,220 מ 3,160 מ 3,440
Total Sales $1,236,425 $1,204,880 $1,107,585
Financial Analysis 143
1990 1991 1992
Cost of Sales
Paint $ 87,105 $ 81,175 $ 109,965
Wallpaper 63,840 72,560 71,120
Custom Drapes 142,575 153,670 126,000
Carpet/Tile 321,800 280,975 227,445
Art 4,650 12,910 10,125
Subcontracting 15,610 37,330 36,150
Labor 117,630 112,930 79,230
Miscellaneous 2,415 — —
Inventory Variance מ 705 4,655 17,545
Total Cost of Sales $ 754,920 $ 756,205 $ 677,580
Taxes
FICA $ 12,830 $ 12,870 $ 11,870
Fed. Unemployment 1,450 1,300 945
State Unemployment 5,585 6,905 6,755
Excise/Registration 620 765 675
Real Estate 10,855 10,685 12,315
Total Taxes $ 31,340 $ 32,525 $ 32,560
Rental Income
Plaza Shops $ 12,000 $ 12,000 $ 12,000
Mini-Storage Units 42,875 49,250 63,750
Total Rental Income $ 54,875 $ 61,250 $ 75,750
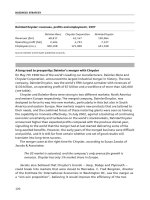
Note: This table adds minimally to the analysis section here; however, it is included primarily to
show that sales and expenses comprise many items, some of which can seasonally offset the
seasonability of other items. In this respect, it will help point out that items as they may appear
in ‘‘total’’ on many income statements can lead to inaccurate conclusions in forecasting, until
one assesses the contribution each item makes.
Financial Analysis
This business presents a number of issues that should be of concern to the
value processor. Sales appear to have reached a plateau and, in fact, are
waning. Gross profits, however, seem tightly woven to sales in each of the
three years. Recast income reveals that the business took quite a hit in
1991, sinking from $241,870 to $186,315, while sales remained essen-
tially the same. Without rentals, cash flow is quite subdued. Forty-seven
percent of the $55,555 hit came in the way of increased wages and 37%
through increased sales promotion expenses and utilities. Sales pr omotion
was a onetime write-off of derelict items, and utilities contained $9,000
of onetime construction expenses. Labor, however, was consider ed nec-
essary to sustain sales and was considered partially justified by an offset of
144 Retail Home-Decorating Business Valuation
lower commissions. The owner expressed satisfaction in the level of 1992
expenses in relationship to either 1991 or 1992 sales. At this point, we
could either reconstruct 1991 expenses to reflect the reduction of extraor-
dinary cost or simply accept the 1992 column as being indicative of an
appropriate cash stream to value. In light of the owner’s earlier remarks
that his business had peaked out at this location, we might accept this
premise and proceed with the analysis. Also, in making this assumption,
we would not ordinarily calculate a weighted average cash stream.
Ratio Study
Financial experts will not always agree as to which ratios are particularly
germane to the small and privately owned enterprise. I feel that it is es-
sential to examine the following.
Gross Profit
Ratio for Gross Margin ס or
Sales
1990
1991 1992
Industry
Median
38.9 37.2 38.8 37.7
This ratio measures the percentage of sales dollars left after cost of
goods sold (sometimes referred to as cost of sales) are deducted. The
significant trend in our retail company is for acceptable efficiency of the
selling process; however, in calculating this ratio we need to assure our-
selves that we included ‘‘apples’’ in our cost of goods that are comparable
to ‘‘apples’’ in the cost of goods in surveyed samples. Thus it is important
to explore the survey’s definition of items included in cost of goods and
perhaps even restructure the target company’s statements to reflect same-
case scenarios.
It should be noted that ratios for net profit, before and after taxes, can
be most useful ratios. But the fact that private owners frequently manage
their businesses to ‘‘minimize’’ the bottom line will often produce little
meaningful information from these ratios applied to smaller businesses.
Therefore, these ratios are not included. Balance sheet data necessary for
calculating certain ratios for 1990 and 1991 are not included in the text;
however, I have presented the ratios in those categories affected to com-
plete the range of values.
The current ratio provides a rough indication of a company’s ability to
Financial Analysis 145
service its obligations due within one year. Progressively higher ratios sig-
nify increasing ability to service short-term obligations. Bear in mind that
liquidity in a specific business is an element of asset composition. Thus,
the ‘‘acid test’’ ratio that follows is perhaps a better indicator of liquidity
overall. In this particular business, we must note that $92,155 of current
assets are sales promotion devices that are unlikely to be turned back into
cash per se.
Total Current Assets
Current Ratio ס or
Total Current Liabilities
1990
1991 1992
Industry
Median
3.2 2.6 5.1 1.7
Note: Unreconstructed balance sheet used.
The quick, or acid test, ratio is a refinement of the current ratio and
more thoroughly measures liquid assets of cash and accounts receivable
in the sense of ability to pay off current obligations. Higher ratios indicate
greater liquidity as a general rule.
Cash and Equivalents ם Receivables
Quick Ratio ס or
Total Current Liabilities
1990
1991 1992
Industry
Median
.8 .7 1.2 .7
Note: Cash and equivalents equal all-cash, marketable securities, and other near-cash items. It
excludes sinking funds.
Less than a ratio of 1.0 can suggest a struggle to stay current with
obligations. The median offers that the industry as a whole may wrestle
with liquidity problems by the nature of doing business; however, the top
25% of reported companies reflect a ratio of 1.6.
(Income Statement)
Sales
Sales/Receivable Ratio ס or
Receivables
(Balance Sheet)
146 Retail Home-Decorating Business Valuation
1990 1991 1992
Industry
Median
17.1 11.3 16.7 13.9–22.4
This is an important ratio and measures the number of times that re-
ceivables turn over during the year. Our target company seems to turn
these over in tune with the industry median.
365
Day’s Receivable Ratio ס or
Sale/Receivable Ratio
1990
1991 1992
Industry
Median
21 32 19 26–16 days
This highlights the average time in terms of days that receivables are
outstanding. Generally, the longer that receivables are outstanding, the
greater the chance that they may not be collectible. Slow-turnover ac-
counts merit individual examination for conditions of cause. In our case
example, three years show inconsistency in collections although they do
fall within the industry median range.
Cost of Sales
Cost of Sales/Payables Ratio ס or
Payables
1990
1991 1992
Industry
Median
16.4 16.5 14.0 14.3
Note: Cost of sales and cost of goods sold are interchangeable terms.
Generally, the higher their turnover rate, the shorter the time between
purchase and payment. Lower turnover suggests that the company may
frequently pay bills from daily in-store cash receipts due to slower receiv-
able collections. This practice can be somewhat misguided in light of in-
vestment principles whereby one normally attempts to match collections
relatively close to payments so that more business income can be directed
into the pockets of owners. Some businesses may, however, have little
choice.
Sales
Sales/Working Capital Ratio ס or
Working Capital
Financial Analysis 147
1990 1991 1992
Industry
Median
4.6 4.4 3.4 11.7
Note: Current assets less current liabilities equals working capital.
A low ratio may indicate an inefficient use of working capital, whereas
a very high ratio often signals a vulnerable position for creditors. Our
target company has been below the median and may increasingly be grow-
ing inefficient in the use of its working capital.
To analyze how well inventory is being managed, the cost of sales to
inventory ratio can identify important potential shortsightedness.
Cost of Sales
Cost of Sales/Inventory Ratio ס or
Inventory
1990
1991 1992
Industry
Median
3.5 3.2 3.1 7.2
A higher inventory turnover can signify a more liquid position and/or
better skills at marketing, whereas a lower turnover of inventory may in-
dicate shortages of merchandise for sale, overstocking, or obsolescence in
inventory. Our case example falls into the lower quartile as regards inven-
tory management. This should signal the need for a particular examination
of inventory as to quality and size.
Conclusions
Financial analysis does not conclude with ratio study, but for our purpose
it will suffice. Sales have been flat, the owner losing interest, and perhaps
his territory ‘‘maxed’’ out. If his assessment for growth is accurate, the
value of his business is to be found in the history up to 1992. Growth by
way of new product development or new locations can be costly growth.
Certainly the values in these ideas belong to the person who pays for and
executes them, and maintaining present levels in sales may take more than
just labors of love. This case exhibits conditions where the use of ‘‘dis-
counted’’ processes may be least likely to produce satisfactory results.
148 Retail Home-Decorating Business Valuation
The Valuation Exercise
Book Value Method
Total Assets at Year-End 1992 $968,340
Total Liabilities 393,325
Book Value at Year-End 1992 $575,015
Adjusted Book Value Method
Assets
Balance Sheet
Cost
Fair Market
Value
Cash $ 25,785 $ 25,785
Acct./Rec. 66,390 66,390
Inventory 220,660 220,660
Sales Promo. 92,155 92,155
1
Prepaid Exp. 7,005 7,005
Real Estate 572,080 652,900
2
Equipment, Etc. 134,705 73,350
2
Other 20,540 20,540
Accumulated Deprec. מ 170,980
—
Total Assets $ 968,340 $1,158,785
Total Liabilities $ 393,325
$ 393,325
Adjusted Book Value at 1992 $ 575,015 $ 765,460
1
While sample material may have little resale value, promotional devices are necessary to generate
sales. Subsequently, when the business is sold as a ‘‘going concern,’’ these items can be included
at book value. I caution, however; sales promotion items can experience very short life spans,
particularly in a home decorating business where styles change rapidly.
2
Stated at appraised and, thus, fair market value.
Hybrid Method
(This is a form of the capitalization method.)
1 ס High amount of dollars in assets and low-risk business venture
2 ס Medium amount of dollars in assets and medium-risk business
venture
3 ס Low amount of dollars in assets and high-risk business venture
The Valuation Exercise 149
1 2 3
Yield on Risk-Free Investments Such as
Government Bonds
a
(Often 6%–9%) 8.0% 8.0% 8.0%
Risk Premium on Nonmanagerial Investments
a
(corporate bonds, utility stocks) 4.5% 4.5% 4.5%
Risk Premium on Personal Management
a
7.5% 14.5% 22.5%
Capitalization Rate 20.0% 27.0% 35.0%
Earnings Multipliers 5 3.7 2.9
a
These rates are revised periodically to reflect changing economies. They can be composed
through the assistance of expert investment advisers if need be.
This particular version of a hybrid method tends to place 40% of busi-
ness value in book values.
Book Value at Year-End 1992 $575,015
Add: Appreciation in Assets 190,445
Book Value as Adjusted $765,460
Weight to Adjusted Book Value 40%
$ 306,184
1992 Net Income $221,935
Times Multiplier ן3.7
$ 821,160
Total Business Value $1,127,344
Excess Earnings Method
(This method considers cash flow and values in hard assets, estimates in-
tangible values, and superimposes tax considerations and financing str uc-
tures to prove the most-likely equation.)
1992 Cash Flow $ 221,935
Less: Comparable Salary מ 45,000
Less: Contingency Reserve מ 5,000
Net Cash Stream to Be Valued $ 171,935
Cost of Money
Market Value of Tangible Assets, Minus Liabilities
1
(see reconstructed balance sheet) $1,051,465
Times: Applied Lending Rate ן10%
Annual Cost of Money $ 105,147
150 Retail Home-Decorating Business Valuation
Excess of Cost of Earnings
Return Net Cash Stream to Be Valued $ 171,935
Less: Annual Cost of Money מ 105,147
Excess of Cost of Earnings $ 66,788
Intangible Business Value
Excess of Cost of Earnings $ 66,788
Times: Intangible Net Multiplier Assigned ן2.5
*
Intangible Business Value $ 166,970
Add: Tangible Asset Value 1,051,465
TOTAL BUSINESS VALUE (Prior to Proof) $1,218,435
(Say $1,220,000)
Financing Rationale
Total Investment $1,220,000
Less: Down Payment מ 300,000
Balance to Be Financed $ 920,000
1
Minus liabilities whenever liabilities are sold with business.
*Refer to Figure 9.1 ‘‘Guide to Selecting Net Multipliers,’’ in Chapter 9.
At this point, we must gauge the amount in prospective bank financing.
It’s important to use a good deal of logic at this stage of valuation or you
will waste a lot of time coming up with reliable estimates. One can set up
the financing scenario any way appropriate to the local conditions, but my
guess is that the following would be pretty close.
Real Estate ($652,900) at 70% $457,030*
Furniture/Fixture ($42,100) at 30% 12,630
Equipment ($4,000) at 0 Value –0–
Vehicles ($27,250) at 25% 6,813
Inventory ($220,660) at 50% of Book Value 110,330
Receivables Minus Payables ($17,850 at 0 Value) –0–
Estimated Bank Financing $586,803
(Say $590,000)
*Bankers often calculate a strange configuration when real estate that has separate cash flow is
included in business financing. Noting the reconstructed income statements, rental incomeequals
$75,750 in 1992. 70% of $75,750 equals $53,025 and annual payments of principal and interest
on $460,000 of debt equals $53,269. Neat little ‘‘cushion,’’ wouldn’t you say?
I must interrupt the process flow for a moment to remind readers that
real estate sold with a ‘‘going concern’’ should be treated just as all other
assets for the purpose of business valuation. Unless, of course, intangible
business value in the foregoing calculation is ‘‘0’’ or a negative number.
In that case, there is no business value to report in excess of the values in
hard assets, including real estate. Such being exhibited translates into
The Valuation Exercise 151
assets-only for sale, and, subsequently, appraisal of assets versus business
valuation would be the assignment undertaken. However, one should not
neglect a possibility that real estate could be leased rather than sold. In
our example, real estate enjoys strong cash flows and could remain an
excellent investment for the previous business owner. In this event, busi-
ness value would be examined without the real estate asset, expenses in-
creased to include ‘‘rent’’ paid, and the rental income removed from
reconstructed cash flows. So many years using the ‘‘excess’’ method have
taught me the ‘‘gut-feel’’ as to which way to initially proceed. When in
doubt, I start as I have here, because a facility is necessary to conduct
business, and one way or the other, there will be a cost associated with
housing. The formula walks me into examining the correct pew I must
ultimately consider. In spite of what I’ve just said, real estate and other
hard assets will always have ‘‘stand-alone values.’’ These must be known
to the best of your ability, regardless of the strengths or weaknesses of
business cash flow. Business-value estimating that portends to depress fair
market values of real estate and other hard assets is irresponsible reporting.
Bank (10% ן 20 years)
Amount $590,000
Annual Principal/Interest Payment 68,324
Testing Estimated Business Value
Return: Net Cash Stream to Be Valued $171,935
Less: Annual Bank Debt Service (P&I) מ 68,324
Pretax Cash Flow $103,611
Add: Principal Reduction 11,700
*
Pretax Equity Income $115,311
Less: Est. Dep. & Amortization (Let’s Assume) מ 33,930
Less: Estimated Income Taxes (Let’s Assume) מ 1,600
Net Operating Income (NOI) $ 79,781
*Debt service includes an average $11,700 annual principal payment that is traditionally recorded
on the balance sheet as a reduction in debt owed. This feature recognizes that the ‘‘owned equity’’
in the business increases by this average amount each year.
Return on Equity:
Pretax Equity Income $115,311
סס38.4%
Down Payment $300,000
Return on Total Investment:
Net Operating Income $ 79,781
סס7.1%
Total Investment $1,120,000
152 Retail Home-Decorating Business Valuation
Although return on total investment is abysmally low in relationship to
conventionally expected investment returns, the return on equity is at-
tractively high and cash flow is strong.
Basic Salary $ 45,000
Net Operating Income 79,781
Gain of Principal 11,700
Tax-Sheltered Income (Dep.) 33,930
Effective Income $170,411*
*There is also the matter of $5,000 annually into the contingency and replacement reserve that
would be at the discretion of the owner if not required for emergencies or asset replacements.
At this time we have taken our first shot at estimating business value,
but we are still missing a vital element in the process. A $300,000 cash
down payment plus $590,000 in bank financing, or $890,000, leaves us
with a $330,000 shortfall of the all-cash target specified by the generic
definition of fair market value. It also leaves us $330,000 short in closing
a deal. If we leave the price at $1,220,000, either the buyer has to make
up the difference outside this business, or the seller must become flexible
toward providing $330,000 of seller financing, or find another buyer with
more cash, or the estimated price must be ‘‘squeezed’’ to fit the conditions
of the projected buyer. Stated at the outset, our seller agreed to provide
some financing, as long as he could realize at least $250,000 prior to
personal taxes. The $890,000 forecast through down payment and insti-
tutional financing more than meets the target, thus we can proceed to
insert seller debt into the equation.
Financing Rationale
Total Investment $1,220,000
Less: Down Payment מ 300,000
Balance to Be Financed $ 920,000
Bank (10% ן 20 years)
Amount $ 590,000
Annual Principal/Interest Payment 68,324
Seller (8% ן 10 years)
Amount $ 330,000
Annual Principal/Interest Payment 48,046
Total Annual Principal/Interest Payment $ 116,370
The Valuation Exercise 153
Testing Estimated Business Value
Return: Net Cash Stream to Be Valued $ 171,935
Less: Annual Bank Debt Service (P&I) מ 116,370
Pretax Cash Flow $ 55,565
Add: Principal Reduction 26,334
*
Pretax Equity Income $ 81,899
Less: Est. Dep. & Amortization (Let’s Assume) מ 33,930
Less: Estimated Income Taxes (Let’s Assume) –0–
*
Net Operating Income (NOI) $ 47,969
*Debt service includes an average $26,334 annual principal payment that is traditionally recorded
on the balance sheet as a reduction in debt owned. This feature recognizes that the ‘‘owned
equity’’ in the business increases by this average amount each year. Tax obligations are reduced
since increased interest expense is deductible from business cash flow.
Return on Equity:
Pretax Equity Income $ 81,899
סס27.3%
Down Payment $300,000
Return on Total Investment:
Net Operating Income $ 47,969
סס3.9%
Total Investment $1,220,000
Note that returns change quite a bit under our new scenario, but the
return on equity is still high in relationship to alternative investments for
the $300,000 cash being used as down payment.
Buyer’s Potential Cash Benefit
Forecast Annual Salar y $ 45,000
Pretax Cash Flow (contingency not considered) 55,565
Income Sheltered by Depreciation 33,930
Less: Provision for Taxes –0–*
Discretionary Cash $134,495
Add: Equity Buildup 26,334
Discretionary and Nondiscretionary Cash $160,829
*Assumes that buyer would increase salary to avoid double taxation by paying taxes at the business
level.
As a matter of practicality, I know that the owner of this business with-
drew take-home pay slightly over $160,000 in pretax 1992 dollars. The
actual earnings of a present owner has always been somewhat of a bench-
mark criterion that I shoot for in terms of evaluating a prospective buyer’s
potential earnings. Some people remark that this is giving away the
‘‘kitchen sink,’’ but I don’t think so, particularly when you consider that
154 Retail Home-Decorating Business Valuation
owners can stay in their businesses and continue to earn if they wish to
do so. I have another philosophy to share: Buyers are not obligated to
feather the nest of sellers . . . ever! There’s a happy median for both, and
that’s usually the point at which sellers and buyers are equally stretched
by the process of actual sale. To my way of thinking, that is where true
business value lies. Prospective buyers should not, in the process of pur-
chase, be able to immediately earn more than sellers have earned, but at
the same time, sellers cannot expect to earn from their buyers what they
could not earn from their business while they ran it. The debt leverage of
cash streams can be tight as a drum in the purchase of fast-growing com-
panies, but in cases like this retail operation, wher e sales, earnings, and
growth are stagnant, the prospective buyer deserves wiggle room to expand
the business in years to come. That means that more ‘‘jingle’’ must be
dumped into the buyer’s equation or the business simply won’t sell. If the
estimated value does not forecast a likely sale, then the estimate is wrong
. . . period!
Seller’s Potential Cash Benefit in Sale
Cash Down Payment $300,000
Bank Financing Receipts 590,000
Gross Cash at Closing $890,000*
*From which must be deducted capital gains and other taxes. Structured appropriately, the deal
qualifies as an ‘‘installment’’ sale with the proceeds in seller financing put off regarding taxes
until later periods.
Projected Cash to Seller by End of 10th Year
Cash at Closing $ 890,000
Add: Projected 10-Year Principal and Interest Payments to Seller 480,457
Pretax 5-Year Proceeds $1,370,457
This owner paid $600,000 for his business seven years ago. That’s
128.4% return on his original purchase, or an average dollar return of
$110,065 per each of the seven years between 1986 and now. This does
not include what he earned in the way of salary for operating his business.
$290,000 over his original purchase ($890,000 in cash minus $600,000)
might be likely realized on a date of sale. Calculated any way one wishes,
return to this owner is just and wouldn’t be likely to be r epeated in the
stock market or in a job with corporate America. Want to know the end
of the story? I’m happy—this was my business . . . I was the seller! I sold
the business separate of real estate, ultimately sold the real estate later to
an investment group, sold the wholesale carpet division separately, and I
grew richer in the process. The years were 1969, 1970, and 1971—not
The Valuation Exercise 155
1990, 1991, and 1992 as her ein stated to keep a secret up to this point.
I returned to college during 1970 and spent less than two hours per busi-
ness day in my operation. Thus labor costs fit the scenario for me. How-
ever, my time away did have an impact on business.
Today, I value other businesses as I did through the purchase and sale
of five small companies—from the trenches, not from academia! Today I
own two enterprises alone, and two others with partners. I didn’t have
two sticks to make fire when I started my small-business rampage nearly
30 years ago. Business valuation is estimating what real players will do,
and real players add eons to the yardsticks of conventionally accepted
measurement. Ignore how buyers think and act, and you’re guaranteed
to miss your target estimation. Comparable business sales are virtually
useless because there are no comparable business operators. Individuals
are unique and not very predictable . . . less so for buyers who read books.
Forget the Scientist, This Is What Counts Method
Offering Price $1,220,000
Less: Down Payment מ 300,000
Less: Financing מ 920,000
‘‘Uncovered’’ Debt – 0–
Cash Flow (commonly used last completed year,
assuming that conditions of the business
warrant such) $ 221,935
Less: Principal/Interest מ 116,370
Cash Flow Free of Debt $ 105,565
At 7 times earnings value ס $ 738,955
At 9 times earnings value ס $ 950,085
Business Is Fairly Priced If:
1. Asking price is not greater than 150% of net worth (except where
reconstructed profits are 40% of asking price).
a. Net worth $1,051,465 times 150% equals $1,577,198.
b. Reconstructed profits $221,935 divided by asking price
$1,220,000 equals 18.2%.
2. At least 10% sales growth per year being realized.
a. No growth.
156 Retail Home-Decorating Business Valuation
3. Down payment is approximately the amount of one year’s recon-
str ucted profits.
a. $300,000 minus $221,935 or $78,065 (35.2%) more.
4. Terms of payment of balance of purchase price (including interest)
should not exceed 40% of annual reconstructed profit.
a. Debt service $116,370 divided by $221,935 equals 52.4%.
What does all this mean for estimated value? It means that the price in
the deal through the eyes of buyers, if they have read a multitude of pub-
lications whence this information was gleaned, could be viewed as a bit
much to pay. Thus, we might conclude that $1,220,000 would be the
maximum estimated value. Perhaps a most-likely selling price might be in
the range of $900,000 to $950,000. Quite honestly, that is the reason that
I split my sale of business and real property; because, as with many sellers,
I too wanted my price. That’s what is so good about small business—
owners and purchasers can be flexible as to final deals.
Rule-of-Thumb Estimates
Well-established small retail companies with strong evidence of good op-
erating performances have been known to change hands in the range of
4 to as high as 6 times reconstructed earnings. Thus for this case, estimated
value ranges from a low of $887,740 to a high of $1,331,610 could be
expected in any given market. The $1,220,000 price tag in our example
translates into 5.5 times earnings. Another ‘‘rule’’ suggests .75 to 1.5
times net plus equipment and inventory. Bear in mind that the projected
sale included receivables, payables, sales promotion samples, and customer
advances that need to be reconciled and included when using this rule. If
we were to average the low and high at 1.12, $640,127 would be forecast
as value . . . not including real estate. When using rule-of-thumb estimat-
ing, these ratios rarely, if ever, take the value of real estate into consider-
ation. Real estate cannot be arbitrarily added to the rule-of-thumb value,
and purchase of facilities must meet the test of cash flow.
Rule-of-Thumb Estimates 157
Results
Book Value Method $ 575,015
Adjusted Book Value Method 765,460
Hybrid (capitalization) Method 1,127,344
Excess Earnings Method 1,220,000
Forget the Scientist Method $738,955 to 950,085
Rule-of-Thumb Estimate $887,740 to 1,331,610
As mentioned elsewhere, I traditionally calculate the book and adjusted
book value scenarios, although I know that good operations will rarely
change hands at these prices. Data from these, however, are an important
consideration to the hybrid and excess ear nings formulas; and because
some businesses have not produced cash flows strong enough to support
values beyond these hard-asset values. Thus overall business values may
not be greater than the values they hold in these hard assets.
We guessed fr om initial review of the balance and income statements
that this retail operation had an added overall intangible value that was
greater than the value in its assets. What we didn’t know at that time was
how much more could be justified.
For added flavor, the new business owner leased the facilities for
$14,400 per year. This plus the $75,750 rental income came to $90,150
triple net real estate income. The business was sold for $550,000 and real
estate later at $700,000. Together, these sales derived $1,250,000. The
wholesale portion was another source of profit. Needless to say, I’m
pleased to report that seller financing kept my kids in shoes for quite a
while.
The Japanese have a philosophy about life that we Americans might
well be advised to adopt: kaizen (continuous improvement). Business
valuation processors cannot possibly know it all, but they can always
benefit through continuous improvement. I, for one, have no other
choice; I do it to survive.
W.M.Y.
158
16
Retail Hardware Stores
Smaller retail hardware stores can be distinguished from other retail opera-
tions by the vast complexity of diversified lines of merchandise. For ex-
ample, most serve virtually every trade contractor, such as plumbers,
electricians, millers, roofers, painters, and builders, as well as do-it-your-
selfers. Lines can include lawn and garden suppliers, power generators,
garden tractors, tools, housewares, unpainted furniture, car supplies,
Christmas items, sportswear, artist supplies, toys, interior decorating ma-
terials, greeting cards, glassware, farm equipment, and so on. Individual-
store inventory tends to model the general needs within the community
wherever the store is located.
Sales in hardware stores are less likely to be affected by seasonal ups
and downs, since much of their merchandise can be ‘‘shifted’’ to meet
seasonal characteristics. Fall and spring may provide a little more volume,
and as with many other retail stores, the first two months of each new
calendar year can be somewhat slack from overexpenditures leading up to
Christmas.
Independent retail stores are faced with tough competition on many
fronts these days. Chain and discount stores, lumber dealers with hardware
(and few don’t have it), and specialty dealers such as paint, electrical, and
plumbing wholesalers affront daily the small independent from all angles.
Because of quantity buying discounts enjoyed by the ‘‘bigs,’’ independ-
ents have been forced to model their general inventories after lower-priced
merchandise and/or be very selective over what, if any, high-quality prod-
ucts might be carried. However, many independents benefit and survive
by joint buying cooperatives such as Ace, True Value, Coast-to-Coast, and
others. The key to successful operation and survival can weigh heavily in
effective management of contribution ratios per department or product
Brief Case History 159
line. Computerization plays a vital role, or should do so, in daily manage-
ment.
Inventory control is essential if one is to be successful in the retail
hardware game. Misguided purchasing decisions, particularly seasonal
merchandise, can create costly storage and holding problems. Daily cash
and charge sales, stock replenishment, pricing, and so on can quickly get
out of control if not rigorously watched.
Brief Case History
This retail hardware business serves customers from three leased facilities
located approximately 30 miles apart. The two larger units now suffer
major competition caused by the opening of a Wal-Mart midyear 2000,
which is situated equidistant from these stores. The units are absentee-
owned by a wealthy medical professional who bought them originally as
an investment.
I am including this case for several reasons: (a) to show you should
never be impressed by the size of sales alone; (b) to point out pitfalls of
absentee ownership, especially in this type of business; and (c) to show
how value is affected by the distressed nature of a business.
When assignments involve multiple sites, financial analysis should al-
ways include the study of each store individually, as well as profit contri-
butions for each pr oduct line by individual store. However, for the
purpose of brevity in this chapter, we will use the following consolidated
statements.
Retail Hardware Stores
(Three Locations Consolidated)
Balance Sheets (Not Reconstructed)
1998 1999 2000 2001
Assets
Current
Cash $ 142,676 $ 77,635 $ 189,505 $ 13,820
Acct./Rec. 125,296 125,266 178,552 99,090
Inventory 410,574
678,524 713,088 377,592
Total Current $ 678,546 $ 881,425 $1,081,145 $ 490,502
160 Retail Hardware Stores
1998 1999 2000 2001
Prop. Equip.
Lease Imp. $ 10,559 $ 10,559 $ 22,529 $ 13,436
Vehicles 12,906 12,906 32,263 7,772
Furn./Fixture 54,724 59,208 61,268 48,414
Less: Deprec. מ 41,814
מ 52,744 מ 67,624 מ 52,825
Total Prop. Equip. $ 36,375 $ 29,929 $ 48,436 $ 16,797
Other
Note/Rec.—Officer $ 91,760 $ 106,986 $ 264,738 $ 41,114
Security Deposit 592
592 592 592
Total Other $ 92,352 $ 107,578 $ 265,330 $ 41,706
TOTAL ASSETS $ 807,273 $1,018,932 $1,394,911 $ 549,005
Liabilities
Current Liab.
L-T Debt (Current) $ 15,117 $ 38,780 $ 48,316 $ 16,867
Acct./Pay. 142,891 247,514 254,202 255,280
Accrued Exp. 40,055 71,122 30,898 8,388
Taxes Payable 20,151
15,390 15,945 6,677
Total Current Liab. $ 218,214 $ 372,806 $ 349,361 $ 287,212
Noncurrent
Long-Term Debt $ 374,585 $ 424,244 $ 812,703 $ 391,506
Total Noncurrent $ 374,585 $ 424,244 $ 812,703 $ 391,506
TOTAL LIABILITIES $ 592,799 $ 797,050 $1,162,064 $ 678,718
Shareholder Equity $ 214,474 $ 221,882 $ 232,847 $מ129,713
TOTAL LIABILITIES
& SHAREHOLDER
EQUITY $ 807,273 $1,018,932 $1,394,911 $ 549,005
Retail Hardware Stores
(Three Locations Consolidated)
Reconstructed Balance Sheets for Valuation
Recast
2001
Assets
Current
Cash $ 13,820
Acct./Rec. 99,090
Inventory 377,592
Total Current $490,502
Brief Case History 161
Recast
2001
Prop. Equip.
Lease Imp. $ 10,000
Vehicles 5,000
Furn./Fixture 26,550
Total Prop. Equip. $ 41,550
Other
Security Deposit 592
Total Other $ 592
TOTAL ASSETS $532,644
Liabilities
Current Liab.
Acct./Pay. $255,280
Accrued Exp. 8,388
Taxes Payable 6,677
Total Current Liabilities $270,345
TOTAL LIABILITIES $270,345
Equity $262,299
TOTAL LIABILITIES & SHAREHOLDER EQUITY $532,644
Retail Hardware Stores
(Three Locations Consolidated)
Reconstructed Income Statements—Valuation for Sale Purposes
1998 1999 2000 2001
Sales $1,182,354 $1,977,453 $2,167,160 $2,404,836
Cost of Sales 777,807 1,290,564 1,486,823 1,679,628
Gross Profit $ 404,547 $ 686,889 $ 680,337 $ 725,208
% Gross Profit 34.2% 34.7% 31.4% 30.2%
Expenses
Wages $ 118,479 $ 222,694 $ 237,380 $ 248,212
Insurance—Group 3,520 7,298 13,366 23,028
Insurance—Gen. 17,168 4,949 8,850 12,954
Advertising 40,140 98,107 99,730 118,806
Freight 4,596 15,677 22,676 19,814
Utilities 8,132 21,750 23,230 43,159
Telephone 6,152 13,181 16,834 17,441
Office Supplies 4,777 7,909 9,779 13,237
Contributions 775 — 1,324 —
Bad Debt 860 1,776 2,148 464
Prof. Fees 8,449 12,863 8,164 7,022
162 Retail Hardware Stores
1998 1999 2000 2001
Repair/Maint. 3,018 6,188 9,470 2,713
Miscellaneous 8,940 4,149 2,142 11,211
Travel/Ent. 2,586 4,129 4,955 10,188
Property Taxes 1,576 7,106 6,511 17,390
Package/Process 1,118 7,357 4,969 7,357
Rent 75,381 90,952 95,990 77,200
Store Supplies 4,701 13,397 18,977 15,165
Dues & Subs. 730 2,333 378 1,637
Bank Charges 193 1,347 3,676 8,528
Total Expenses $ 311,291 $ 543,162 $ 590,549 $ 655,526
Recast Income $ 93,256 $ 143,727 $ 89,788 $ 69,682
Recast Income as a Percent
of Sales 7.9% 7.3% 4.1% 2.9%
Financial Analysis
Three key points on this business’s nonreconstructed balance sheet should
trigger immediate alarm to the value processor. The amount of increased
long-term debt in 2000, the staggering decrease in total assets for 2001,
and the ensuing negative net worth of מ$129,713 at the end of 2001.
This balance sheet, because of so many irregularities year to year, provides
an ideal example of where ratio study can prove especially useful to an
overall analysis. Although it is clear that a financial problem more than
likely predated 1998, it is also clear that the situation has grown progres-
sively worse during the past four years. Ratio study will highlight where
difficulties are most pronounced, but before calculating this information,
we must discover what happened to cause a near doubling of long-term
debt. On the strength of the balance sheet through 1999, it appears in-
conceivable that this business could have been able to refinance its debt
at all.
That, in fact, was the case theabsentee owner pledged a mortgage
on his personal home. In addition, he auctioned the assets at a ‘‘fourth’’
site during late 2000 and used the proceeds to reduce long-term debt.
Unfortunately, auction returns were inadequate to both reduce debt and
pay off that location’s pro rata share of accounts payable. One could offer
any number of criticisms with regard to the best use of proceeds; however,
it became obvious that he was bothered considerably by leaving business
Financial Analysis 163
debt tied for long to his personal home. Given these conditions, it makes
sense to be concerned about the ‘‘reliability’’ of 2001 sales and expenses.
For simplicity, 2001 reflects the necessary adjustments to operations that
remained after closing the fourth store; extraordinary and/or onetime
costs have been removed, and 2001 income data reflect the r emaining
three stores.
Ratio Study
Gross Profit
Ratio for Gross Margin ס or
Sales
1998
1999 2000 2001
Industry
Median
34.2 34.7 31.4 30.2 39.1
This ratio measures the percentage of sales dollars left after cost of
goods sold is deducted. The significant trend in our hardware company
is for decreasing efficiency of the selling process, ending with the latest
year nearly 9% below industry median. The two stores near to Wal-Mart
have been heavily discounting to remain competitive. This situation alone
steals nearly $208,000 of gross profit away from operations.
It should be noted that ratios for net profit, before and after taxes, can
be most useful ratios. But the fact that private owners frequently manage
their businesses to ‘‘minimize’’ bottom lines will often produce little
meaningful information from these ratios applied to smaller businesses.
Therefore, these ratios are not included.
The current ratio provides a rough indication of a company’s ability to
service its obligations due within the time frame of one year. Progressively
higher ratios signify increasing ability to service short-term obligations.
Bear in mind that liquidity in a specific business is a critical element of
asset composition. Thus, the acid test ratio that follows is perhaps a better
indicator of liquidity overall.
Total Current Assets
Current Ratio ס or
Total Current Liabilities
1998
1999 2000 2001
Industry
Median
3.1 2.4 3.1 1.7 2.6
Note the significant drop in the ratio for 2001.
164 Retail Hardware Stores
The quick, or acid test, ratio is a refinement of the current ratio and
more thoroughly measures liquid assets of cash and accounts receivable
in the sense of ability to pay off current obligations. Higher ratios indicate
greater liquidity as a general rule.
Cash and Equivalents ם Receivables
Quick Ratio ס or
Total Current Liabilities
1998
1999 2000 2001
Industry
Median
1.2 .5 1.1 .4 .4
A ratio lower than 1.0 can suggest a struggle to stay current with ob-
ligations. The median offers that the industry as a whole may wrestle with
liquidity problems by the nature of doing business, and the top 25% of
reported companies reflect a ratio of only .8.
(Income Statement)
Sales
Sales/Receivable Ratio ס or
Receivables
(Balance Sheet)
1998
1999 2000 2001
Industry
Median
9.4 15.8 12.1 24.3 31.8–57.9
This is an important ratio and measures the number of times that re-
ceivables turn over during the year. Our target company seems to turn
these over quite below the industry median, which suggests that credit
extension and collection processes may not be adequately managed.
365
Days’s Receivable Ratio ס or
Sales/Receivable Ratio
1998
1999 2000 2001
Industry
Median
39 23 30 15 11–6 days
This highlights the average time in terms of days that receivables are
outstanding. Generally, the longer that receivables are outstanding, the
greater the chance that they may not be collectible. Slow-turnover ac-
counts merit individual examination for conditions of cause. In our case
example, four years show irregularity in collections, although 2001 has