The Options Course High Profit & Low Stress Trading Methods Second Edition phần 5 potx
Bạn đang xem bản rút gọn của tài liệu. Xem và tải ngay bản đầy đủ của tài liệu tại đây (720.71 KB, 59 trang )
Let’s examine a long synthetic straddle by shorting the stock and buy-
ing two September XYZ 50 calls @ 2.50 against XYZ trading at $50 per
share. The maximum risk is limited to the net cost of the calls plus the dif-
ference in the call strike price minus the price of the stock at trade initia-
tion. In this example, the maximum loss is limited to $500: [(2 × 2.50) + (50
– 50)] × 100 = $500. The reward is unlimited above the upside and below
the downside breakevens. The downside breakeven is calculated by sub-
tracting the net debit of the options from the stock price at trade initia-
tion. In this example, the downside breakeven is 45: (50 – 5 = 45). The
upside breakeven is calculated by adding net debit of the options to two
times the strike price minus the initial stock price. In this example, the up-
side breakeven is 55: [(2 × 50) – 50] + 5 = 55. So, the trade theoretically
will make a profit if the underlying rises above the upside breakeven (55)
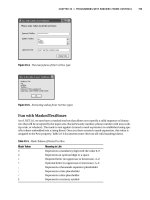
or falls below the downside breakeven (45). The risk profile of this trade
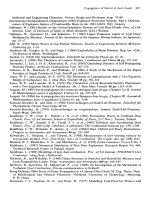
is shown in Figure 8.14. As you can see, this risk graph is identical in for-
mat to the put synthetic straddle. Both offer a visual look at the strategy’s
unlimited reward beyond the upside and downside breakevens.
Note: Although Figure 8.14 is identical to the risk profile for the exam-
ple of the long synthetic straddle using puts (Figure 8.12), this is due to
the similarity of the option premium values as well as the cost of the un-
derlying asset.
Straddles, Strangles, and Synthetics 221
Long Synthetic Straddle with Puts Case Study
Market Opportunity: Look for a market with low volatility where you
anticipate a volatility increase resulting in stock price movement in either
direction beyond the breakevens.
Long Stock and Long Puts
Strategy: Buy 100 shares of Semiconductor HOLDRS for $26.50 and sell 2
SMH January 25 puts @ $3.20. Entry debit equals $3,290.
Maximum Risk: [Net debit of options + (price of underlying stock at ini-
tiation – option strike price)] × number of shares. In this case, the max risk
is $790: [$6.40 + ($26.50 – 25)] × 100.
Maximum Profit: Unlimited to the upside and limited to the downside (as
the underlying can only fall to zero). In this example, $810.
Upside Breakeven: Price of underlying at trade initiation + net debit of
options. In this case, the UB is 32.90: (26.50 + 6.40).
Downside Breakeven: [(2 × option strike price ) – price of underlying at
trade initiation] – net debit of options. In this case, the DB is 17.10: [(2 ×
25) – 26.50] – 6.40.
ccc_fontanills_ch8_187-233.qxd 12/17/04 4:32 PM Page 221
Exiting the Position
Let’s investigate exit strategies for the long synthetic straddle:
• XYZ falls below the downside breakeven (45): If the stock’s
price falls below the downside breakeven, you can purchase the
shorted stock and let the calls expire worthless.
• XYZ falls within the downside (45) and upside (55) break-
evens: This is the range of risk and will cause you to consider closing
out the entire position at a loss or purchasing back the shorted stock
and possibly holding the call options. The maximum risk for the entire
position is the net cost of $500.
• XYZ rises above the upside breakeven (55): If the stock’s price
rises above the upside breakeven, you will be making money on the
call options faster than you are losing on the shorted stock. You can
close out the shorted stock and one call option and hold the addi-
tional option for additional revenue.
222
THE OPTIONS COURSE
FIGURE 8.14 Long Synthetic Straddle (Using Long Calls) Risk Graph
ccc_fontanills_ch8_187-233.qxd 12/17/04 4:32 PM Page 222
Long Synthetic Straddle with Calls Case Study
In this example, we want to trade the oil service in anticipation of an ex-
plosive move higher or lower, but we are not sure about direction. This
time, the underlying asset is the Oil Service HOLDRS (OIH), which is an
exchange-traded fund that holds a basket of oil drilling companies. In
April 2003, with the OIH trading for $56 a share, we initiate a synthetic
straddle by purchasing two October 2003 55 calls for $5.70 and selling
short 100 OIH shares.
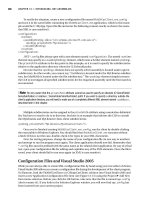
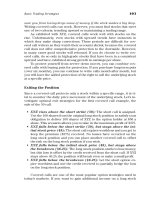
The risk graph of the OIH synthetic straddle appears in Figure 8.15. The
trade is established for a credit equal to the difference between the short
sale price minus the premium, or $4,460: (56 – 11.40) × 100. Success de-
pends on the OIH making a move dramatically higher or lower. The upside
breakeven is $65.40, or two times the strike price, minus the stock price,
plus the options premium. The downside breakeven is simply the price paid
for OIH minus the options premium, or $44.60. The maximum possible loss
is $1,040, but will be incurred only if the trade is held until expiration.
Just as in the other example of a long synthetic straddle using puts,
the strategist will not want to hold this trade until expiration. Instead, we
will exit the trade before the last 30 days, or during that period of time
when time decay is at its greatest. So, let’s assume we exit the trade 45
days before the October calls expire. In this case, on August 30, 2003, the
OIH was trading for $60 a share and the two calls were each quoted for $6
Straddles, Strangles, and Synthetics 223
Long Synthetic Straddle with Calls
Market Opportunity: Look for a market with low volatility where you
anticipate a volatility increase resulting in stock price movement in either
direction beyond the breakevens.
Short Stock and Long Calls
Strategy: Sell 100 shares of underlying stock and buy 2 long ATM calls.
Maximum Risk: [Net debit of options + (option strike price – price of un-
derlying at initiation)] × number of shares.
Maximum Profit: Unlimited to the upside and limited to the downside (as
the underlying can only fall to zero) beyond the breakevens.
Upside Breakeven: [(2 × option strike price) – price of underlying stock
at initiation] + net debit of options.
Downside Breakeven: Price of underlying stock at initiation – net debit
of options.
Margin: Required on the short stock.
ccc_fontanills_ch8_187-233.qxd 12/17/04 4:32 PM Page 223
a contract. So, the stock position resulted in a $4 per share loss, or $400,
and the options moved only modestly higher. The strategist could book a
$60 profit by closing out the long calls.
So, time decay hurt this position. In the end, the trade lost $360. It
needed a larger move in the underlying asset and perhaps more time
to work in the strategist’s favor. Rather than closing the position en-
tirely, the strategist could roll the position forward using longer-term
options.
224
THE OPTIONS COURSE
Profit
–1,000 0 1,000 2,000
30 40 50 60 70 80
Today: 172 days left Close= 55.99
115 days left
58 days left
Expiry: 0 days left
FIGURE 8.15 OIH Synthetic Straddle with Two Calls (Source: Optionetics
Platinum © 2004)
ccc_fontanills_ch8_187-233.qxd 12/17/04 4:32 PM Page 224
STRATEGY ROAD MAPS
Long Straddle Road Map
In order to place a long straddle, the following 14 guidelines should be
observed:
1. Look for a market with low volatility about to experience a sharp in-
crease in volatility that moves the stock price in either direction be-
yond one of the breakevens. The best long straddle opportunities are
in markets that are experiencing price consolidation as they are often
followed by a breakout. To find these consolidating markets, look
through your charts for familiar ascending, descending, or symmetric
triangles. As the stock price approaches the apex (point) of these tri-
angles, they build up energy, much like a coiled spring. At some point
this energy needs to be released and results in the price moving
quickly. You don’t care in which direction because you are straddling!
2. Check to see if this stock has options available.
3. Review options premiums per expiration dates and strike prices.
4. Investigate implied volatility values to see if the options are overpriced
or undervalued. Look for cheap options at the low end of their implied
volatility range, priced at less than the volatility of the underlying stock.
Straddles, Strangles, and Synthetics 225
Long Synthetic Straddle with Calls Case Study
Market Opportunity: Look for a market with low volatility where you
anticipate a volatility increase resulting in stock price movement in either
direction beyond the breakevens.
Short Stock and Long Calls
Strategy: Sell 100 shares of OIH for $56 and buy 2 long October 2003 55
calls for $5.70 a contract.
Maximum Risk: [Net debit of options + (option strike price – price of un-
derlying at trade initiation)] × 100. In this case, the max risk is $1,040:
[$11.40 + (55 – $56)] × 100.
Maximum Profit: Unlimited to the upside and limited to the downside
(as the underlying can only fall to zero) beyond the breakevens. In this
example, $60.
Upside Breakeven: [(2 × option strike price) – price of underlying at initia-
tion] + net debit of the options. In this case, 65.40: (2 × 55) – 56 + 11.40.
Downside Breakeven: Price of the underlying at trade initiation – net
debit of options. In this case, 44.60: (56 – 11.40).
ccc_fontanills_ch8_187-233.qxd 12/17/04 4:32 PM Page 225
5. Explore past price trends and liquidity by reviewing price and volume
charts over the past year.
6. A long straddle is composed of the simultaneous purchase of an ATM
call and an ATM put with the same expiration month.
7. Place straddles with at least 60 days until expiration. You can also use
LEAPS except the premiums are often very high and would be prof-
itable only with a very large movement in the underlying stock.
8. Determine which spread to place by calculating:
• Limited Risk: The most that can be lost on the trade is the double
premiums paid.
• Unlimited Reward: Unlimited to the upside and limited to the
downside (the underlying can only fall to zero).
• Upside Breakeven: Calculated by adding the call strike price to
the net debit paid.
• Downside Breakeven: Calculated by subtracting the net debit
from the put strike price.
9. Create a risk profile of the most promising option combination and
graphically determine the trade’s feasibility. A long straddle will have
a V-shaped risk profile showing unlimited reward above and limited
profit to the downside.
10. Write down the trade in your trader’s journal before placing the trade
with your broker to minimize mistakes made in placing the order and
to keep a record of the trade.
11. Make an exit plan before you place the trade. For example, exit the
trade when you have a 50 percent profit at least 30 days prior to expi-
ration on the options. If you have a winner, you do not want to see it
become a loser. In this case, exit with a reasonable 50 percent gain. If
not, then you should exit before the major amount of time decay oc-
curs, which is during the option’s last 30 days. If you have a multiple
contract position, you can also adjust the position back to a delta neu-
tral to increase profit potential.
12. Contact your broker to buy and sell the chosen options. Place the
trade as a limit order so that you limit the net debit of the trade.
13. Watch the market closely as it fluctuates. The profit on this strategy is
unlimited—a loss occurs if the underlying stock closes between the
breakeven points.
14. Choose an exit strategy based on the price movement of the underly-
ing and fluctuations in the implied volatility of the options.
226
THE OPTIONS COURSE
ccc_fontanills_ch8_187-233.qxd 12/17/04 4:32 PM Page 226
• The underlying shares fall below the downside breakeven:
You can close the put position for a profit. You can hold the worth-
less call for a possible stock reversal.
• The underlying shares fall within the downside and upside
breakevens: This is the range of risk and will cause you to close
out the position at a loss. The maximum risk is equal to the double
premiums paid.
• The underlying shares rise above the upside breakeven: You
are in your profit zone again and can close the call position for a
profit. You can hold the worthless put for a possible stock reversal.
Long Strangle Road Map
In order to place a long strangle, the following 14 guidelines should be
observed:
1. Look for a relatively stagnant market where you expect an explosion
of volatility that moves the stock price in either direction beyond one
of the breakevens. The best long strangle opportunities are in markets
that are experiencing price consolidation because consolidating mar-
kets are often followed by breakouts.
2. Check to see if this stock has options available.
3. Review options premiums per expiration dates and strike prices.
4. Investigate implied volatility values to see if the options are over-
priced or undervalued. Look for cheap options at the low end of their
implied volatility range, priced at less than the volatility of the under-
lying stock.
5. Explore past price trends and liquidity by reviewing price and volume
charts over the past year.
6. A long strangle is composed of the simultaneous purchase of an OTM
call and an OTM put with the same expiration month.
7. Look at options with at least 60 days until expiration to give the trade
enough time to move into the money.
8. Determine which spread to place by calculating:
• Limited Risk: The most that can be lost on the trade is the double
premiums paid for the options.
• Unlimited Reward: Unlimited to the upside and limited to the
downside (as the underlying can only fall to zero).
• Upside Breakeven: Calculated by adding the call strike price to
the net debit paid.
Straddles, Strangles, and Synthetics 227
ccc_fontanills_ch8_187-233.qxd 12/17/04 4:32 PM Page 227
• Downside Breakeven: Calculated by subtracting the net debit
from the put strike price.
9. Create a risk profile of the most promising option combination and
graphically determine the trade’s feasibility. A long strangle will have
a U-shaped risk profile showing unlimited reward above the upside
breakeven and limited profit below the downside breakeven.
10. Write down the trade in your trader’s journal before placing the trade
with your broker to minimize mistakes made in placing the order and
to keep a record of the trade.
11. Make an exit plan before you place the trade. For example, exit the
trade when you have a 50 percent profit or at least 30 days prior to ex-
piration on the options. Exit with a reasonable 50 percent gain. If not,
then you should exit before the major amount of time decay occurs,
which occurs during the option’s last 30 days.
12. Contact your broker to buy and sell the chosen options. Place the
trade as a limit order so that you limit the net debit of the trade.
13. Watch the market closely as it fluctuates. The profit on this strategy is
unlimited—a loss occurs if the underlying stock closes at or below the
breakeven points. You can also adjust the position back to a delta neu-
tral to increase profit potential if you have a multiple contract position.
14. Choose an exit strategy based on the price movement of the underly-
ing stock and fluctuations in the implied volatility of the options:
• The underlying shares fall below the downside breakeven:
You can close the put position for a profit. You can hold the worth-
less call for a possible stock reversal.
• The underlying shares fall within the upside and downside
breakevens: This is the range of risk and will cause you to close
out the position at a loss. The maximum risk is limited to the premi-
ums paid.
• The underlying shares rise above the upside breakeven: You
are in your profit zone again and can close the call position for a
profit. You can hold the worthless put for a possible stock reversal.
Long Synthetic Straddle Road Map
In order to place a long synthetic straddle with puts or calls, the following
14 guidelines should be observed:
1. Look for a market with low volatility about to experience a sharp
increase in volatility that moves the stock price in either direction
228
THE OPTIONS COURSE
ccc_fontanills_ch8_187-233.qxd 12/17/04 4:32 PM Page 228
beyond one of the breakevens. The best long synthetic straddle op-
portunities are in markets that are experiencing price consolidation
as they are often followed by a breakout.
2. Check to see if this stock has options available.
3. Review options premiums per expiration dates and strike prices.
4. Investigate implied volatility values to see if the options are over-
priced or undervalued. Look for cheap options. Those are options that
are at the low end of their implied volatility range, priced at less than
the volatility of the underlying stock.
5. Explore past price trends and liquidity by reviewing price and volume
charts over the past year.
6. A long synthetic straddle can be composed by going long two ATM put
options per long 100 shares or by purchasing two ATM call options
against 100 short shares. Either technique creates a delta neutral trade
that can be adjusted to bring in additional profit when the market
moves up or down.
7. Place synthetic straddles using options with at least 60 days until ex-
piration. You can also use LEAPS except the premiums are often very
high and may be profitable only with a very large movement in the un-
derlying stock.
8. Determine which spread to place by calculating:
• Limited Risk: For a long synthetic straddle using puts, add the
net debit of the options to the stock price at initiation minus the
option strike price and then multiply this number by the number
of shares. For a long synthetic straddle using calls, add the net
debit of the options to the option strike price minus the price of
the underlying at trade initiation, and then multiply this number
by the number of shares. This is assumed only if you hold the po-
sition to expiration and the underlying stock closes at the option
strike price.
• Unlimited Reward: Unlimited to the upside and limited to the
downside (as the underlying can only fall to zero).
• Upside Breakeven: Calculated by adding the price of the underly-
ing stock at initiation to the net debit of the options.
• Downside Breakeven: Calculated by subtracting the stock pur-
chase price plus the double premium paid for the options from
twice the option strike price.
9. Create a risk profile of the most promising option combination and
graphically determine the trade’s feasibility. A long synthetic straddle
Straddles, Strangles, and Synthetics 229
ccc_fontanills_ch8_187-233.qxd 12/17/04 4:32 PM Page 229
will have a U-shaped risk profile, showing unlimited reward and lim-
ited risk between the breakevens.
10. Write down the trade in your trader’s journal before placing the trade
with your broker to minimize mistakes made in placing the order and
to keep a record of the trade.
11. Make an exit plan before you place the trade. For example, exit the
trade when you have a 50 percent profit at least 30 days prior to expi-
ration on the options. If not, then you should exit before the major
amount of time decay occurs, which is during the option’s last 30 days.
You can also adjust the position back to a delta neutral to increase
profit potential depending on how many contracts you are trading.
12. Contact your broker to buy and sell the chosen options. Place the
trade as a limit order so that you limit the net debit of the trade.
13. Watch the market closely as it fluctuates. The profit on this strategy is
unlimited—a loss occurs if the underlying stock closes between the
breakeven points.
14. Choose an exit strategy based on the price movement of the underly-
ing shares and fluctuations in the implied volatility of the options.
Exiting the long synthetic straddle with puts:
• The underlying shares fall below the downside breakeven:
If the stock’s price falls below the downside breakeven, you can ex-
ercise one of the puts to mitigate the loss on the stock and sell the
other put for a profit.
• The underlying shares fall within the downside and upside
breakevens: This is the range of risk and will cause you to con-
sider closing out the entire position at a loss or selling just the put
options. The maximum risk is the cost of the double premium paid
out for the puts.
• The underlying shares rise above the upside breakeven:
If the stock’s price rises above the upside breakeven, you will be
making money on the stock and losing money on the put options.
You can sell them at a loss or hold onto them in case of a reversal.
Exiting the long synthetic straddle with calls:
• The underlying shares fall below the downside breakeven:
If the stock’s price falls below the downside breakeven, you can
purchase the shorted stock and let the calls expire worthless.
• The underlying shares fall within the downside and upside
breakevens: This is the range of risk and will cause you to con-
230
THE OPTIONS COURSE
ccc_fontanills_ch8_187-233.qxd 12/17/04 4:32 PM Page 230
sider closing out the entire position at a loss or purchasing back the
shorted stock and possibly holding the call options.
• The underlying shares rise above the upside breakeven:
If the stock’s price rises above the upside breakeven, you will
be making money on the call options faster than you are losing
on the shorted stock. You can close out the shorted stock
and one call option and hold the additional option for additional
revenue.
CONCLUSION
Every trader, no matter how new or experienced, has wished they
had bought the opposite side of a trade at one time or another. Maybe
we felt strongly about earnings for a company and found out that
though the news was good, the stock fell on the actual report. There are
several different technical patterns that signal a strong move is likely,
but the direction is hard to predict. Fortunately, there are a number
of option strategies—straddles, strangles, and synthetic straddles—
that take advantage of large moves without the need to predict market
direction.
A straddle is a delta neutral strategy that is made up of buying an ATM
call and an ATM put. A strangle is similar but uses OTM options instead.
The obvious question new traders have is how do these types of trades
make money? Any price movement means either a call value gain and a put
loss, or a put gain and a call loss. However, the delta will increase more on
the side of the trade that gains than it will decrease on the side that is los-
ing value.
The other way we profit in a straddle is if implied volatility increases
for the options. Since we are buying both sides of the trade, a rise in IV
will benefit both the put and the call. However, this can also work in re-
verse, so we need to be confident that IV will either rise or at least stay
constant. IV increases on pending news events, like earnings or FDA deci-
sions. However, once the news has been announced, IV usually implodes
and can lead to a volatility crush.
A straddle is a limited risk/unlimited reward strategy, but traders
should still set profit goals. Many straddle traders look to make 50 percent
profit on a straddle, but might use adjustments to lower risk, while hold-
ing on for higher profits. For example, once one side of a straddle pays for
the whole trade, we can sell this side and hold on for a gain in the other
side of the straddle. Of course, this would be contingent on the belief the
stock was about to reverse course.
Straddles, Strangles, and Synthetics 231
ccc_fontanills_ch8_187-233.qxd 12/17/04 4:32 PM Page 231
The strategist purchases straddles and strangles when there are ex-
pectations that the stock will make a significant move higher or lower, but
the direction is uncertain. A sideways-moving stock will result in losses to
the straddle or strangle holder. However, although a stock needs to make
a rather large move to make a profit on a straddle (or a strangle), we also
can get out without much of a loss if the stock doesn’t move within a given
time frame. However, this is only the case if we purchase options with
enough time left until expiration. Time decay is the biggest enemy we
have with a straddle, and time decay picks up speed the last 30 days of an
option’s life.
A long synthetic straddle consists of long stock and long puts or short
stock and long calls to create a delta neutral trade. Most of the time, a
long synthetic straddle utilizes at-the-money (ATM) options. Remember,
ATM options normally have a delta near 50, or in this case –50. However,
the maximum risk is not the entire debit, just the cost of the options. Risk
occurs if the stock does not move by expiration and the time value of the
long options erodes away.
The benefit to trading a long synthetic straddle is the adjustments that
can be made. As the stock moves up and down, we can adjust the trade
back to delta neutral to lock in profits. Many traders make adjustments
when the total delta of the trade is up or down 100. We can make these ad-
justments by selling or buying stock or by selling or buying the options.
This strategy is a great long-term tool, but make sure you understand the
risks before entering this type of trade.
Used appropriately, the nondirectional strategies reviewed in this
chapter can be nice profit producers, without a lot of risk. However, it is
important to understand the basic rules and to know the associated risks.
As with any strategy, a risk graph should always be created before enter-
ing the trade.
When you put on a long synthetic straddle, you are placing a hedge
trade. All you are paying for is the cost of the options. If your broker
requires you to have margin on the stock side, then try to find some-
one who will give you a cross-margin account. There are companies
out there that offer cross margining, although it is a relatively new con-
cept to the public. Putting on a synthetic straddle is not new; just the
concept of looking at it as a low-risk trade from the brokerage firm side
is new.
These trades are referred to as synthetic primarily because the two
ATM options behave like the underlying stock (two ATM options = +100
or –100 deltas). They create a synthetic instrument that moves as
the underlying asset changes. When you initiate the position, you are
completely offsetting the other side to create a perfect delta neutral
232 THE OPTIONS COURSE
ccc_fontanills_ch8_187-233.qxd 12/17/04 4:32 PM Page 232
trade. As the market moves, you will gain more on the winning side of
the trade or in adjustment profits than you will relinquish on the
losing portions of the trade. It works because you are combining a fixed
delta with a variable delta. Adjustments can be made when the market
makes a move. If the market moves so that the overall trade is +100
deltas, then you can sell short 100 shares of stock. If the market moves
and the overall position delta becomes –100, you can buy another fu-
tures contract or 100 shares of stock. Either way, the trade returns to
delta neutral.
As a beginner, you should play it safe and place trades that offer lim-
ited risk. Although it may be tempting to go short options since a sale
places money directly in your trading account over time, I do not recom-
mend selling options until you are truly well-versed in delta neutral trad-
ing. Remember that when you sell options you do get a credit, but you
only earn this credit as the options lose value over time.
Straddles, Strangles, and Synthetics 233
ccc_fontanills_ch8_187-233.qxd 12/17/04 4:32 PM Page 233
CHAPTER 9
Advanced
Delta Neutral
Strategies
U
nderstanding the mechanics of a variety of delta neutral strategies is
vital to becoming a profitable nondirectional trader. Instead of being
overwhelmed by the complex nature of market dynamics, you can
implement a delta neutral strategy that takes advantage of market condi-
tions. Determining which strategy best fits the situation can easily be de-
duced through the use of risk profiles and relatively easy mathematical
calculations. Delta neutral trading is all about empowering traders to max-
imize their returns and minimize their losses. Although professional
traders have used delta neutral strategies on the major exchanges for
years, off-floor traders are rarely aware of these strategies.
We have already explored the basic delta neutral trading techniques.
It’s time to turn the spotlight on some advanced strategies: ratio spreads
and ratio backspreads. Ratio spreads are interesting strategies that pro-
vide a wide profit zone; however, they also have unlimited risk. Ratio back-
spreads, in contrast, offer limited risk with unlimited reward potential.
RATIO CALL SPREAD
A ratio spread is a strategy in which an uneven number of contracts with
the same underlying instrument are bought and sold. Unlike straddles and
strangles, which use a 1-to-1 ratio of the same kind of options, ratio
spreads offset an uneven number of different types of options. A ratio call
spread is useful when a trader sees a slight rise in a market followed by a
sell-off. If this trade is done at a credit, the chance for success increases.
234
ccc_fontanills_ch9_234-264.qxd 12/17/04 4:15 PM Page 234
Although a ratio spread simply involves the buying and selling of an
uneven number of contracts, there are a variety of complex ways to imple-
ment this strategy. For example, you can buy one OTM call option and sell
two call options that are even further out-of-the-money. You can also use a
ratio other than 1-to-2. For instance, you might buy two ATM options and
sell three OTM options.
Many traders are willing to take the risk involved in shorting OTM op-
tions because they believe that the probability of the market moving that
much is slim. Meanwhile, they are taking in a lot of premium. However, a
volatile market can easily move enough to lose money on the uncovered
short option. For that reason, we do not recommend this strategy, but we
present it here in order to lead up to one of our favorite strategies—the
ratio backspread.
Ratio Call Mechanics
For example, during the month of February, let’s say you decide to create
a ratio call spread by purchasing one July ATM 50 call at $4.50 and selling
two July XYZ 55 calls at $2.50. This trade will not cost you any money to
place because you’re spending $450 (4.50 × 100) to buy the 50 call and re-
ceiving $500 [(2 × 2.50) × 100] in credit for selling the 55 calls. Thus, you
are receiving a credit of $50 to place the trade. This trade has limited
profit and unlimited risk. One of the short July OTM 55 calls is covered by
the long 50 call. If the market goes to 60, you would make 10 points on the
long call, lose 5 on the first call, to lock in a net profit of 5 points. How-
ever, the second 55 call is uncovered and even though it was an OTM op-
tion when the trade was initiated, there is some margin and risk on it. If
the market rises to 60, the second 55 call loses 5 points, reducing the net
profit to 0 points: (10 – 5 – 5 = 0).
The maximum profit of a ratio call spread is calculated using the
following equation:
Number of long contracts × (difference in strike prices × 100)
+ net credit (or – net debit)
In this trade, the maximum profit is limited to $550: (55 – 50) × 100 +
$50 = $550. However, the risk is unlimited to the upside above the
breakeven point. The upside breakeven is calculated by using the follow-
ing equation:
Lower call strike price + (difference in strikes × number of short contracts)
÷ (number of short calls – number of long calls)
+ net credit (or – net debit)
Advanced Delta Neutral Strategies 235
ccc_fontanills_ch9_234-264.qxd 12/17/04 4:15 PM Page 235
In this case, the upside breakeven is 60.50: 50 + [(55 – 50) × 2] ÷ (2 – 1)
+ .50 = 60.50. There is no risk to the downside because the trade was en-
tered as a credit. This trade is best entered during times of high volatility
with expectation of decreasing volatility. The risk graph for this example
is shown in Figure 9.1.
236
THE OPTIONS COURSE
FIGURE 9.1 Ratio Call Spread Risk Profile
Ratio Call Spread
Strategy: Buy a lower strike call and sell a greater number of higher
strike calls.
Market Opportunity: Look for a volatile market where you expect a slight
decline or a small rise not to exceed the strike price of the short options.
Maximum Risk: Unlimited to the upside above the breakeven.
Maximum Profit: Limited. [Number of long contracts × (difference in
strikes × 100) + net credit (or – net debit)].
Upside Breakeven: Lower call strike price + [(difference in strikes × num-
ber of short contracts) ÷ (number of short calls – number of long calls)] +
net credit (or – net debit).
Margin: Required. Extensive due to the naked call.
ccc_fontanills_ch9_234-264.qxd 12/17/04 4:15 PM Page 236
Ratio Call Spread Case Study
Eastman Kodak (EK) has been trading in a range and you expect the stock
to either stay in that range or make a modest move higher. The stock is
trading for $29.50 per share during the month of June. In order to profit
from the stock’s sideways trading, let’s create a ratio call spread by selling
two October 35 calls for $1.75 each and buying one October 30 call for $3.
You earn a credit of 50 cents or $50 when establishing this trade.
Ideally, after establishing the trade, the stock will move only gradually
higher. If it rises above $33, but below $35, the short options will expire
worthless and you can book a profit on the long EK October 30 call. The
maximum gain occurs at exactly $35 a share at expiration. At that point,
both EK October 35 calls expire worthless and the long call is worth $5. In
that case, the trader keeps the $350 for selling the two short calls and
earns another $200 in profits from the long call. The total maximum gain is
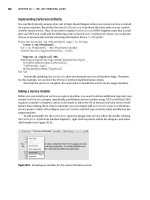
therefore $550. The risk profile for this trade is shown in Figure 9.2.
If EK falls sharply, the trader can do nothing but let the calls expire
worthless. In this example, that’s exactly what happened: The trade gener-
ated a $50 return. The upside breakeven is equal to 40.50: [30 + (5 × 2)]
+.50 = 40.50. Losses begin to develop as the stock moves above the
breakeven and are unlimited due to the naked short call. A move to $50 a
share, for instance, would result in a $950 loss. Therefore, the strategist is
taking a significant risk in order to earn a maximum of $550.
Advanced Delta Neutral Strategies 237
Ratio Call Spread Case Study
Strategy: Long 1 EK Oct 30 call @ $3.00 and Short 2 Oct 35 calls @ $1.75
for a credit of $50.
Market Opportunity: EK is expected to move modestly higher, but not
explode to the upside.
Maximum Risk: Unlimited to the upside above the breakeven of $40.50
a share.
Maximum Profit: Number of long contracts × (difference in strikes ×
100) + net credit (or – net debit). In this case, the max profit is $550: 1 ×
(5 × 100) + 50.
Upside Breakeven: Lower strike + [(difference in strikes × number of
short options) ÷ (number of short calls – number of long calls) + net credit
(or – net debit). In this case, the UB is 40.50: 30 + [(35 – 30) × 2 ÷ (2 – 1)]
+.50.
Margin: Yes, due to sale of naked call.
ccc_fontanills_ch9_234-264.qxd 12/17/04 4:15 PM Page 237
RATIO PUT SPREADS
A ratio put spread involves buying a higher strike put option and selling a
greater number of lower strike OTM put options and should be imple-
mented in a bullish market. The maximum profit of a ratio put spread is
calculated by multiplying the difference in strike prices by 100 and then
adding the net credit received. The maximum risk is limited to the stock
going to zero and equals the lower strike price minus the difference be-
tween the two strike prices plus the net credit times 100. The downside
breakeven is calculated by dividing the difference in strike prices times
the number of short contracts by the number of short contracts minus
238
THE OPTIONS COURSE
Profit
–800 –600 –400 –200 0 200 400 600 800
20 30 40
Today: 235 days left Close= 29.34
157 days left
79 days left
Expiry: 0 days left
FIGURE 9.2 EK Ratio Call Spread (Source: Optionetics Platinum © 2004)
ccc_fontanills_ch9_234-264.qxd 12/17/04 4:15 PM Page 238
the number of long contracts and subtracting that number from the
higher put strike price. Then, subtract the net credit received or add the
net debit paid.
A ratio put spread can be implemented when a slight fall in the market
is anticipated followed by a sharp rise. This strategy works well in the
stock market, as stocks generally tend to move up in price. However, it is
important to place this trade on only high-quality stocks. If the company
has reported lower than expected earnings or bad news is released, exit
the position. A ratio put spread also works well in many futures markets,
especially during seasonal periods when prices tend to go up (such as
heating oil in the winter months).
The main risk in ratio spreads comes from the uncovered short call
or put. These options have unlimited risk. Watch the market closely and
exit or adjust the trade if the market moves to the strike price of the
short options.
Ratio Put Spread Mechanics
Let’s create an example with XYZ trading at $50 a share in February that
consists of going long one July XYZ 50 put at $4.50 and two short July
XYZ 45 puts at $2.50 each. This trade creates a net credit of .50 or $50:
[(2 × 2.50) – 4.50] × 100 = $50. The maximum profit of a ratio put spread
is calculated by using the following formula:
(Difference in strike prices × 100) + net credit (or – net debit)
In this trade, the maximum profit is limited to $550: (50 – 45) × 100 +
$50 = $550. The maximum risk is limited because the stock can only fall to
zero and is calculated using the following formula:
Lower strike price – (difference in strikes – net credit) × 100
In this example, the maximum risk is $3,950: 45 – [(50 – 45) – .50] ×
100 = $3,950. The downside breakeven is calculated by using the follow-
ing formula:
Higher strike price – [(difference in strikes × number of short contracts)
÷ (number of short contracts – number of long
contracts)] – net credit (or + net debit)
In this example the downside breakeven is 39.50: 50 – [(50 – 45) × 2]
÷ (2 – 1) – .50 = 39.50. The risk graph for this trade is shown in
Figure 9.3.
Advanced Delta Neutral Strategies 239
ccc_fontanills_ch9_234-264.qxd 12/17/04 4:15 PM Page 239
Ratio Put Spread Case Study
General Electric (GE) has been performing well and the stock is expected
to take a pause or perhaps trade lower. With shares near $23.40 in Febru-
ary 2003, let’s short sell two January GE 20 puts at $2 and go long 1 Janu-
ary 25 put at $4. The sale of the puts offsets the cost of the long put and
the trade is executed at even (without a debit or credit).
240
THE OPTIONS COURSE
FIGURE 9.3 Ratio Put Spread Risk Profile
Ratio Put Spread
Strategy: Buy a higher strike put and sell a greater number of lower strike
puts.
Market Opportunity: Look for a market where you expect a rise or
slight fall not to exceed the strike price of the short options.
Maximum Risk: Limited to the downside below the breakeven (as the
stock can only fall to zero). Lower strike price – (difference in strikes – net
credit) × 100.
Maximum Profit: Limited. (Difference in strikes × 100) + net credit (or –
net debit).
Downside Breakeven: Higher strike price – [(difference in strikes × num-
ber of short contracts) ÷ (number of short contracts – number of long con-
tracts)] – net credit (or + net debit).
Margin: Required. Extensive due to the naked put.
ccc_fontanills_ch9_234-264.qxd 12/17/04 4:15 PM Page 240
After establishing the trade, the strategist wants to see shares of Gen-
eral Electric edge lower. The maximum gain occurs at expiration if the
stock is trading for $20 a share. At that point, both GE January 20 puts ex-
pire worthless and the long put is worth $5 a contract, or $1 more than the
entry price. If so, the strategist earns $1 in profits with the long call and
keeps the $4 in premium for selling the short puts. The maximum gain is
therefore $500. The risk graph of this trade is shown in Figure 9.4.
If GE rises sharply, the strategist can do nothing but let the puts ex-
pire worthless. In that case, the loss is equal to the commissions paid for
the trade. On the other hand, if the stock falls sharply, the losses can be
substantial. The downside breakeven is equal to: higher strike price –
[(difference in strike prices × number of short contracts) ÷ (number of
Advanced Delta Neutral Strategies 241
Profit
–300 –200 –100 0 100 200 300 400 500
20 30
Today: 326 days left Close= 23.42
218 days left
109 days left
Expiry: 0 days left
FIGURE 9.4 GE Ratio Put Spread (Source: Optionetics Platinum © 2004)
ccc_fontanills_ch9_234-264.qxd 12/17/04 4:15 PM Page 241
short contracts – number of long contracts)] – net credit (or + net debit),
or $15: [25 – (5 × 2)] ÷ (2 – 1) – 0 = $15]. Losses begin to develop as the
stock moves below the breakeven and are limited to the stock falling to
zero. In this case, if the stock falls to zero, one short put will cover the
long put and result in a $5 profit. The other put will probably be assigned
for a $20 loss. The total loss would therefore be $1,500. Therefore, the
strategist is risking $1,500 to earn $500 from this trade.
EXIT STRATEGIES FOR RATIO SPREADS
Whether trading call or put ratio spreads, it is important to remember that
these strategies involve substantial risk for limited reward. The strategist
wants to be careful because these types of spreads involve more short
than long options and therefore involve naked options. In a call ratio
spread, the risk is unlimited to the upside. If the underlying stock moves
beyond the short strike price before expiration, the strategist might want
to consider closing the position by buying back the short calls and selling
the long call. If the stock drops, do nothing, let the options expire, and
keep the net credit received for establishing the trade.
In the case of the put ratio spread, the opposite holds true. In that
case, a sharp move lower in the stock can result in substantial losses. If
the stock falls below the short strike price before expiration, the strategist
might consider closing the position by purchasing back the short puts and
selling the long put. If the stock moves higher, do nothing, let the options
expire, and keep the credit.
242
THE OPTIONS COURSE
Ratio Put Spread Case Study
Strategy: Long 1 GE 25 Put @ $4.00 and Short 2 GE 20 Puts @ $2.00. Net
debit/credit equals zero.
Market Opportunity: Look for GE to trade modestly lower or sideways.
Maximum Risk: Limited to the downside below the breakeven (as the
stock can only fall to zero). Lower strike price – (difference in strikes – net
credit) × 100. In this case, the max risk is $1,500: [20 – (25 – 20) – 0] × 100.
Maximum Profit: Limited. (Difference in strikes + net credit) × 100. In
this case, the max profit is $500: {5 × [(25 – 20) + 0]} × 100.
Downside Breakeven: Higher strike – [(difference in strikes × number of
short puts) ÷ (number of short puts – number of long puts)] – net credit. In
this case, the DB is 15: 25 – [(5 × 2) ÷ 1] – 0.
Margin: Required. Extensive due to the naked put.
ccc_fontanills_ch9_234-264.qxd 12/17/04 4:15 PM Page 242
CALL RATIO BACKSPREADS
Ratio backspreads are one of my favorite strategies for volatile markets.
They are very powerful strategies that will enable you to limit your risk
and receive unlimited potential profits. These strategies do not have to be
monitored very closely as long as you buy and sell options with at least 90
days (the longer the better) until expiration. I like to call them “vacation
trades” because I can place a ratio backspread, go on vacation, and not
even worry about it. For some traders, ratio backspread opportunities are
hard to find. Perhaps they are looking in the wrong places. It is difficult to
find ratio backspread opportunities in highly volatile markets with expen-
sive stocks or futures. For example, you will rarely find them in the S&P
500 futures market. This index is simply too volatile and the options are
too expensive. Focus on medium-priced stocks (between $25 and $75) or
futures. These trades can be quite profitable, so be persistent. They’re out
there—just keep looking.
Additionally, when looking for the right market for a call ratio back-
spread, scan for markets exhibiting a reverse volatility skew. In these
markets, the lower strike options (the ones you want to sell) have
higher implied volatility and can be overpriced. The higher strike op-
tions (the ones you want to buy) enjoy lower implied volatility and are
often underpriced. By finding markets with a reverse volatility skew,
you can capture the implied volatility differential between the short and
long options.
A ratio backspread strategy involves buying one leg and selling an-
other in a disproportionate ratio that does not create a net debit. The fol-
lowing seven rules must be diligently observed to create an optimal ratio
backspread trade:
1. Choose markets where volatility is expected to increase in the direc-
tion of your trade.
2. Avoid markets with consistent low volatility. If you really want to
place a ratio backspread in a market that does not move, pay close at-
tention to rule 4.
3. Do not use ratios greater than .67—use ratios that are multiples of 1:2
or 2:3.
4. If you choose to trade a slow market, a .75 ratio or higher is accept-
able only by buying the lower strike and selling the higher. However,
there is more risk.
5. To create a call ratio backspread, sell the lower strike call and buy a
greater number of higher strike calls.
Advanced Delta Neutral Strategies 243
ccc_fontanills_ch9_234-264.qxd 12/17/04 4:15 PM Page 243
6. To create a put ratio backspread, sell the higher strike put and buy a
greater number of low strike puts.
7. Try to avoid debit trades. But if you do place a ratio backspread with a
debit, you must be able to lose that amount.
Call Ratio Backspread Mechanics
As previously stated, a call ratio backspread involves selling the lower
strike call and buying a greater number of higher strike calls. For exam-
ple, let’s pick a fictitious market (it doesn’t matter which market as long
as it is volatile) with strikes starting at 40, 45, 50, 55, and 60. The ATM
calls are at 50, which means that the current price of the underlying mar-
ket equals $50 also. Now, according to rule 5, the first part of a call ratio
backspread is to sell the lower strike call. Which is the lowest strike call
here? The 40 is the lowest strike call. Now, the other part of the rule tells
me to buy a greater number of higher strike calls. Let’s buy an option to
buy this market at $60 because we think the market is going to reach $65.
Am I going to pay less for this call than for the 40, or more? I’m going to
pay less because now I’m speculating that the market mood is bullish.
Speculating on market direction is one of the main reasons why many
people lose money when they trade options. However, I’m going to go
ahead and speculate that the market is going to go to 65, even though it’s
only at 50 right now. Furthermore, I’m going to pay less for a 60 option
than a 55 strike. As the strike price goes up, the premiums of the ITM op-
tions also go up, as they are more and more valuable. If our market is cur-
rently trading at 50 but it’s starting to rise, the price of the 60-strike
option will also rise.
Now let’s introduce the delta into this situation. The delta is the
probability an option has of closing in-the-money at expiration. If a 50-
strike option is at-the-money, which way can the market go? The market
can move in either direction, which means there is a 50 percent proba-
bility of it closing in-the-money. Obviously, a price that’s already in-the-
money has a higher probability of closing in-the-money than something
that’s out-of-the-money. Therefore, the delta for an ITM option is higher
than the delta for the ATM option or an OTM option. The higher the
probability an option has of closing in-the-money, the higher its pre-
mium. This relationship enables a trader to create trades that are virtu-
ally free of charge. Ratio backspreads take full advantage of this
relationship. It’s a relatively simple concept. As the underlying instru-
ment’s price changes, the option deltas change accordingly. For exam-
ple, our 40-strike option has a higher delta than one with a 60-strike, and
therefore a higher premium as well.
244
THE OPTIONS COURSE
ccc_fontanills_ch9_234-264.qxd 12/17/04 4:15 PM Page 244
Let’s set up a call ratio backspread using XYZ, which is currently trad-
ing at 50. To satisfy the rules, let’s sell a 40 call and buy more of the 60
calls in a ratio of 2-to-3 or less. This trade would receive a credit on the
short 40 call and a debit on the long 60 calls. However, we have limited the
risk of the short 40 call by offsetting it with one of the long 60 calls and
can still profit from the other long 60 call.
As previously stated, determining risk is the most important part of
setting up any trade. The risk of this trade can be calculated using the fol-
lowing option premiums:
Call Price
60 $ 60
55 $ 70
50 $ 80
45 $ 90
40 $100
If we sell one 40-strike call option and buy two of the 60-strike call op-
tions, we have a debit of $20: 100 – (2 × 60) = –$20. But if the prices rise,
we’ll make more money on the 60-strike calls than on the 40-strike call. If
the market falls, the out-of-pocket cost of placing the trade is the maxi-
mum risk. The most we can lose is $20 on the downside.
The trick to creating an optimal trade is to avoid risk by using a ratio
that makes the trade delta neutral. In this way, it is possible to place a trade
for free at no net debit. That’s right! You can create ratio backspreads that
don’t cost a penny (except for commissions) and still make healthy profits.
You can do this by offsetting the credit side with the debit side so that they
cancel each other out and you don’t have to spend any money out-of-pocket.
In this example, you can create a 2 × 3 ratio backspread at a $10 credit: [(2 ×
100) – (3 × 60)] = +$20. This is the best kind of trade to place (especially if
you’re 100 percent wrong about market direction), because you won’t lose
any money. In this case, as long as the market breaks down below the 40
strike, both options expire worthless. However, there is some risk between
the 40 and 60 strike prices because the trade could lose more than it profits.
To figure out the most effective ratio, you have to accurately calculate
the net credit of a trade. This can be accomplished by calculating the full
credit realized from the short options and dividing it by the debit of one
long option. You can then use up as much of the credit as you can to make
the most profitable ratio.
Credit = Number of short contracts × short option premium × 100
Debit = Number of long contracts × long option premium × 100
Advanced Delta Neutral Strategies 245
ccc_fontanills_ch9_234-264.qxd 12/17/04 4:15 PM Page 245