Peripheral Vascular Ultrasound - part 6 ppt
Bạn đang xem bản rút gọn của tài liệu. Xem và tải ngay bản đầy đủ của tài liệu tại đây (1.7 MB, 25 trang )
essential to have an emergency call system close at
hand. In the absence of a treadmill it is possible to
exercise the patient along the known length of a
corridor. Another alternative is to use commercially
available foot flexion devices to exercise the calf
muscles while the patient sits on the examination
table. This reduces cardiac stress. Exercise testing is
also a particularly useful screening test, as some
patients exhibiting symptoms of claudication may
have other disorders producing their symptoms, such
as spinal stenosis, sciatica or musculoskeletal prob-
lems. In these cases, the post-exercise pressures will
be normal. Unfortunately, there is a wide range
of exercise protocols used by vascular laboratories
(e.g., speed 2–4 km/hour, exercise duration 2–5 min
and treadmill incline 10–12%). This can make com-
parisons of results among units difficult. However,
individual patients’ performance can be measured
on sequential visits to monitor their treatment or
progress.
SYMPTOMS OF LOWER LIMB ARTERIAL
DISEASE
Intermittent claudication
Atherosclerosis is a major health problem in devel-
oped countries where lifestyle factors, such as diet
and smoking, can accelerate the progression of the
disease. It is estimated that intermittent claudication
affects approximately 4.5% of the population aged
between 55 to 74 years, and there is evidence that
persons with claudication have a significantly higher
mortality rate from cardiac disease than non-
claudicants (Fowkes et al 1991). Intermittent clau-
dication is caused by arterial narrowing in the
lower limb arteries, and symptoms may develop
over a number of months or years. Claudication is
typified by pain and cramping in the muscles of the
leg while walking, which usually forces the patient
to stop and rest in order to ease the symptoms.
The severity of pain experienced and the distance a
patient is able to walk can vary from day to day,
but, generally, walking briskly or on an incline will
produce rapid onset of symptoms. The location of
pain (i.e. calf, buttock or thigh) is often associated
with the distribution of disease. For instance, aortoil-
iac disease often produces thigh, buttock and even-
tually calf claudication whereas femoropopliteal
disease is associated with calf pain. There are some-
times physical signs of deteriorating blood flow in
the lower limb, such as hair loss from the calf and
an absence of nail growth. Claudication only
occurs during exercise because, at rest, the muscle
groups distal to a stenosis or occlusion remain ade-
quately perfused with blood. However, during
exercise the metabolic demand of the muscles
increases rapidly, and the stenosis or occlusion will
limit the amount of additional blood flow that can
reach the muscles, so causing claudication.
Many patients with intermittent claudication are
treated by conservative methods. This includes
reduction or elimination of risk factors associated
with atherosclerosis, such as smoking. Patients are
also advised to undertake a controlled exercise pro-
gram to build up the collateral circulation around
the diseased vessel, which may ease symptoms over
time. If necessary, serial ABPI measurements or
exercise tests can be performed to monitor the
patient’s progress. Interventional treatment is mainly
by angioplasty which involves the dilation of stenoses
or occlusions with percutaneous balloon catheters
(see Ch. 1). Arterial stents are sometimes used to
prevent re-stenosis, although in-stent stenosis is
known to occur in a proportion of cases due to the
development of intimal hyperplasia (see Fig. 9.21).
Sometimes the arterial lesion is so hard, the stent
will not fully expand, leaving a residual stenosis.
Duplex scanning can be used to detect and monitor
in-stent stenosis. Surgical bypass is usually avoided,
unless the patient is suffering from severe claudica-
tion, as there is a small but potential risk of compli-
cations occurring during or after surgery, which in
extreme cases could lead to amputation or even
death.
Chronic critical lower limb ischemia
Critical lower limb ischemia occurs when blood
flow beyond an arterial stenosis or occlusion is so
low that the patient experiences pain in the leg at
rest because the metabolic requirements of the distal
tissues cannot be maintained. This is frequently typi-
fied by severe rest pain at night, forcing the patient
to sleep in a chair or to hang the leg in a dependent
position over the side of the bed. This improves
blood flow due to increased hydrostatic pressure.
Ulceration and gangrene may also be present
PERIPHERAL VASCULAR ULTRASOUND
116
Chap-09.qxd 29~8~04 14:46 Page 116
(Fig. 9.5). The European Working Group (1992)
on critical limb ischemia (CLI) defined CLI as:
… persistently recurring ischaemic rest pain requir-
ing regular analgesia for more than two weeks,
with an ankle systolic pressure of р50 mmHg
and/or a toe systolic pressure of р30 mmHg; or
ulceration or gangrene of the foot or toes, with
ankle systolic pressure of р50 mmHg and/or a toe
systolic pressure of р30 mmHg.
This may be a strict definition of CLI, as
patients with ulceration are frequently seen in the
vascular laboratory with ankle pressures above
50 mmHg. The treatment of lower limb ischemia
includes angioplasty or arterial bypass grafting.
Unfortunately some patients are not suitable can-
didates for any form of limb salvage, and amputa-
tion is the inevitable outcome.
Acute ischemia
Acute ischemia, as the name suggests, is due to sud-
den arterial obstruction in the lower limb arteries.
The position of the obstruction can be variable.
There are two main causes of acute ischemia.
First, acute thrombosis of an existing arterial
lesion, a so-called acute-on-chronic occlusion, can
occur when the blood flow across a diseased seg-
ment of an artery is so slow that it spontaneously
thromboses. Long segments of an artery may
occlude in this situation. Acute ischemia is more
likely to occur if the collateral circulation around
the disease is poorly developed. Occasionally, patients
have predisposing coagulation disorders that lead
to spontaneous arterial thrombosis.
Second, an embolus may be released from other
areas of the body, such as the heart or from an
aneurysm, which then blocks an artery in the
extremity. An embolus frequently obstructs bifurca-
tions such as the common femoral bifurcation or
distal popliteal artery and tibioperoneal trunk.
Another example is obstruction of the aortic bifur-
cation by an embolus projecting down both CIA
origins, referred to as a saddle embolus. The body
has very little time to develop collateral circulation
around embolic occlusions, and the limb may be
very ischemic.
The symptoms of acute ischemia are of rapid
onset, and the patient classically presents with a
cold, painful, pulseless, paresthetic leg. In this situa-
tion, emergency intervention by surgical embolec-
tomy, bypass surgery or thrombolysis should be
performed, provided that the patient is fit enough
for treatment. Left untreated, acute ischemia can
lead to muscle death or necrosis. This can cause
swelling of the calf muscle, and eventually the
sac, or fascia, surrounding the muscles will restrict
any further swelling, leading to a pressure increase
within the muscle compartments. This is known as
a compartment syndrome, and the increased intra-
compartmental pressure can further exacerbate the
muscle ischemia. If limb salvage is possible, surgical
splitting of the fascia, called a fasciotomy, may be
required to release the excess pressure.
Severe muscle ischemia can produce toxins caus-
ing systemic symptoms that can lead to organ failure
and death. An urgent amputation is usually per-
formed if there is no viable option to restore blood
flow to the limb. Acute ischemia can also occur due
to microembolization to the foot, leading to occlu-
sion of the small vessels. The microemboli can origi-
nate from the heart, from atherosclerotic plaques or
DUPLEX ASSESSMENT OF LOWER LIMB ARTERIAL DISEASE
117
Figure 9.5 The appearance of critical lower limb
ischemia with gangrene of the small toe.
Chap-09.qxd 29~8~04 14:46 Page 117
from an aneurysm. In this situation it is not unusual
for the patient to have a palpable popliteal pulse.
Microembolization into the foot is often called
‘trash foot’. Localized tissue necrosis can occur and
the outcome is sometimes poor when a large area
of tissue is affected.
PRACTICAL CONSIDERATIONS FOR
LOWER EXTREMITY DUPLEX SCANNING
The objective of the examination is to locate and
grade the severity of arterial disease in the lower
limb arterial system. The time allocated for the exam-
ination depends on the number of segments that
need assessing. The femoropopliteal segment can
normally be examined in both legs in half an hour.
However, a bilateral aortoiliac to ankle scan may
take up to an hour and a half, depending on experi-
ence. There is usually no special preparation required
before a lower limb duplex scan. Nevertheless, some
vascular units request patients to fast overnight
prior to an examination of the aortoiliac arteries to
improve imaging of this region. In our experience
this is of little help, especially if patients require scans
PERIPHERAL VASCULAR ULTRASOUND
118
CFA
V
V
CFA
V
SFA
PA
SFV
PA
PV
SFA
SFJ
12
3
4
5
6
7
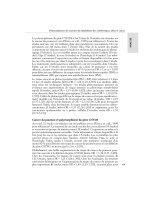
Figure 9.6 The anatomy of the right femoral artery and vein at the groin, with corresponding transverse B-mode
images at four different levels. Vessels shown on the diagram are: 1 common femoral artery, 2 common femoral vein,
3 saphenofemoral junction, 4 superficial femoral artery, 5 profunda femoris artery, 6 superficial femoral vein,
7 profunda vein. Vessels demonstrated on the images are the common femoral vein (V), common femoral artery (CFA),
saphenofemoral junction (SFJ), superficial femoral artery (SFA), profunda femoris artery (PA), superficial femoral vein
(SFV) and profunda vein (PV). Note that the femoral artery bifurcation is sometimes found above the level of the
saphenofemoral junction. In addition, the superficial femoral artery tends to roll on top of the superficial femoral vein, as
shown in the B-mode image.
Chap-09.qxd 29~8~04 14:46 Page 118
at short notice. Bowel preparations have proved use-
ful, although in practice they can be difficult to
administer to elderly or diabetic patients and are
impractical in a single visit clinic.
The patient should have an empty bladder prior
to an aortoiliac scan as this improves the visualization
of these segments and also causes less patient dis-
comfort if transducer pressure has to be applied.
The examination room should be at a comfortable
ambient temperature (Ͼ20°C) to avoid peripheral
vasoconstriction.
Scanner setup
A peripheral arterial scanning option should be
selected before starting the examination, but
adjustment of the control settings will often be
required in the presence of significant disease
(see Ch. 7). The color PRF is usually set in the
2.5–3 kHz range for demonstrating moderately
high velocity flow.
STARTING THE SCAN
It is useful to start the assessment by examining
the CFA at the groin, as the observed blood flow
patterns at this level can reveal information about
the condition of the aortoiliac arteries and also pro-
vide some clues to the condition of the superficial
femoral artery (SFA) (i.e., origin occlusion or high
resistance flow pattern due to proximal obstruction).
It is important to have a good understanding of
the anatomy of the arteries and veins at the level of
the groin and to be able to identify the major
branches and junctions and their relationship to each
other (Fig. 9.6). A 5 MHz, or broad-band equivalent,
linear array transducer is the most suitable probe
for scanning the femoral, popliteal and calf arteries.
A 3.5 MHz, or broad-band equivalent, curved linear
array abdominal transducer is used for the aortoiliac
segment. The segmental guidelines can be used in
any order. A combination of B-mode imaging, color
flow imaging and spectral Doppler recordings should
be used throughout the examination. Color flow
imaging is essential for identifying the aortoiliac
and calf arteries. Spectral Doppler velocity measure-
ments should be made at an angle of 60° or less
(see p. 69).
Assessment of the aortoiliac artery
and CFA
The patient should be relaxed and lying in a supine
position with the head supported by a pillow. The
patient should be asked to relax the abdominal mus-
cles and to rest the arms by the sides. The scanning
positions for assessing the inflow arteries are shown
in Figure 9.7, and a color image of the arteries is
shown in Figure 9.8. The procedure for assessment
is as follows:
1. Using a 5 MHz, or broad-band equivalent, linear
array transducer, the CFA is identified at the level
of the groin in transverse section, where it lies lat-
eral to the common femoral vein (Figs 9.6 and
9.7A). The CFA is then followed proximally in
longitudinal section until it runs deep under the
inguinal ligament and can no longer be assessed
DUPLEX ASSESSMENT OF LOWER LIMB ARTERIAL DISEASE
119
Aorta
Aorta
CIA CIA
CIA
CIA
EIA
IIA
IIA
IIA
CFA
CFA
CFA
EIA
EIA
A
Vein
C
B
D
SFA
Figure 9.7 Probe positions for imaging the CFA and
aortoiliac arteries. A: CFA transverse. B: Origin of external
and internal iliac arteries transverse. C: Aortic bifurcation
transverse. D: Arteries in the longitudinal plane. Starting
at the groin and pushing bowel gas upward with the
transducer (arrow) can help visualization. Positioning the
color box to the edge of the scan sector can improve the
angle of insonation with spectral Doppler.
Chap-09.qxd 29~8~04 14:46 Page 119
with this probe. A 3.5 MHz curved array trans-
ducer should then be selected. Using the probe
to push any gas upwards and driving the color
box toward the edge of the sector can help in
visualizing the aortoiliac region and in maintain-
ing adequate spectral Doppler angles (Fig. 9.7D).
2. The external iliac artery is then identified in lon-
gitudinal section and followed proximally toward
its origin using color flow imaging. Sometimes,
tilting or rolling of the transducer and the use
of oblique and coronal probe positions along
the abdominal wall are useful in imaging
around areas of bowel gas.
3. The common iliac bifurcation should be identi-
fied by locating the origin of the external iliac
and internal iliac arteries. This can be achieved
in the longitudinal plane, but transverse imaging
is also helpful for confirmation if the image is
adequate, as the internal iliac artery usually
divides in a posteromedial direction (Fig. 9.7B).
This area serves as an important anatomical land-
mark for localizing areas of disease in the aorto-
iliac system. Sometimes it is not possible to
identify the internal iliac artery, and the position
of the common iliac bifurcation has to be
inferred, as it usually lies in the deepest part of
the pelvis, as seen on the scan image.
4. The CIA is then followed back to the aortic bifur-
cation in longitudinal section (Fig. 9.7D). At this
point, it is useful to confirm the level of the aor-
tic bifurcation in transverse plane (Fig. 9.7C).
The origins of the CIA are assessed in the longi-
tudinal plane. The aorta should also be examined
in transverse and longitudinal planes to exclude
an aortic aneurysm or stenosis (see Ch. 11).
Assessment of the femoral and
popliteal arteries
To start the examination, the patient should be lying
reasonably flat with the leg rotated outward and
the knee gently flexed and supported. A color image
of the femoropopliteal and calf arteries is shown in
Figure 9.9. The scanning positions for imaging the
femoropopliteal arteries are shown in Figure 9.10.
The procedure for assessment is as follows:
1. The CFA is identified in transverse section with
a 5 MHz, or broadband equivalent, flat linear
array transducer at the groin and followed distally
to demonstrate the femoral bifurcation (Figs 9.6
and 9.10A). The CFA lies lateral to the common
femoral vein (Fig. 9.6).
2. Turning to a longitudinal plane, the femoral
bifurcation is examined (Fig. 9.10B). The pro-
funda femoris artery usually lies posterolateral
to the SFA, requiring a slight outward turn of
the transducer. The profunda femoris artery can
PERIPHERAL VASCULAR ULTRASOUND
120
CIA
EIA
CFA
IIA
A B
Figure 9.8 A: A color montage of the inflow arteries showing the CIA, external iliac (EIA) and internal iliac arteries (IIA)
and the CFA. Note the stenosis at the iliac artery bifurcation (arrow), demonstrated by aliasing. B: Spectral Doppler
demonstrates a high-grade stenosis of the EIA, indicated by high systolic velocity, aliasing and spectral broadening. The
color box has been positioned to the edge of the sector to improve the angle of insonation.
Chap-09.qxd 29~8~04 14:46 Page 120
often be followed for a considerable distance,
particularly if the SFA is occluded and it is sup-
plying a collateral pathway to the lower thigh.
The origin of the SFA is usually located antero-
medial to the profunda femoris artery, requiring
a slight inward turn of the transducer.
3. The SFA is then followed distally along the
medial aspect of the thigh in a longitudinal plane,
where it will lie above the superficial femoral
vein (Fig. 9.10C). If the image of the SFA is
lost it is easier to relocate in transverse section
(Fig. 9.10D). In its distal segment the SFA runs
deep and enters the adductor canal, becoming
the popliteal artery. It is usually possible to image
the proximal popliteal artery to just above the
knee level from this position (see Fig. 9.10E). A
3.5 MHz transducer can help to image the artery
in a large thigh.
4. The popliteal artery can be examined by rolling
the patient onto the side. Alternatively, the
patient can lie in a prone position, resting the foot
on a pillow, although a lot of elderly patients
are not able to tolerate this position. It is also
possible to image the popliteal artery with the
legs hanging over the edge of the examination
table and the feet resting on a stool. Whichever
method is used, it is important not to overex-
tend the knee joint as this can make imaging
difficult.
5. Starting in the middle of the popliteal fossa,
the popliteal artery is located in transverse sec-
tion and is seen posterior to the popliteal vein
(Fig. 9.10F). Turning into a longitudinal plane,
the popliteal artery is then followed proximally,
DUPLEX ASSESSMENT OF LOWER LIMB ARTERIAL DISEASE
121
SFA
POP
PA
AT
TPT
PA
PER
PT
Figure 9.9 A color montage of the femoropopliteal and calf arteries. The image shows the profunda femoris artery
(PA), SFA, popliteal artery (POP), tibial peroneal trunk (TPT), PT, AT and peroneal artery (PER).
SFA
Profunda
artery
Femoral
vein
Transducer in transverse
position behind knee in
popliteal fossa
A
PA
SFA
D
Artery
Vein
Vein
Artery
F
POP
CFA
Medial aspect of thigh
CFA
SFA
POP
AT
TPT
G
B
E
C
H
Figure 9.10 Probe positions for imaging the
femoropopliteal arteries. A: Femoral artery bifurcation
transverse. B: Femoral bifurcation longitudinal. C: SFA
longitudinal. D: SFA transverse. E: Proximal popliteal
artery above-knee longitudinal. F: Popliteal artery
transverse. G: Popliteal artery longitudinal, from the
popliteal fossa. H: Origin of the AT.
Chap-09.qxd 29~8~04 14:46 Page 121
above the popliteal fossa, to overlap the area
previously examined from the lower medial thigh
(Fig. 9.10G).
6. The popliteal artery is then examined longitudi-
nally across and below the popliteal fossa, where
it is possible to continue directly into the tibioper-
oneal trunk. The tibioperoneal trunk can be
imaged from a number of positions.
Assessment of the tibial arteries
The tibial arteries can be imaged from several differ-
ent transducer positions, as demonstrated in Figure
9.11. It is often easier to locate the tibial arteries in
the distal calf and follow them proximally to the
top of the calf. However, for the purposes of this
section, the description of the examination starts
just below the knee. It should be noted that imag-
ing of the distal tibial arteries at the ankle is often
easier with a high-frequency 10 MHz, or broad-
band equivalent, flat linear array transducer.
Anterior tibial artery
1. With the leg rolled outward and the knee slightly
flexed, the origin of the anterior tibial (AT) artery
is imaged from a posteromedial position just
below the knee, where it will be seen to drop
immediately away from the popliteal artery
(Fig. 9.10H). Often it is only possible to see
the first 1–2 cm of the AT from this position.
The tibioperoneal trunk is usually seen as a direct
continuation of the popliteal artery distal to the
AT artery origin.
2. The proximal AT artery is then imaged from the
anterolateral aspect of the upper calf, just below
the knee, where it will be seen to rise toward the
transducer in a curve, through the interosseous
membrane. The membrane can be identified as
a bright echogenic line running between the
tibia and fibula in cross section. The artery will
lie on top of the membrane. The AT artery is
then followed distally, along the anterolateral
PERIPHERAL VASCULAR ULTRASOUND
122
AT
AT
TPT
TPT
TPT
AT ؎ PER
AT
PER
PER
PT
PT
PER
TPT
L
A
T
E
R
A
L
M
E
D
I
A
L
L
A
T
E
R
A
L
M
E
D
I
A
L
F
T
F
T
AB
Figure 9.11 Cross-sections of the calf to show longitudinal transducer positions for imaging the tibial arteries and
veins in the calf. A: Several positions can be used to image the vessels in the upper calf proximal to the bifurcation of
the tibioperoneal trunk (TPT). B: Probe positions to image the PT, AT and peroneal artery (PER) in the mid- and lower calf.
Note that it is possible to image two vessels from a similar position, as shown.
Chap-09.qxd 29~8~04 14:46 Page 122
border of the calf, until it becomes the dorsalis
pedis artery, over the top of the foot.
Posterior tibial artery
1. With the leg rolled outward and the knee flexed,
the origin of the posterior tibial (PT) artery is
imaged from a medial position, below the knee,
where the tibioperoneal trunk divides into the
PT artery and the peroneal artery. The proximal
PT artery will gently rise toward the transducer,
and the associated paired veins act as useful land-
marks. The origin of the peroneal artery is often
visible from this plane and will lie posterior to
the PT artery origin.
2. The PT artery is then followed along the
medial aspect of the calf toward the inner ankle
or medial malleolus. The PT artery lies superfi-
cial to the peroneal artery when imaged from
the medial aspect of the calf.
3. The origin and a short segment of the PT artery
can often be visualized from a posterolateral
position below the knee, where it will be seen
to run deep as it divides from the tibioperoneal
trunk.
Peroneal artery
Imaging of the peroneal artery may have to be
performed from a number of different positions
(Fig. 9.11B). The optimum position varies from
patient to patient.
View 1 The peroneal artery can be followed from
its origin along the calf using the same medial calf
position as that described to image the PT artery.
From this position, the peroneal artery will be seen
lying deeper than the PT artery against the border
of the fibula, surrounded by the larger peroneal
veins. Slight anterior or posterior longitudinal tilting
of the probe may be needed to follow the artery
distally.
View 2 The peroneal artery can usually be fol-
lowed distally from its origin using a posterolateral
position, below the knee and along the calf.
View 3 The peroneal artery can sometimes be
imaged from the anterolateral aspect of the calf,
where it will be seen lying deep to the AT artery.
This is the most difficult position from which to
obtain images of the peroneal artery.
Assessment of tibial arteries and the
plantar arch prior to bypass surgery
Duplex scanning in combination with continuous
wave Doppler recordings can be a useful method
of determining which calf artery is supplying most
blood to the distal region of the foot prior to distal
bypass surgery (McCarthy et al 1999). In this way,
it is possible to select a target vessel to position the
distal anastomosis. This is important as there needs
to be a low-resistance arterial pathway to the foot,
distal to a graft, to ensure that the graft remains
patent and the foot perfused. The three tibial arter-
ies of the calf have connections to the plantar arch,
which is located toward the end of the foot. The
PT and dorsalis pedis arteries usually contribute most
flow to the arch via plantar arteries. The plantar
arch supplies blood to the plantar metatarsal arteries
and digital arteries of the toes. The patient should
be assessed with the leg in a dependent position to
maximize blood flow distal to the diseased part of
the vessel. Using the duplex scanner, it is possible
to assess the patency and quality of each of the tibial
arteries to ankle level. A continuous wave Doppler
probe is then used to assess the Doppler signals
from the plantar arch. The probe position for record-
ing flow at the plantar arch is demonstrated in
Figure 9.3. Selective digital pressure is then applied
over the most suitable tibial artery, as previously
demonstrated by duplex scanning of the target vessel,
to occlude it at the ankle. A substantial reduction
or cessation of flow at the plantar arch during com-
pression would suggest that the arch is in continua-
tion with the selected tibial artery. This type of
assessment can be complex, as there may be more
than one patent tibial artery supplying the plantar
arch. The peroneal artery can also supply the distal
AT artery or dorsalis pedal artery via branches, which
in turn may supply the plantar arch.
Commonly encountered problems
There are a number of problems and pitfalls associ-
ated with lower limb duplex scanning. Table 9.4
lists some of the more frequently encountered
problems.
DUPLEX ASSESSMENT OF LOWER LIMB ARTERIAL DISEASE
123
Chap-09.qxd 29~8~04 14:46 Page 123
SCAN APPEARANCES
B-mode images
Normal appearance
Like the carotid arteries, the lumen of a normal
peripheral artery should appear clear, and the walls
should be uniform along each arterial segment,
although noise may cause speckle within the image
of the vessel. The intima-media layer of the arterial
wall is sometimes seen in normal femoral and
popliteal arteries. In practice, it is frequently difficult
to clearly image the vessels in the aortoiliac segment,
abductor canal region and calf without the help of
color flow imaging.
Abnormal appearance
Areas of atheroma, particularly if they are calcified,
may be seen within the vessel lumen. The atheroma
may be extensive and diffusely distributed, especially
in the SFA (Fig. 9.12). Large plaques at the common
femoral bifurcation are relatively easy to image, and
these may extend into the proximal profunda artery
or SFA. Calcification of the arterial wall, especially
in diabetic patients, produces strong ultrasound
reflections, and the walls of the calf arteries can
appear particularly prominent (Fig. 9.4). When an
arterial segment has been occluded for some time,
the vessel may contract and appear as a small cord
adjacent to the corresponding vein. This appearance
PERIPHERAL VASCULAR ULTRASOUND
124
Table 9.4 Common problems encountered during duplex evaluation of the lower limb arteries
Segment Problem Solutions
Aortoiliac arteries Bowel gas obscuring part or all of the image Try different probe positions (medial, lateral
or coronal positions); leave the segment
and try again in a few minutes
Aortoiliac arteries Tortuous arteries Use the color display to follow the artery;
considerable adjustment of the probe
position is often needed
Femoropopliteal arteries Severe calcification of the artery producing Try different transducer positions to work
color image dropout around the calcification
Femoropopliteal arteries Obese patient with large thigh When using a broad-band transducer, lower
the color and spectral Doppler transmit
frequencies for better penetration; consider
switching to a 3.5 MHz curved linear array
transducer in very difficult situations
Tibial arteries Large calf with gross edema Start the scan at the ankle and work
proximally; a 3.5 MHz linear array probe
can be used to image these vessels
proximally
Tibial arteries Very low flow due to proximal occlusions Lower the pulse repetition frequency and
wall filters; place the leg in a dependent
position to increase distal blood flow
CALCIFICATION
Figure 9.12 Calcified atheroma (arrows) is present in
the SFA, leading to drop-out of the color flow signal in
parts of the lumen.
Chap-09.qxd 29~8~04 14:46 Page 124
is most frequently seen in the SFA and popliteal
artery. B-mode imaging in combination with color
flow imaging is also very useful for identifying acute
occlusions of the SFA or popliteal artery, where
there may be fresh thrombus present in the vessel
lumen. The lumen will appear clear or demonstrate
minimal echoes on the image, because thrombus
has a similar echogenicity to blood (Fig. 9.13).
However, color flow imaging reveals an absence of
flow in the occluded segment of the vessel. The start
of the occlusion can often be very abrupt, with little
disease seen proximally.
Abnormal dilatations or arterial aneurysms should
be measured using the B-mode image, as described
in Chapter 11.
Color flow images
Normal appearance
Normal arterial segments can be interrogated rapidly
using color flow imaging. There should be color
filling to the vessel walls. The color image normally
demonstrates a pulsatile flow pattern, with the color
alternating between red and blue due to flow rever-
sal during the diastolic phase (see Ch. 5). There
are situations in which flow in nondiseased lower
limb arteries may have reduced pulsatility or even
be continuous. Examples include increased flow
(hyperemia) due to limb infection or the presence
of arteriovenous fistulas. Hyperemic flow will be
demonstrated as continuous flow in one color scale
but there should be no evidence of arterial stenosis.
Abnormal appearance
Utilizing the color controls as described in Chapter 7,
arterial stenoses will be demonstrated as areas of
color flow disturbance or aliasing. Severe stenoses
frequently produce a disturbed color flow pattern
extending 3 to 4 vessel diameters beyond the lesion
(Figs 9.8 and 9.14). Any areas of color flow distur-
bance should be investigated with angle-corrected
spectral Doppler to estimate the degree of narrow-
ing. In addition, the color flow image of flow in a
nondiseased artery distal to severe proximal disease
may demonstrate damped low-velocity flow, which
will be seen as continuous flow in one direction.
Occlusions of lower limb arteries most frequently
occur in the SFA and popliteal artery. An occlusion is
demonstrated by a total absence of color flow in the
vessel. Occlusions can occur at the origins of arteries
or in mid-segment. If an artery is occluded from its
origin, at the level of a major bifurcation, flow will
normally still be seen in the sister branch. For exam-
ple, the profunda femoris artery is usually found to
be patent when the SFA is occluded (Fig. 9.15).
When an artery occludes in mid-segment, collateral
vessels are normally seen dividing from the main
trunk at the beginning of the occlusion. Similarly,
collateral vessels resupply flow to the artery at the
distal end of the occlusion (Fig. 9.16). Collateral ves-
sels can follow tortuous routes as they divide from
the main trunk, and they are sometimes only seen
when the main artery is imaged in cross-section. It
is therefore helpful to interrogate any suspected
DUPLEX ASSESSMENT OF LOWER LIMB ARTERIAL DISEASE
125
POP A
Figure 9.13 An acute occlusion of the popliteal artery.
The vessel is patent to the level of the two arrows. The
occlusion is demonstrated by the relatively low level
echoes in the lumen distally. Note some intimal detail
is still visible in the occluded section (curved arrow).
Figure 9.14 Two severe stenoses are demonstrated in
the SFA by areas of color flow disturbance and aliasing
(arrows).
Chap-09.qxd 29~8~04 14:46 Page 125
occlusion in both longitudinal and transverse imag-
ing planes. The PRF often needs to be lowered (typ-
ically to 1 kHz) distal to an occlusion in order to
increase the sensitivity of the scanner to lower flow
velocities. The color flow image distal to an occlusion
often demonstrates a continuous forward flow pat-
tern with reduced pulsatility due to damping of the
normal blood flow pattern. Blood flow in the main
artery may also improve progressively over the first
few centimeters distal to the occlusion as more col-
lateral vessels join the main trunk. This effect can be
observed on the color flow image (Fig. 9.17). High-
velocity flow in a collateral vessel can produce an area
of marked color flow disturbance in the main artery
at the point where the collateral joins. This can be
misinterpreted as a stenosis. Spectral Doppler should
be used to interrogate this area carefully. It is possible
to misdiagnose a long stricture as an occlusion
because of very slow flow through the stricture due
to the development of good collateral flow around
the diseased site. The PRF should be lowered to
examine low-velocity flow across these lesions.
Spectral Doppler
Normal recordings
At rest, the normal spectral Doppler display of
extremity arterial blood flow demonstrates a
triphasic flow pattern with a clear spectral window
(Fig. 9.18). It may even be possible to see four
phases in young healthy adults. In elderly patients
or patients with poor cardiac output, the waveform
may be biphasic or even monophonic. The average
PERIPHERAL VASCULAR ULTRASOUND
126
B
A
PA
CIV
CIA
EIA
IIA
Figure 9.15 A: Color flow image of the femoral bifurcation demonstrating an SFA origin occlusion (arrow). The
profunda femoris artery (PA) is patent. B: Color flow image of an external iliac artery (EIA) occlusion (arrow). The CIA
and internal iliac artery (IIA) are patent. The common iliac vein (CIV) is visible in this image.
Figure 9.16 A short mid-SFA
occlusion is demonstrated by an
absence of color flow in the vessel
(large arrow). Large collateral
vessels are seen at both ends of
the occlusion (small arrows).
Chap-09.qxd 29~8~04 14:46 Page 126
peak systolic velocity found in the external iliac, SFA
and popliteal arteries are 119, 90 and 68 cm/s,
respectively (Jager et al 1985). During the examina-
tion, spectral Doppler recordings should be taken
at frequent intervals to confirm that the flow pattern
is normal. Spectral Doppler recordings taken from
patients with infections such as cellulitis may demon-
strate hyperemic flow with reduced pulsatility.
Abnormal recordings and grading of stenoses
Areas of color flow disturbance should always be
interrogated with spectral Doppler. The spectral
Doppler sample volume should be small, and the
measurements should be taken just proximal to,
across and just beyond the lesion. In the presence
of a significant stenosis, there will be an increase in
flow velocity across the lesion associated with spec-
tral broadening and turbulence just distal to the
lesion. As demonstrated previously, a concentric
50% diameter reduction of the arterial lumen will
produce a 75% reduction in cross-sectional area,
leading to significant flow changes. The main cri-
terion used to grade the degree of narrowing in a
lower limb artery is the measurement of the peak
systolic velocity ratio. The peak systolic velocity
ratio is calculated by dividing the maximum peak
systolic velocity recorded across the stenosis (V
s
) by
the peak systolic velocity recorded in a normal area
of the artery just proximal to the stenosis (V
p
), as
demonstrated in Figure 9.19. Different protocols
DUPLEX ASSESSMENT OF LOWER LIMB ARTERIAL DISEASE
127
O
Figure 9.17 A color montage demonstrates flow in the popliteal artery distal to an occlusion (O). The flow becomes
progressively higher distal to the occlusion, as more collateral vessels join the main artery (arrows). Marked areas of flow
disturbance can occur at points where collateral vessels feed the main artery, and these can be mistaken for stenoses.
Figure 9.18 A normal triphasic Doppler waveform
recorded from the SFA.
A
A
B
B
Figure 9.19 An SFA stenosis is assessed using spectral
Doppler. A: Measurement of the peak systolic velocity just
proximal to the stenosis. B: Measurement of the peak
systolic velocity across the stenosis. The peak systolic
velocity ratio is calculated by dividing B by A, producing a
velocity ratio of 5. This would indicate a severe stenosis.
Chap-09.qxd 29~8~04 14:46 Page 127
have been published for defining a 50%, or greater,
diameter reduction in the lower limb arteries.
Many vascular units use a peak systolic velocity
ratio of equal to or greater than 2 (Cossman et al
1989, Sensier et al 1996), although a ratio of 2.5
is used by other centers (Legemate et al 1991). It
is important to audit and evaluate the criteria used
by your unit against other imaging techniques such
as angiography or MRA. Table 9.5 shows how the
velocity ratio can be used to grade the severity
of lower limb disease (Hennerici & Neuerburg-
Heusler 1998). Velocity ratios can still be used to
grade stenoses in the presence of multi-segment
disease. Other methods of measurement, including
pulsatility index (PI), have tended to be used with
continuous wave Doppler but are probably less
useful for duplex scanning where velocity changes
can be measured directly.
Abnormal waveform shapes
The shape of the spectral Doppler waveform can
provide considerable information about the condi-
tion of lower limb arteries. Damped monophasic
waveforms with an increased systolic rise time
are characteristic of disease proximal to the point
of measurement (Fig. 9.20B). Conversely, high-
resistance, low-volume flow waveforms often
indicate severe disease distal to the point of meas-
urement. One such example is the characteristic
shoulder seen on the systolic downstroke of an
SFA waveform recorded proximal to severe disease
in the SFA (Fig. 9.20A). This is due to a reflected
wave from the distal disease or occlusion. Severe cal-
cification of the arterial wall may also affect the shape
of the recorded Doppler waveform due to changes in
vessel compliance. This is commonly observed in the
tibial vessels of diabetic patients, where the wave-
form shape may become monophasic.
PERIPHERAL VASCULAR ULTRASOUND
128
Table 9.5 Suggested criteria for grading lower limb arterial disease using velocity ratios, based on several
references (see text)
Diameter reduction Velocity ratio (V
s
/V
p
) Comments
0–49% Ͻ2 Waveform is triphasic but mild spectral broadening and an increase in end
diastolic velocities are recorded as the degree of narrowing approaches 49%
50–74% у2 Waveforms tend to become biphasic or monophasic; there is an increase in
end diastolic velocity; spectral broadening is present; flow disturbance and
some damping are recorded distal to the stenosis
75–99% у4 Waveform is usually monophasic with a significant increase in end diastolic
velocity; marked turbulence and spectral broadening are demonstrated; flow
is damped distal to the stenosis
Occluded No flow detected Doppler waveforms proximal to an occlusion often demonstrate a high-
resistance flow pattern
A
B
Figure 9.20 Waveform shapes can reveal useful
information about the condition of proximal and distal
arteries. A: Waveform recorded from the SFA just proximal
to an occlusion. Note the high-resistance, low-volume
waveform shape and characteristic shoulder on the
systolic downstroke (arrow), due to pulse wave reflection
from distal disease. B: Damping of the CFA waveform with
an increased systolic acceleration time and loss of
pulsatility indicates significant proximal disease.
Chap-09.qxd 29~8~04 14:46 Page 128
Much debate has surrounded the shape of the
CFA waveform as an indicator of iliac artery or
inflow disease. A study by Sensier et al (1998)
demonstrated that qualitative assessment of the CFA
Doppler waveform has a sensitivity of 95%, a speci-
ficity of 80% and an accuracy of 87% for the predic-
tion of significant aortoiliac artery disease. This study
therefore suggests that observation of the CFA wave-
form shape is a useful technique for the investigation
of inflow disease. The presence of triphasic flow with
a short systolic rise time is an indicator of normal
inflow. However, care should be exercised when
investigating younger patients, who may have a very
short proximal iliac stenosis, as the arterial waveform
shape may have recovered at the level of the CFA,
appearing normal. Marked damping of the CFA
waveform with an increase in systolic acceleration
time is a good indicator of severe inflow disease.
Perhaps the most confusing situation occurs where
the inflow arteries are normal but the SFA is
occluded and the profunda femoris artery is severely
stenosed. This can give rise to a monophonic wave-
form pattern in the CFA with a high end diastolic
velocity, although the systolic acceleration time
remains short. A great deal of care should be used
in interpreting flow patterns in this situation.
Areas of aneurysmal dilation typically demonstrate
a reduction in peak systolic velocity, frequently asso-
ciated with disturbed flow patterns.
ASSESSMENT OF ARTERIAL STENTS
Arterial stents are used to prevent re-stenosis,
although there is limited published evidence to
demonstrate that they are any more effective than
standard angioplasty at maintaining long-term vessel
patency. Stents are mainly deployed in the aortoiliac
arteries and proximal CFA, although they are also
used in the SFA and popliteal artery. Stents are avail-
able in different lengths and sizes, and multiple stents
can be deployed if the disease is very extensive. They
are usually visible on the B-mode image, producing
a stronger reflection compared to the arterial wall.
The cross-hatched, or lattice, metal structure can
often be identified. It is sometimes possible to see
nipping of the stent if the atheroma in the artery is
very calcified or fibrous and has not been completely
compressed to the vessel wall. Color flow imaging
and spectral Doppler can be used to assess the flow
across the stent (Fig. 9.21). It is not uncommon to
find some localized flow disturbance in the region
of the stent due to the step between the arterial
wall and proximal and distal ends of the stent.
Spectral Doppler should be used to grade the degree
of any in-stent stenosis using the same criteria as
used for grading lower limb disease. Stents placed
in arteries close to joints, such as the CFA or
popliteal artery, can be stressed by joint movement
and may kink or bend. Localized aneurysms can be
excluded by inserting a covered stent across the
aneurysm; this is discussed in Chapter 11.
OTHER ABNORMALITIES AND
SYNDROMES
Lower limb symptoms in younger patients are some-
times due to inflammatory or small vessel disorders,
such as Buerger’s disease. Flow recordings are nor-
mal in the larger arteries proximally, but the distal
vessels in the calf may demonstrate low-flow, high-
resistance waveforms.
Popliteal entrapment syndrome
Popliteal entrapment syndrome is also a rare but
potential cause of claudication and possible distal
embolization due to arterial wall damage. In this
situation, the popliteal artery follows an anomalous
course below the knee and is trapped by the heads
of the gastrocnemius muscle during plantar flexion.
The popliteal artery can also be trapped by fibrous
bands in this area. To test for popliteal entrapment
DUPLEX ASSESSMENT OF LOWER LIMB ARTERIAL DISEASE
129
Figure 9.21 Color flow imaging demonstrates a long
stricture in a CFA stent caused by intimal hyperplasia.
The stent walls are clearly visible (arrows).
Chap-09.qxd 29~8~04 14:46 Page 129
syndrome, the patient should lie prone with the legs
gently flexed and the feet hanging over the end of
the examination table. The below-knee popliteal
artery should be imaged at the level of the gastroc-
nemius muscle heads. The patient should point the
foot down (plantar flex) against a counterpressure,
typically by having a colleague apply moderate pres-
sure against the foot. Narrowing or occlusion of the
popliteal artery during this maneuver may indicate
popliteal entrapment syndrome. However, there is
evidence to suggest that significant compression of
the popliteal artery can occur in normal volunteers
during this investigation, casting some doubt on
the usefulness of this test (Erdoes et al 1994).
Cystic adventitial disease of the
popliteal artery
This rare disease is caused by cystic swelling of the
arterial wall, which impinges into the lumen of
the popliteal artery, leading to eventual occlusion.
The location of the lesion is often found across the
knee joint. It should be considered as a potential
cause of symptoms in the young patient, especially
in the absence of any other pathology. Treatment
is by excision and local repair or bypassing.
REPORTING
In our experience, the use of diagrams demon-
strating the position of disease and corresponding
velocity measurements and ratios is the simplest
method of reporting results, as shown in Figure 9.22.
Areas that were impossible to assess can be hatched
out on the diagram. Surgeons and physicians also
find this method of reporting helpful when review-
ing results in a busy outpatient clinic, as reading
pages of text can be very time-consuming. Copies
of the report can be sent to the radiology depart-
ment with a request card if the patient requires an
angiogram or angioplasty, thus allowing the radiol-
ogist to pre-plan puncture sites. In many situations
an angioplasty can be performed without a diag-
nostic arteriogram.
PERIPHERAL VASCULAR ULTRASOUND
130
CIA stenosis
8 × velocity
increase
SFA
occlusion
Severe diffuse
SFA disease
CIA occlusion
Tibial
artery
disease
Figure 9.22 The easiest method of reporting lower
limb scans is by the use of diagrams. Areas of narrowing
can be drawn onto the map and the corresponding
velocity recordings indicated. Occlusions are
demonstrated by blocking out the appropriate regions.
Chap-09.qxd 29~8~04 14:46 Page 130
References
disease. In: Bernstein E F (ed) Noninvasive diagnostic
techniques in vascular disease. C V Mosby, St Louis,
pp 619–631
Legemate D A, Teeuwen C, Hoeneveld H, et al 1989 The
potential of duplex scanning to replace aortoiliac and
femoro-popliteal angiography. European Journal of
Vascular Surgery 3(1):49–54
Legemate D A, Teeuwen C, Hoeneveld H, et al 1991
Spectral analysis criteria in duplex scanning of aortoiliac
and femoropopliteal arterial disease. Ultrasound in
Medicine and Biology 17(8):769–776
McCarthy M J, Nydahl S, Hartshorne T, et al 1999 Color-
coded duplex imaging and dependent Doppler
ultrasonography in the assessment of cruropedal vessels.
British Journal of Surgery 86(1):33–37
Pemberton M, London N J 1997 Color flow duplex
imaging of occlusive arterial disease of the lower limb.
British Journal of Surgery 84(7):912–919
Proia R R, Walsh D B, Nelson P R, et al 2001 Early results
of infragenicular revascularization based solely on
duplex arteriography. Journal of Vascular Surgery
33(6):1165–1170
Sensier Y, Hartshorne T, Thrush A, et al 1996 A
prospective comparison of lower limb color-coded
duplex scanning with arteriography. European Journal
of Vascular and Endovascular Surgery 11(2):170–175
Sensier Y, Bell P R, London N J 1998 The ability of
qualitative assessment of the common femoral Doppler
waveform to screen for significant aortoiliac disease.
European Journal of Vascular and Endovascular
Surgery 15(4):357–364
DUPLEX ASSESSMENT OF LOWER LIMB ARTERIAL DISEASE
131
AbuRahma A F 2000 Segmental Doppler pressures and
Doppler waveform analysis in peripheral vascular
disease of the lower extremities. In: AbuRahma A F,
Bergan J J (eds) Noninvasive vascular diagnosis.
Springer, London, pp 213–229
Cossman D V, Ellison J E, Wagner W H, et al 1989
Comparison of contrast arteriography to arterial
mapping with color-flow duplex imaging in the lower
extremities. Journal of Vascular Surgery
10(5):522–529
Egglin T K, O’Moore P V, Feinstein A R, et al 1995
Complications of peripheral arteriography: a new
system to identify patients at increased risk. Journal of
Vascular Surgery 22(6):787–794
Erdoes L S, Devine J J, Bernhard V M, et al 1994 Popliteal
vascular compression in a normal population. Journal
of Vascular Surgery 20(6):978–986
European Working Group on Critical Leg Ischaemia.
Second European consensus document on chronic
critical leg ischaemia 1992. European Journal of
Vascular Surgery 6(5)[Suppl A]:1–32
Fowkes F G, Housley E, Cawood E H, et al 1991
Edinburgh Artery Study: prevalence of asymptomatic
and symptomatic peripheral arterial disease in the
general population. International Journal of
Epidemiology 20(2):384–392
Hennerici M, Neuerburg-Heusler D 1998 Vascular
diagnosis with ultrasound. Thieme, Stuttgart,
pp 179–180
Jager K A, Ricketts H J, Strandness D E Jr 1985 Duplex
scanning for the evaluation of lower limb arterial
Further reading
AbuRahma A F, Bergan J J 2000 Noninvasive vascular
diagnosis. Springer, London
Polak J F 1992 Peripheral vascular sonography. Williams &
Wilkins, Baltimore
Zwiebel W J 1992 Introduction to vascular ultrasono-
graphy, 3rd edn. W B Saunders, Philadelphia
Chap-09.qxd 29~8~04 14:46 Page 131
This page intentionally left blank
INTRODUCTION
In contrast to lower limb arteries, atherosclerotic
disease in the upper extremities is rare and accounts
for approximately 5% of all extremity disease (Abou-
Zamzam et al 2000). The most commonly affected
sites are the subclavian (SA) and axillary arteries. The
disorder is sometimes associated with extracranial
carotid artery disease. Radiotherapy in this region,
resulting in fibrosis and scarring, can also cause
damage to the SA and axillary arteries. Compression
of the SA in the area of the thoracic outlet, known
as thoracic outlet syndrome (TOS), can produce
significant upper limb symptoms.
Acute obstruction of the axillary or brachial arter-
ies may also occur due to embolization from the heart
or SA aneurysms. In this situation, duplex scanning
is useful for demonstrating the length and position
of the occlusion. Microvascular disorders, such as
Raynaud’s phenomenon, can produce significant
symptoms in the hands, which may be confused
with atherosclerotic disease.
ANATOMY OF THE UPPER EXTREMITY
ARTERIES
The anatomy of the upper extremity arteries is
illustrated in Figures 10.1 and 10.2. The left SA
divides directly from the aortic arch, but the right
SA originates from the innominate or brachio-
cephalic artery. The thoracic outlet is the point
where the SA, subclavian vein and brachial nerve
plexus exit the chest. The SA runs between the
anterior and middle scalene muscles and passes
133
Chapter 10
Duplex assessment of upper
extremity arterial disease
CHAPTER CONTENTS
Introduction 133
Anatomy of the upper extremity arteries 133
Symptoms and treatment of upper limb
arterial disease 135
Practical considerations for duplex assessment
of upper extremity arterial disease 135
Scanning techniques 136
Subclavian and axillary arteries 136
Brachial artery 137
Radial and ulnar arteries 137
Palmar arch and digital arteries 138
Commonly encountered problems 138
Ultrasound appearance 138
Normal appearance 138
Abnormal appearance 138
Thoracic outlet syndrome (TOS) 139
Maneuvers for assessing TOS 140
Duplex assessment of TOS 141
Aneurysms 142
Ultrasound assessment of hemodialysis
access grafts and arteriovenous
fistulas (AVF) 142
Other disorders of the upper extremity
circulation 143
Reporting 143
Chap-10.qxd 29~8~04 14:48 Page 133
between the clavicle and first rib to become the
axillary artery. The diameter of the SA ranges from
0.6 to 1.1 cm. The SA has a number of important
branches, including the vertebral artery and inter-
nal thoracic artery (also referred to as the mam-
mary artery), which is frequently used for coronary
artery bypass surgery.
The axillary artery becomes the brachial artery
as it crosses the lower margin of the tendon of
the teres major muscle, at the top of the arm. The
diameter of the axillary artery ranges between 0.6
and 0.8 cm. The brachial artery then runs distally
on the medial or inner side of the arm in a groove
between the triceps and biceps muscles. The deep
brachial artery divides from the main trunk of
the brachial artery in the upper arm and acts as an
important collateral pathway around the elbow if
the brachial artery is occluded distally. The brachial
artery runs in a medial to lateral course over the
inner aspect of the elbow (cubital fossa) and then
divides, 1–2 cm below the elbow, into the radial and
ulnar arteries. The ulnar artery dives deep beneath
the flexor tendons in the upper forearm. The radial
artery runs along the lateral side of the forearm
toward the thumb and is palpable at the wrist. The
ulnar artery runs along the medial side of the forearm
and is sometimes the dominant vessel of the forearm.
The common interosseous artery is an important
branch of the ulnar artery in the upper forearm as
it can act as a collateral pathway if the radial and
ulnar arteries are occluded. The radial artery sup-
plies the deep palmar arch in the hand, and the
ulnar artery supplies the superficial palmar arch.
There are usually communicating arteries between
the two systems. In some people only one of the
wrist arteries will supply the palmar arch system.
The fingers are supplied by the palmar digital arter-
ies. There are a number of anatomical variations in
the arm, which are shown in Table 10.1. The arms
PERIPHERAL VASCULAR ULTRASOUND
134
Ri
g
ht common carotid arter
y
L
eft common carotid arter
y
Left subclavian arter
y
Ri
g
ht subclavia
n
artery
Ri
g
ht vertebral arter
y
Left vertebral artery
Th
y
rocervica
l
tr
u
n
k
Brachioce
p
hali
c
tr
u
n
k
Int
e
rn
al
thor
ac
i
c
arter
y
Aorti
c
a
r
ch
Figure 10.1 The arterial anatomy of the aortic arch
and subclavian artery.
Deep brachial
artery
Common palmar
digital arteries
Superficial palmar arch
Anterior and
posterior humeral
circumflex arteries
Radial recurrent
artery
Brachial artery
Ulnar recurrent artery
Clavicle
Axillary artery
1st rib (projecting
back into page)
Subclavian
artery
Radial artery
Ulnar artery
Common interosseous
artery
Deep
palmar arch
Proper digital
arteries
Sternum
Figure 10.2 The arterial anatomy of the arm and hand.
Chap-10.qxd 29~8~04 14:48 Page 134
normally develop good collateral circulation around
diseased segments. The major collateral pathways
of the arm are summarized in Table 10.2.
SYMPTOMS AND TREATMENT OF UPPER
LIMB ARTERIAL DISEASE
The main causes of upper limb disorders are shown
in Box 10.1. Many patients with chronic upper limb
arterial disease experience few symptoms because
of the development of good collateral circulation in
the arm. However, some patients complain of aching
and heaviness in the arm following a period of use
or exercise. Patients with significant chronic symp-
toms can be treated by angioplasty, provided that
the lesion is suitable for dilation. Arterial bypass
surgery is rarely performed in the upper extremi-
ties. Acute obstructions can produce marked distal
ischemia, and the forearm and hand may be cold and
painful. In many cases of acute ischemia the condi-
tion of the arm and hand improves with appropriate
anticoagulation. However, embolectomy, throm-
bolysis or bypass surgery may be performed if there
is persistent distal ischemia. Trauma, due to injury
or stab wounds to the arm or shoulder, can result
in arterial damage, requiring local repair or bypass
surgery. SA or axillary artery aneurysms can be
bypassed with grafts, although in some cases a cov-
ered stent can be deployed to exclude flow in the
aneurysm sac. Occasionally, patients with arterio-
venous fistulas will be encountered. These fistulas
range in size and distribution and can affect the
hand as well as the arm.
PRACTICAL CONSIDERATIONS FOR
DUPLEX ASSESSMENT OF UPPER
EXTREMITY ARTERIAL DISEASE
The objective of the scan is to identify and grade
the severity of arterial disease in the upper limb
DUPLEX ASSESSMENT OF UPPER EXTREMITY ARTERIAL DISEASE
135
Table 10.1 Anatomical variations of the upper
limb arteries
Artery Variation
Left subclavian artery Common origin with common
carotid artery from aortic arch
Brachial artery High bifurcation of brachial
artery
Radial artery High origin from axillary artery
Ulnar artery High origin from axillary artery
Table 10.2 Major collateral pathways of the
upper arm
Diseased Normal distal Possible pathways
segment artery
Proximal Distal subclavian Vertebral artery,
subclavian artery internal thoracic
artery artery and thyro-
cervical trunk
Distal subclavian Distal axillary Collateral flow to
or proximal artery the circumflex
axillary artery humeral arteries
Brachial artery Distal brachial Deep brachial
artery or proximal artery to the
radial and ulnar recurrent radial
arteries and ulnar arteries
Radial and ulnar Distal radial and Interosseous
arteries ulnar arteries artery and
branches of the
recurrent radial
and ulnar arteries
● Atherosclerotic disease
● Acute obstruction due to emboli from the heart
● Aneurysms
● Fibrosis of the subclavian and axillary arteries
due to radiotherapy
● Shoulder and arm dislocation
● Trauma or stab wounds
● Damage caused by arterial access and invasive
blood pressure lines
● Thoracic outlet syndrome
● Raynaud’s phenomenon
● Reflex sympathetic dystrophy
● Vibration white finger disease
● Takayasu’s arteritis
Box 10.1 Common causes of symptoms
involving the arterial and microvascular
circulation of the arms and hands
Chap-10.qxd 29~8~04 14:48 Page 135
arteries. In addition, the thoracic outlet can be
investigated for possible compression of the SA.
A minimum of half an hour should be allocated
for the examination.
There is no special preparation required prior to
the scan, although the patient will have to expose the
shoulder and upper arm for scanning of the distal
SA and axillary arteries. The examination room
should be at a comfortable ambient temperature
(Ͼ20° C) to prevent vasoconstriction of the distal
arteries. The patient should lie supine with the
head supported on a thin pillow for comfort. The
SA and proximal axillary artery can be scanned
by sitting behind the patient. This is usually a more
comfortable position than scanning from the side
of the patient. To image the distal axillary and
brachial arteries, the patient should be examined
from the side of the examination table and the arm
should be abducted, be externally rotated and be
resting on an arm board or a suitable rest. The dis-
tal brachial, radial and ulnar arteries are imaged
with the hand in a palm-up position, resting on a
support. The scanner should be configured for a
peripheral arterial examination, and in the absence
of a specific upper limb preset, a lower limb arterial
option should be selected.
SCANNING TECHNIQUES
A 5 MHz, or broad-band equivalent, flat linear
array transducer is the most suitable probe for
scanning the SA and axillary arteries. A 10 MHz,
or broad-band equivalent, flat linear array trans-
ducer produces the best images of the brachial,
radial and ulnar arteries, particularly as the radial
and ulnar arteries are very superficial at the wrist.
In addition, a 5–7 MHz curved linear array trans-
ducer can be useful for imaging the proximal SA at
the level of the supraclavicular fossa, as it fits more
easily into the contour of this region. The trans-
ducer positions for imaging the upper extremity
arteries are shown in Figure 10.3. A color flow
montage of the upper extremity arteries is shown
in Figure 10.4.
Subclavian and axillary arteries
The SA is initially located in a transverse plane in
the supraclavicular fossa, where it will lie superior
to the subclavian vein. The transducer is turned
to image the artery in longitudinal section and
followed proximally toward its origin. The left SA
origin is usually impossible to image, as the vessel
arises from the aortic arch. It can sometimes be
tracked toward its origin with a 2–2.5 MHz phase
array transducer. This type of transducer can also
be useful for imaging the brachiocephalic artery.
Sometimes the origin of the right SA can be diffi-
cult to image, especially if the patient has a large or
short neck. Extra gel may be needed to fill the
depression of the supraclavicular fossa to enable
PERIPHERAL VASCULAR ULTRASOUND
136
Brachial arter
y
Axillar
y
arter
y
Su
p
raclavicular foss
a
C
lavicl
e
S
ubclavia
n
arter
y
Radial arter
y
Ulnar arter
y
Infr
ac
l
a
vi
cu
l
a
r fo
ssa
Figure 10.3 Transducer positions for scanning the
upper extremity arteries.
Chap-10.qxd 29~8~04 14:48 Page 136
good contact with a flat linear array transducer.
The SA should then be followed laterally in longi-
tudinal section, where it will disappear underneath
the clavicle. There will be a large acoustic shadow
below the clavicle (see Fig. 10.12). A mirroring
artifact of the SA is often seen due to the chest wall
beneath the artery (see Fig. 7.7).
The SA reappears from underneath the clavicle
and is followed distally, where it becomes the axillary
artery. Two positions may be used to image the
length of the axillary artery. The first is the anterior
approach, in which the axillary artery will be seen to
run deep beneath the shoulder muscles. A 3.5 MHz
curved array transducer can sometimes be useful for
following the distal axillary artery from this position.
The second approach images the axillary artery
from the axilla (armpit), where it can be followed
distally to the brachial artery.
It is worth noting that the proximal segment of
the internal thoracic artery, a proximal branch
of the SA, can often be imaged. This artery is fre-
quently used in coronary bypass surgery and is sur-
gically grafted to the heart. It divides at a 90° angle
from the inferior aspect of the SA to run down the
chest wall. It is possible to confirm graft patency by
identifying flow in the proximal thoracic artery just
beyond its origin. The flow pattern in the artery
supplying the heart will exhibit an unusual wave-
form shape, as most of the flow occurs in the dias-
tolic phase of the cardiac cycle.
Brachial artery
The brachial artery is followed as a continuation of
the axillary artery along the inner aspect of the arm
to the elbow, where it curves around to the cubital
fossa and lies in a superficial position.
The distal brachial artery is scanned across the
elbow to the point where it divides in the upper
forearm into the radial and ulnar arteries.
Radial and ulnar arteries
The bifurcation of the brachial artery into the radial
and ulnar arteries is easier to locate in a transverse
plane. The two arteries are then followed distally to
the wrist in a longitudinal plane. In its proximal
segment, the ulnar artery runs deep to the radial
artery before becoming more superficial in the mid-
forearm. It is often easier to locate the radial and
ulnar arteries at the wrist and then to follow them
back to the elbow.
DUPLEX ASSESSMENT OF UPPER EXTREMITY ARTERIAL DISEASE
137
SA
AA
DB
UA
I
RA
BA
Figure 10.4 A color flow montage of the left upper
extremity arteries demonstrating the subclavian artery
(SA), axillary artery (AA), brachial artery (BA), deep
brachial artery (DB), radial artery (RA), common
interosseous artery (I) and ulnar artery (UA).
Chap-10.qxd 29~8~04 14:48 Page 137
Palmar arch and digital arteries
Duplex scanning can be used to image the palmar
arch and digital vessels, although continuous wave
Doppler can be considerably quicker and easier to
use for the detection of arterial signals, especially in
the digital arteries. The radial artery is sometimes
used as a graft for coronary artery bypass surgery. It
is possible to listen to the digital arteries and palmar
arch flow signals with continuous wave Doppler,
while the radial artery is being manually compressed,
to ensure that perfusion to the hand and fingers is
being maintained by the ulnar artery. If this is not
the case, removal of the radial artery could result in
hand ischemia.
Commonly encountered problems
Most problems occur due to poor imaging, especially
in large or obese patients, in whom the proximal
arteries may be very difficult to image. In particular,
the SA in the area of the supraclavicular fossa can be
difficult to locate. Color flow imaging can present a
confusing display as there are often strong signals
from the adjacent subclavian vein, which may appear
pulsatile due to the proximity to the right side of
the heart. Imaging of the axillary artery can be dif-
ficult where the artery runs deep under the shoul-
der muscles. Scanning from the axilla or selecting a
lower frequency probe may help.
ULTRASOUND APPEARANCE
Normal appearance
The normal appearance of upper extremity arteries
is the same as that described for the duplex scan-
ning of lower limb arteries (see Ch. 9). The spec-
tral Doppler waveform is normally triphasic at rest
but becomes hyperemic with high diastolic flow
following exercise. Changes in external tempera-
ture can have marked effects on the observed flow
patterns in the distal arteries. There is a cyclical
effect on the appearance of the flow patterns in the
distal arteries related to factors such as body tem-
perature control. This cyclical effect can cause the
waveform shape to change from high-resistance flow
to hyperemic flow over a period of a minute or two
(Fig. 10.5). Peripheral vasodilation will cause a
reduction in peripheral resistance and an increase in
flow. In this situation, the waveform in the radial
and ulnar arteries can become hyperemic. Vasocon-
striction increases peripheral resistance, producing
a reduction in flow, and the waveform becomes
biphasic. The range of normal peak systolic veloci-
ties in the SA has been reported as 80–120 cm/s
(Edwards & Zierler 1992). It is often assumed that
the radial artery is the dominant vessel in the forearm
because it is easier to palpate at the wrist, but in
many cases there is higher flow in the ulnar artery.
Abnormal appearance
In the absence of any specific criteria for grading
upper limb arterial stenoses, we would advocate
the use of the same criteria as for grading lower limb
disease. Therefore, a doubling of the peak systolic
velocity across a stenosis compared with the proxi-
mal normal adjacent segment indicates a у50%
diameter reduction. However, many upper limb
lesions are located at the origin to the SA, making
proximal measurements from the aortic arch or
brachiocephalic artery unreliable or impossible due
to vessel depth, size and geometry. In this situation
the diagnosis is usually made by indirect signs, such
as high-velocity jets, turbulence or post-stenotic
damping (Fig. 10.6). In addition, the ipsilateral
vertebral artery should be examined for evidence
of flow changes, indicated by damping or flow
reversal (see Ch. 8). It can also be very difficult to
visibly identify plaques at the origin to the SA. Occlu-
sions of the proximal SA can be difficult to differ-
entiate from severe stenoses (von Reutern & von
Büdingen 1993), and any uncertainty should be
highlighted in the report. Dissection of the radial,
brachial or axillary arteries can occur due to trauma
of the vessel wall following catheter access. It may
PERIPHERAL VASCULAR ULTRASOUND
138
Figure 10.5 A cyclical change in the appearance of the
blood flow patterns in the radial and ulnar arteries can
be observed, relating to factors such as the control of
body temperature.
Chap-10.qxd 29~8~04 14:48 Page 138
be possible to see flaps, dual lumens or acute
obstruction.
Acute occlusions of upper extremity arteries are
frequently caused by embolization from the heart
and occur most commonly in the brachial, radial
and ulnar arteries. The arterial lumen may appear
relatively clear, but there will be an absence of flow
in the vessel as demonstrated by color flow imag-
ing (Fig. 10.7). Some acute occlusions occur as a
result of embolization from the SA due to damage
caused by TOS.
Large arteriovenous malformations will be imme-
diately obvious with color flow imaging as a region
of high vascularity. Spectral Doppler will demon-
strate low-resistance, high-volume flow waveforms
within the malformation.
THORACIC OUTLET SYNDROME (TOS)
The vascular laboratory is frequently asked to assess
patients with suspected TOS. The thoracic outlet is
the region where the SA and brachial plexus leave
the chest and pass in between the anterior and
middle scalene muscles over the first rib and under-
neath the clavicle (Fig. 10.8). This is a compact
anatomical area, and compression on the nerves or
arteries by a number of mechanisms can produce
sensory symptoms in both the hand and arm.
Compression can occur in three main areas. The first
is at the point where the SA passes between the sca-
lene muscles and can be caused by muscle hypertro-
phy or fibrous bands or may be due to the presence
of an additional accessory rib originating from the
seventh thoracic vertebra, termed a cervical rib
(Fig. 10.9). Accessory ribs occur in less than 1% of
the population (Makhoul & Machleder 1992). The
second area of compression occurs as the artery
runs between the first rib and clavicle. Fibrous bands
or fibrosis due to injuries in this region, such as
fractures of the clavicle, can also cause compres-
sion. The third, less common area of compression
occurs in the subcoracoid region, where the axil-
lary artery runs under the pectoralis minor muscle
and close to the coracoid process of the scapula.
Typically, the vessels and nerves are compressed
when the arm is placed in specific positions. The
symptoms include sensory changes, such as pain,
pins and needles in the hand, hand weakness and
other neurological disorders. TOS can be purely
neurogenic, due to compression of the brachial
plexus alone (this accounts for approximately 90% of
cases). Neurogenic TOS often produces abnormal
nerve conduction recordings and can be associated
DUPLEX ASSESSMENT OF UPPER EXTREMITY ARTERIAL DISEASE
139
Figure 10.6 A severe high-grade stenosis of the
proximal SA (arrow) is demonstrated by marked color flow
disturbance and aliasing, high peak systolic velocity
(389 cm/s), abnormal waveform shape and spectral
broadening.
Figure 10.7 An embolus from the heart has acutely
obstructed the brachial artery at the elbow. The arterial
lumen appears clear, as the embolus has a similar
echogenicity to blood, but there is a sudden cessation
of flow at the start of the occlusion (arrow).
Chap-10.qxd 29~8~04 14:48 Page 139
with muscle weakness and wasting in the lower arm
or hand.
Arterial and venous TOS is less common and
accounts for approximately 10% of cases, although
there is sometimes a combination of neurogenic
and vascular compression. Aneurysmal dilations
of the SA are sometimes seen just distal to the
point of compression due to post-stenotic dilation.
These aneurysms can be the source of distal emboli
in the fingers, which can be the initial presentation
of a patient with TOS. There is still considerable
debate about the assessment and treatment of
TOS, which often involves surgical resection of a
cervical rib and sometimes the first rib, with the
division of any fibrous bands to relieve the com-
pression. Although the majority of patients who
have undergone surgery show improvement in
symptoms, a few show no signs of improvement
and may return to the vascular laboratory for fur-
ther assessment.
Maneuvers for assessing TOS
Continuous wave Doppler recording of the radial
artery signal, performed with the arm in a range of
positions, can be a useful prelude to the duplex
examination (Fig. 10.10). There are a range of
provocation maneuvers that can be used, but the
most common include the following.
Hyperabduction test
The patient should be sitting comfortably, and the
arm should then be slowly extended outward
(abducted). With the arm fully abducted, the fore-
arm is rotated so that the palm faces upward and
the elbow downward (external rotation). The arm
should be raised and lowered in this position and
the patient’s head turned away from the side under
investigation. This test can indicate compression
between the clavicle and first rib or coracoid region.
Costoclavicular maneuver
The patient is asked to push the chest outward
while forcing the shoulders backward with deep
inhalation, the so-called ‘military position’, as this
may reveal arterial compression between the clavi-
cle and first rib.
Deep inspiration maneuver
During deep inspiration the patient is asked to
extend the neck and rotate the head to the affected
side and then to the other side while the pulse is
checked at the wrist. A positive test indicates
PERIPHERAL VASCULAR ULTRASOUND
140
Anterior scalene
muscle
Sternocleido-
mastoid
muscle
Middle scalene
muscle
Thoracic outlet
Brachial plexus
Subclavian artery
Clavicle
1st rib
Sternum
Figure 10.8 The anatomy of the thoracic outlet.
1st rib
Additional cervical rib
Clavicle
Subclavian artery
7th cervical vertebra
1st thoracic
vertebra
Sternum
Figure 10.9 The presence of a cervical rib originating
from the seventh thoracic vertebra can cause compression
of the brachial nerve plexus and subclavian artery.
Chap-10.qxd 29~8~04 14:48 Page 140