Báo cáo y học: "Paradoxical ventilator associated pneumonia incidences among selective digestive decontamination studies versus other studies of mechanically ventilated patients: benchmarking the evidence base" doc
Bạn đang xem bản rút gọn của tài liệu. Xem và tải ngay bản đầy đủ của tài liệu tại đây (545.63 KB, 17 trang )
RESEARCH Open Access
Paradoxical ventilator associated pneumonia
incidences among selective digestive
decontamination studies versus other studies of
mechanically ventilated patients: benchmarking
the evidence base
James C Hurley
1,2
Abstract
Introduction: Selective digestive decontamination (SDD) appears to have a more compelling evidence base than
non-antimicrobial methods for the prevention of ventilator associated pneumonia (VAP). However, the striking
variability in ventilator associated pneumonia-incidence proportion (VAP-IP) among the SDD studies remains
unexplained and a post ulated contextual effect remains untested for.
Methods: Nine reviews were used to source 45 observational (benchmark) groups and 137 component (control
and intervention) groups of studies of SDD and studies of three non-antimicrobial methods of VAP prevention. The
logit VAP-IP data were summarized by meta-analysis using random effects methods and the associated
heterogeneity (tau
2
) was measured. As group level predictors of logit VAP-IP, the mode of VAP diagnosis,
proportion of trauma admissions, the proportion receiving prolonged ventilation and the intervention method
under study were examined in meta-regression models containing the benchmark groups together with either the
control (models 1 to 3) or intervention (models 4 to 6) groups of the prevention studies.
Results: The VAP-IP bench mark derived here is 22.1% (95% confidence in terval; 95% CI; 19.2 to 25.5; tau
2
0.34)
whereas the mean VAP-IP of control groups from studies of SDD and of non-antimicrobial methods, is 35.7 (29.7 to
41.8; tau
2
0.63) versus 20.4 (17.2 to 24.0; tau
2
0.41), respectively (P < 0.001). The disparity between the benchmark
groups and the control groups of the SDD studies, which was most apparent for the highest quality studies, could
not be explained in the meta-regression models after adjusting for various group level factors. The mean VAP-IP
(95% CI) of intervention groups is 16.0 (12.6 to 20.3; tau
2
0.59) and 17.1 (14.2 to 20.3; tau
2
0.35) for SDD studies
versus studies of non-antimicrobial methods, respectively.
Conclusions: The VAP-IP among the intervention groups within the SDD evidence base is less variable and more
similar to the benchmark than among the control groups. These paradoxical observations cannot readily be
explained. The interpretation of the SDD evidence base cannot proceed without further consideration of this
contextual effect.
Correspondence:
1
Rural Health Academic Centre, Melbourne Medical School, The University of
Melbourne, ‘Dunvegan’ 806 Mair St., Ballarat, Victoria 3350, Australia
Full list of author information is available at the end of the article
Hurley Critical Care 2011, 15:R7
/>© 2011 Hurley et al.; licensee BioMed Central Ltd. This is an open access article distributed und er the terms of the Creative Commons
Attribution License ( which permits unrestrict ed use, distribution, and reproduction in
any medium, provided the origin al work is properly cited.
Introduction
Colonization and infection with bacteria occurs com-
monly in patients receiving mechanical ventilation (MV)
[1-5]. The use of selective digestive decontamination
(SDD) is an approach to prevent colonization and pneu-
monia in this patient group [6]. Systematic reviews
of more than 30 controlled studies of SDD provide
compelling evidence of reductions in VAP of >50% [6]
versus marginally significant r eductions of <20% with
non-antibiotic methods of prevention such as those
based on the management of gastric pH [ 7], tracheal
suction [8], or humidification [9].
That SDD could create a contextual effect in the
intensive care unit through cross colonization between
patients of concurrent control and study groups was
postulated in the original 1984 study [10] and others
[11], which were intentionally non-concurrent in design.
Thi s postulate remains untested. Moreover, the VAP-IP
of control groups of SDD studies is highly variable, par-
ticularly among SDD studies with a concurrent design
[12]. To account for this variability and to test the origi-
nal postulate would require an external benchmark of
VAP-IP.
Four recent factors e nable a benchmarking of the
VAP-IP among the component groups of the SDD evi-
dence base. First, five reviews [1-5] have independently
estimated the expected VAP-IP range for observational
groups and enable the derivation of a benchmark. Sec-
ond, the key studies in the evidence base for SDD and
for comparison, three non-antibiotic methods of VAP
prevention, are identified in four lar ge systematic
reviews [ 6-9]. Third, various group level factors, which
may be explanatory toward the VAP incidence, are iden-
tified in all of the studies. Finally, h eterogeneity among
study results can now be measured and incorporated in
the derivation of a prediction range using recently devel-
oped random effects methods of meta-analysis and dis-
played using a caterpillar plot [13,14].
Materials and methods
Overview
There are fo ur objectives here: First, to derive a VAP-IP
benchmark and prediction ra nge derived from observa-
tional (benchmar k) groups. Second, to summarize VAP-
IP separately for t he control and intervention groups
from studies of two broad approaches to VAP preven-
tion that have been included in systematic reviews; stu-
dies of SDD versus studies of non-anti-microbial
methods of VAP prevention. Third, to assess the disper-
sion among the group specific VAP-IP of control groups
and intervention gro ups versus th e VAP-IP be nchmark
using caterpillar plots. Finally, to assess the impact of
group level factors as possible explanatory variables
toward the group specific VAP-IP in meta-regression
models that include both the benchmark and the pre-
vention study groups.
Study selection and component group designations
This analysis is limited to component groups from stu-
dies of patients receiving mechanical ventilation as
abstracted in nine published reviews (four non-systematic
and five systematic) of VAP incidence and specific VAP
prevention methods [1-9]. The unit of analysis here is the
component patient group, whether observational (bench-
mark) [1-5], or control or intervention groups from stu-
dies of various methods of VAP prevention [6-9].
The inclusion criterion for this analysi s was a study of
adult patients receiving prolonged mechanical ventila-
tion in intensive care units (ICUs) for which VAP-IP
and denominator data had been abstracted in one of the
nine reviews [1-9]. The exclusion criteria as specified in
the Cochrane review [6] are applied to achieve harmoni-
zation across the studies obtained from all nine reviews.
That is; studies based on specific pre-selected types of
patients (patients undergoing elective esophageal resec-
tion, cardiac or gastric surgery, liver transplant or suffer-
ing from acute liver failure), studies of non-ICU
populations, populations for which the proportion
receiving MV for >24 hours was <50% and studies for
which VAP-IP data were not available. Also, studies of
pediatric populations, and studies pu blished before 1984
do not appear among the studies abstracted in the
review of Liberati et al. [6] and these study types are
also excluded.
Categories of benchmark and component groups
The benchmark groups are those groups of observa-
tional studies as abstracted in one of five reviews of
VAP incidence [1-5]. Any intervention study abstracted
inoneofthesefivereviewsofVAP-IPincidencewas
not used in the derivation of the benchmark.
The component groups of studies of non-antimicro-
bial methods of VAP prevention are as abstracted in
one of three systematic reviews of various methods o f
gastric acid suppression [7], open versus closed methods
of tracheal suctio n [8], or passive versus active humidifi-
cation [9] as methods of VAP prevention. In the gastric
acid studies, the interventions studied were those that
might suppress gastric acid (for example, ranitidine or
antacid treatment) versus interventi ons that did not (for
example, no treatment or sucralfate) [7]. The designa-
tion of control and inte rvention groups were as indi-
cated in the systematic reviews of open (control) versus
closed (intervention) methods of tracheal suction [8]
and passive (HH, control) versus active (HME, inte rven-
tion) humidification [9]. The component groups from
the studies of SDD are as abstracted in the Cochrane
review [6].
Hurley Critical Care 2011, 15:R7
/>Page 2 of 17
Data extraction
The primary outcome is the VAP-IP, which is the inci-
dence of ventilator associated pneumonia per 100
patients. The VAP-IP and its denominator were taken
for all component groups as abstracted in the review
documents in which they appeared.
Additional information abstracted directly from the
original publication was whether the mode of VAP diag-
nosis required bronchoscopic sampling versus tracheal
sampling methods, whether <90% of patients received at
least 24 hours of mechanical ventilation, and the pro-
portion of patients admitted to the ICU for trauma. The
scoring of study quality was also abstracted from each
systematic review. However, each systematic review used
different quality scoring systems and scoring was not
used in the non-systematic reviews. The indicat or of
highest study quality in this analysis was whether the
study received a majority score in the source systematic
review. Data were extrapolated from tables and
figures if not available in the text. Care was taken to
stratify patient groups appearing across more t han one
publication.
Caterpillar plots
A caterpillar plot is a forest plot-like display of group
speci fic odds and 95% confidence intervals with the stu-
dies listed in rank order of increasing event rate. This
display reveals both the overall symmetry of the indivi-
dual group results and their deviation from the overall
mean. This display shows the impact of group size with
the larger groups, having greater precision, expected to
deviate less from the summary or benchmark.
Statistical methods
The VAP-IP data were converted to logits for analysis as
follows; if D represents the denominator, N represents
the numerator, and R represents the proportion (N/D)
of the VAP-IP, the logit(VAP-IP) is log(N/(D-N)) and its
var iance is 1/(D*R*(1-R)) [15,16]. This variance formula
was used to calculate the group specific 95% confidence
intervals. Using these calculated logits and logit var-
iances, the metan command [17] in STATA (release
11.0, STATA Corp., College Station, TX, USA) gener-
ates summary logits by a random effects method
together with the standard errors (SE) and tau
2
,which
are measures of within and between group variances,
respectively, and the associated 95% CI’s. The metan
command also generates the caterpillar plots of the
group specific logits and 95% CI’s.
The VAP-I P benchmark was derived as the mean logit
VAP-IP and 95% confidence interval derived together
with a 95% prediction interval. The later is calculated
using the metan command as mean ± 1.96 * (SE
2
+
tau
2
)
0.5
[17]. In each of the caterpillar plots, both the
overall VAP-IP mean derived from the groups in the
plot and the 95% prediction interval derived from VAP-
IP benchmark range are displayed.
To test the stability of the benchmark, five replicate
derivations of the VAP-IP benchmark were derived
using the VAP-IP data abstracted from the four non-
systematic and one systematic reviews individually [1-5].
Meta-regression
The calculated logits and logit variances were used with
the metareg command [18] in STATA (release 11.0,
STATA Corp.) to perform meta-regression models that
incorporate group level factors as predictors. There are six
meta-regression models of logit VAP-IP including the
benchmark groups with either the control (models 1 to 3)
or the intervention (models 4 to 6) groups of the prevention
studies. Models 1 and 4 include group membership (bench-
mark, SDD study or non-antimicrob ial method study), as
the only predictors. Models 2 and 5 include three additional
group level properties as predictor variables; whether <90%
of patients in the group received >24 hours of MV, whether
the mode of diagnosis of VAP required bronchoscopic sam-
pling and the proportion of trauma admissions to the ICU.
Models 3 and 6 replicate models 2 and 5 but are limited
to those studies that had received majority quality scores
in the source systematic reviews. Regression coefficients
were compared using the lincom (linear combination) post-
estimation command in STATA.
Sensitivity analysis
Meta-regressions models 2 and 4 were repeated after
exclusion of studies for which the proportion of patients
receiving >24 hours of mechanical v entilation was <90%
or unknown. Also, meta-regressions models 3 and 6
were repeated with component groups from 19 studies
of SDD that had received a quality score of one out of
two included.
Results
There were 45 observational benchmark groups (Addi-
tional file 1) [19-63] and 137 component groups (Addi-
tional files 2 and 3) [64-131] derived from nine reviews
[1-9]. The characteristics of the studies and the groups
are summarized in Table 1. Most studies had b een pub-
lished in the 1990’s. Compared to the benchmark
groups, the component groups of the studies of VAP
prevention methods differed in the following respects;
they had fewer patients per group (P = 0.001), fewer
had bronchoscopic sampling performed for VAP diag-
nosis (P = 0.003) and admissions f or trauma among
them were more frequent (P = 0.01). The studies of
non-antimicrobial methods more often attained majority
quality scores than did studies of SDD in the respective
systematic reviews (P = 0.006).
Hurley Critical Care 2011, 15:R7
/>Page 3 of 17
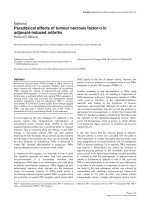
The VAP-IP benchmark derived from all 45 obser va-
tional (benchmark) groups is 22.1% with a 95% confi-
dence interval of 19.0% to 25.5%, and with a 95%
prediction interval of 8.6% to 47.3% (Figure 1). The five
replicate estimates of the benchmark using the abstracted
VAP-IP data from the observational (benchmark) groups
abstracted in each of the four non-systematic and one
systematic reviews were each within five percentage
points of the benchmark derived using the abstracted
VAP-IP data from all 45 observational (benchmark)
groups (Table 2). Among the benchmark groups, there
was no significant trend in VAP-IP versus publication
year (data not shown, P = 0.47). A summary VAP-IP
derived from benchmark groups originating from
European centres and non-Europe an centres were eac h
within two percentage points of the benchmark (Table 2).
ThegroupspecificandsummaryVAP-IP’sforthe
component groups of the preve ntion studies are dis-
played in Figures 2, 3, 4, 5 and the summary VAP-IPs
are tabulated in Table 3. The I
2
associated with the
summary estimates ranged between 74% and 93%. The
distribution of the group specific VAP-IPs of the control
groups of the SDD studies differs in five ways versus the
distribution of the group specific VAP-IPs among the
control groups of the studies of non-antibiotic methods;
the mean and tau
2
are 50% higher (Table 3) and the
interquartile range (IQR) (Table 1) and confidence inter-
vals (Table 3) are both 50% wider. Moreover, the
median VAP-IP (Table 1) of the control gr oups of the
SDD st udies is more than five percent age points higher
than the mean (Table 3), a finding which indicates a
positive skew.
Table 1 Characteristics of studies and component groups
Studies and component groups
Observational (Benchmark) Non-antimicrobial SDD
Studies
Originating review [ref] [1 to 5]
a
[7 to 9]
b
[6]
c
Number of studies
d, e
45 35 33
Bronchoscopic sampling
f
23 5 8
Publication year (IQR)
g
1990 to 2000 1994 to 2000 1991 to 1997
European
h, i
28 19 30
Majority quality score
j, k
NA 16 4
MV for > 24 hours for <90%
l
524
Component groups
Numbers of patients per group; median (IQR)
m, n
264; 83 to 567 54; 29 to 92 57; 33 to 130
Days of ventilation; median (IQR)
o
10.8; 8.0 to 12.8 8.9; 6.7 to 13.4 10.5; 9.0 to 15.0
% trauma patients; median (IQR)
p
12; 2 to 35 15; 10 to 59 34; 18 to 78
VAP - IP; median IQR (n)
Observational (benchmark) 22.0; 15 to 30.8 (45) NA NA
Control 17.5; 12.5 to 28.9 (35) 42; 21.6 to 51(33)
Intervention 15.4; 9.1 to 22.7 (35) 13.3; 7.1 to 24.4 (34)
n, number; NA, not available; IQR, inter-quartile range; SDD, Selective Digestive Decontamination; VAP-IP, ventil ator associated pneumonia incidence proportion.
a
These data were sourced as follows; George, 1993 [1] (Table 1), Cook and Kollef, 1998 [2] (Table 1), Chastre and Fagon, [3] 2002 (Table 1), Bergmans and Bonten,
[4] 2004 (Table 22.5), Safdar et al., [5] 2005 (Table 1).
b
The following systematic reviews were the source for these studies; Messori et al., [ 7] 2000 (Tables 5-7), Subirana et al., [8] 2007 (Table 7), and Siempos et al.,[9]
2007 (Table 2) were the sources for these studies.
c
Liberati et al., [6] 2009 (Analysis 1.5, and 2.5) was the source for these studies.
d
Reasons for benchmark group exclusions; 9 studies of defined patient populations (pediatric, cardio-thoracic surgery, liver transplantation, ARDS), 12 studies with
<50% of patients receiving MV >24 hours, 6 studies published prior to 1983, or 6 intervention studies.
e
Reasons for VAP prevention study exclusions; 2 studies of defined patient populations (cardio-thoracic surgery, liver transplantation), or VAP-IP data not available
(12 studies).
f
Comparison of mode of diagnosis, chis quared test = 13.5, two degrees of freedom P = 0.001.
g
Data is inter-quartile range (IQR).
h
Originating from a member state of the European Union as at 2010 or Switzerland or Norway.
i
Comparison of European origin, benchmark versus prevention studies, chisquared test = 1.4, one degree of freedom P = 0.24.
j
A majority quality score as assessed in the originating systematic reviews which had been scored out of a possible 10 [7], 4 [8], 5 [9] and 2 [6] criteria.
k
Comparison of high quality score, chisquared test = 7.43, one degree of freedom P = 0.006.
l
Number of studies for which the proportion of patients ventilated for >24 hours was <90% or not state d.
m
Data is median and inter-quartile range (IQR).
n
Comparison of group sizes, chisquared test = 34.7, two degrees of freedom P = 0.0001.
o
Comparison of days of ventilation, chisquared test = 1.4, two degrees of freedom P = 0.49.
p
Comparison of percent of trauma patients, chisquared test = 7.5, two degrees of freedom P = 0.02.
Hurley Critical Care 2011, 15:R7
/>Page 4 of 17
The differences in distributions of VAP-IP among the
component groups of the prevention studies are also
apparent in the caterpillar plots (Figures 2, 3, 4, 5) in
that 11 of the 33 control groups of the SDD studies ver-
sus only 3 of the 35 control groups of the non-antibiotic
studies have group specific VAP-IP’s which are above
the benchmark 95% prediction interval. Four of the
control groups with VAP- IP withi n the benchmark pre-
diction range were control groups from SDD studies
that had a duplex design; that is, all control group
patients routinely received systemic antibiotics.
The disparities in summary VAP-IP among the com-
ponent groups of the prevention studies versus the
benchmark remained apparent in analyses limited to the
Figure 1 Caterpillar plot: observational (benchmark) groups and derived benchmark. Caterpillar plot of t he group specific (small
diamonds) VAP-IP and 95% CI of observational benchmark groups together with the summary VAP-IP (dotted green vertical line), 95% CI (large
open diamond) and 95% prediction interval (solid green horizontal line). Note that the x axis is a logit scale. The VAP-IP data is as abstracted in
four non-systematic and one systematic review [1-5].
Hurley Critical Care 2011, 15:R7
/>Page 5 of 17
highest quality studies (Table 3). The mean VAP-IP of
the control groups of highest quality SDD studies were
22 percentage points higher than the benchmark. By
contrast, for all other component groups the summary
VAP-IP’s were within seven percentage points of the
benchmark whether derived from t he highest quality
studies or all studies.
Meta-regression models
Three meta-regression models were performed as
described in the methods to evaluate several group level
properties as predictors of the group specific logit VAP-
IP’s of the control (Ta ble 4) and intervention (Table 5)
groups versus the benchmark groups.
For the control groups versus the benchmark groups
(Table 4; meta-regression models 1 to 3), membership
of a control group of an SDD study was a consistently
positive predictor. For the intervention groups versus
the benchmark groups (Table 5; meta-regression models
4 to 6), membership of an intervention group of an
SDD study was a negativ e predictor of logit VAP-IP but
not consistently significant.
In comparing these factors in the meta-regression
models, mem bership of a control group of an SDD
study differed significantly versus membership of a
control group of a non-antibiotic study in model 1 (P <
0.001), model 2 (P < 0.001) and model 3 (P = 0.003). By
contrast, membership of an intervention group of an
SDD study did not differ significantly versus member-
ship of an intervention groupofanon-antibioticstudy
as a predictor in model 4 (P = 0.7), model 5 (P = 0.6) or
model 6 (P = 0.3).
Meta-regressions models 2 and 4 were repeated after
exclusion of studies for which the proportion of patients
receiving >24 hours of mechanical v entilation was <90%
or unknown. Also, meta-regressions models 3 and 6
were repeated with component groups from 19 studies
of SDD that had received a quality score of one out of
two included. With both of these re-analyses, the find-
ings were replicated (data not shown).
Discussion
The present analysis has identified unexplained and
paradoxical discrepancies among the VAP-IP of control
groups and the intervention groups of SDD studies ver-
sus the benchmark and versus groups of other studies
aggregated from reviews of other methods of VAP pre-
vention. There were several analytic and statistical issues
that needed to be addressed to execute this analysis.
The first analytic issue is the method of study selection.
The objective here was to evaluate the evidence base as
represented within systematic and other reviews. Hence a
new literature search was not undertaken but the analysis
was specifically lim ited to studies identified in nine pub-
lished reviews and to the use of those studies exclusively.
This narrowed focus allows scrutiny of the component
groups that form an entire evidence base [6-9]. The three
systematic reviews of non-antibiotic methods of VAP pre-
vention were chosen b ecause they were the largest available.
The second analytic issue is th e method of abstracting
VAP-IP data. The use of abstracted data from the
reviews rather than from the published studies main-
tains objectivity and facilitates independent verific ation
as all the data is readily identifiable in the reviews. Of
note, the method o f VAP-IP abstraction for the SDD
review [6] was somewhat unique in that these authors
had contacted investigators of the original SDD studies
to obtain ‘intention to treat’ data.Hence,theSDDdata
includes missing data for 25 of the 36 SDD studies with
published data used for the remaining 11 studies. How-
ever, applying the benchmark 95% prediction range to
the VAP-IP data as published in all 33 studies yields
similar discrepancies [12].
The third analytic issue is that the VAP-IP is propor-
tion data arising from groups with varying denomina-
tors. Transformation to logits and weighting by the
inverse variance as a method of adjusting for variable
study s ize are standard methods for analysis of propor-
tion data [15,16].
Table 2 Sources and replicate estimates of VAP-IP
benchmark range
VAP-IP range estimates (%)
Source review, Year Original
a
Re-analysis
b
N Mean; 95% CI N
c
George, 1993 [1]
d
8 to 54 23 23.7; 18.1 to 30.4 11
Cook and Kollef, 1998 [2]
d
13 to 38 8 21.4; 17.5 to 25.7 8
Chastre and Fagon, 2002 [3]
d
8 to 28 10 17.2; 13.4 to 22.1 10
Bergmans and Bonten,
2004 [4]
d
8.6 to 65 15 20.6; 16.1 to 26.1 14
Safdar, et al., 2005 [5]
e
7 to 12.5 28 21.1; 17.9 to 24.4 25
All five reviews [1-5] 22.1; 19.2 to 25.5
f
45
European benchmark
groups [1-5]
21.2; 18.1 to 24.6 28
Non- European benchmark
groups [1-5]
23.9; 19.6 to 28.8 17
VAP-IP, Ventilator associated pneumonia inci dence proportion, N, number of
groups.
a.
The original VAP-IP range and numbers of abstracted studies (N) had been
derived in the source systematic review by the following methods; minimum-
maximum study VAP-IP values [1-3] or mean VAP-IP weighted by study size
[5] or unstated [4].
b. Re-analysis VAP-IP range derived by meta-analysis using the abstracted
VAP-IP data and numbers of eligible abstracted studies (N) from each
systematic review.
c. The number of eligible groups (N) from each systematic review included in
the re-analysis. Note, the column does not tally as some studies were
abstracted in more than one systematic review.
d. Non-systematic review.
e. Systematic review.
f. This is the benchmark range.
Hurley Critical Care 2011, 15:R7
/>Page 6 of 17
The fourth issue is that the studies vary considerably
in the intervention unde r study. It should be noted that
profiling the component g roups of the prevention stu-
dies against the benchmark is the obj ective of the analy-
sis h ere rather than estimating the summary effect size
for the interventions under study. In this regard, the
control groups are of particular interest. If there is no
contextual effect associated with the study of SDD
within an ICU, it would be expected that the control
groups of concurrent design SDD studies would have
Figure 2 Caterpillar plot: control groups of studies of non-antimicrobial methods of VAP prevention . Caterpillar plot of the group
specific (small diamonds) and summary (broken vertical line) VAP-IP and 95% CI (large open diamond) of control groups of studies of non-
antimicrobial methods of VAP prevention. The VAP-IP data is as abstracted in three systematic reviews [7-9]. For comparison, the VAP-IP
benchmark (solid green vertical line) and prediction interval (solid green horizontal line) derived from the benchmark groups from Figure 1 is
also shown. Note that the x axis is a logit scale.
Hurley Critical Care 2011, 15:R7
/>Page 7 of 17
VAP-IP’s similar not only to each other, but to the
benchmark and also to the VAP-IP’s of control groups
of studies of other prevention methods.
The fifth issue is that the quality scores of the studies as
rated in each systematic review varied. Also, different
scales of study quality were used in each of the systematic
reviews. As a consequence, a majority quality score as
rated by each systematic review was used as a unified
rating of highest study quality. Paradoxically, the dispari-
ties in VAP-IP noted here are most apparent in compari-
sons limited to the highest quality studies.
The sixth issue is the heterogeneity (over-dispersion) in
event rates arising from differen t patient populations in
different centres. This is apparent in all of the summary
ranges here in that all have I
2
values above 75% which
indicate high levels of heterogeneity [132]. Heterogeneity
Figure 3 Caterpillar plot: intervention groups of studies of non-antimicrobial methods of VAP prevention. Caterpillar plot of the group
specific (small diamonds) and summary (broken vertical line) VAP-IP and 95% CI (large open diamond) of intervention groups of studies of non-
antimicrobial methods of VAP prevention. The VAP-IP data is as abstracted in three systematic reviews [7-9]. For comparison, the VAP-IP
benchmark (solid green vertical line) and prediction interval (solid green horizontal line) derived from the benchmark groups from Figure 1 is
also shown. Note that the x axis is a logit scale.
Hurley Critical Care 2011, 15:R7
/>Page 8 of 17
has been a major obstacle in the context of profiling
the performance of hospitals and surgeons toward the
identification of individual outlier performers. Adjusting
for patient risk is an important consideration in profiling,
but this is problematic when comparing multiple centres
[133]. It should be noted that identification of individual
outlier performers is not an objective of this analysis
but rather the estimation of the overall VAP-IP range
among the component groups that comprise an entire
evidence base and the identification of group level
Figure 4 Caterpillar plot: control groups of SDD studies. Caterpillar plot of the group specific (small diamonds) and summary (broken
vertical line) VAP-IP and 95% CI (large open diamond) of control groups of SDD studies. Four control groups from duplex studies that is, all
control group patients routinely received systemic antibiotics, are indicated by an asterix next to the author name and NC indicates non-
concurrent. The VAP-IP data is as abstracted in Liberati et al. [6]. For comparison, the VAP-IP benchmark (solid green vertical line) and prediction
interval (solid green horizontal line) derived from the benchmark groups from Figure 1 is also shown. Note that the x axis is a logit scale.
Hurley Critical Care 2011, 15:R7
/>Page 9 of 17
explanatory variables in the meta-regression models of
VAP-IP.
A more recent development in relation to managing
heterogeneity is to measure it using random effects meth-
ods [13,14,13 2]. With random effects methods, both the
variance arising from between groups (heterogeneity,
tau
2
) versus that from within groups (sampling, SE) are
estimated and both types of variability are incorporated
in the calculation of the 95% prediction intervals with as
a result, more conservative (wider) prediction intervals
than would be derived using traditional fixed effects
methods which do not take heterogeneity into account.
Figure 5 Caterpillar plot: intervention groups of SDD studie s. Caterpillar plot of the group specific (small diamonds) and summary (broke n
vertical line) VAP-IP and 95% CI (large open diamond) of intervention groups of SDD studies. The VAP-IP data is as abstracted in Liberati et al.
[6]. For comparison, the VAP-IP benchmark (solid green vertical line) and prediction interval (solid green horizontal line) derived from the
benchmark groups from Figure 1 is also shown. Note that the x axis is a logit scale.
Hurley Critical Care 2011, 15:R7
/>Page 10 of 17
There were 19 different topical SDD intervention regi-
mens studied. The most common regimen used in the
studies included here was a topical combination of poly-
myxin, tobramycin and amphotericin together with, for
13 o f the SDD intervention groups, a parenteral antibio-
tic [134]. Given the heterogeneity in the SDD treat-
ments, surprisingly the IQR (Table 1) was wider and the
tau
2
(Table 3) was higher for the control groups of the
SDD studies than for the corr esponding inte rvention
groups and also versus the control and intervention
groups of studies of three different types of non-antibio-
tic prevention methods. These are paradoxical findings.
The seventh issue is observer bias and the lack of an
objective gold standard for VAP. In part this issue relates
to study design and the blinding of observers and adequate
concealment of group allocation, factors t hat have been
assessed as part of the study quality ratings used in each of
the systematic reviews. More particularly, lack of an
Table 3 Study quality and summary estimates of VAP-IP
Strata of groups All studies Highest quality studies
a
Mean; 95% CI N SE tau
2
Mean; 95% CI N SE tau
2
Observational (benchmark) groups 22.1; 19.2 to 25.5 45 0.09 0.34 22.1; 19.2 to 25.5 45 0.09 0.34
Studies of VAP prevention using non-antimicrobial methods
Control groups 20.4; 17.2 to 24.0 35 0.13 0.41 18.4; 14.9 to 22.3 16 0.16 0.24
Intervention groups 17.1; 14.2 to 20.3 35 0.13 0.35 15.3; 12.6 to 18.7 16 0.13 0.16
Studies of methods of VAP prevention using SDD
Control groups 35.7; 29.7 to 41.8 33 0.15 0.63 44.7; 31.1 to 59.3
b
4 0.39 0.52
Intervention groups 16.0; 12.6 to 20.3 34 0.16 0.59 18.5; 9.9 to 32.1
c
4 0.53 0.90
CI, confidence interval; N, number; SE, Standard error; SDD, Selective Digestive Decontamination; VAP, Ventilator associated pneumonia.
a. The study quality scoring was as defined in the source systematic reviews. The highest quality sc ore is a majority quality score as a ssessed in the originating
systematic reviews wh ich had been scored out of a possible 10 [7], 4 [8], 5 [9] and 2 [6] criteria. Benchmark groups had not been rated with a quality score in
the review sources and for this analysis are considered to be of equal quality.
b. Summary estimates derived for 24 control groups of SDD studies which had a high quality score (1 out of 2) was 34.8; 28.7 to 58.5 (se = 0.15, tau
2
= 0.43).
c. Summary estimates derived for 25 intervention groups of SDD studies which had a high quality score (1 out of 2) was 17.9; 13.8 to 23.1 (se = 0.18, tau
2
= 0.60).
Table 4 Meta-regression models 1-3: benchmark and control groups
Meta-regression analysis of logit VAP-IP
Factor Coefficient
a
95% confidence interval P
Simple model (model 1; all studies)
Benchmark groups (reference group) -1.26 -1.47 to -1.05 <0.001
Non-antimicrobial series -0.10 -0.44 to +0.24 0.56
SDD series +0.67 +0.34 to +1.00 <0.001
Full model (model 2; all studies)
Benchmark groups (reference group) -1.07 -1.37 to -0.77 <0.001
Non-antimicrobial series -0.38 -0.74 to -0.03 0.04
SDD series +0.48 +0.16 to +0.81 0.004
Mode of diagnosis
b
-0.38 -0.68 to -0.08 0.01
Proportion trauma admissions
c
+0.30 -0.10 to +0.70 0.14
<90% ventilated patients
d
-0.41 -0.88 to +0.06 0.09
Full model (model 3; highest quality studies)
Benchmark groups (reference group) -0.98 -1.27 to -0.66 <0.001
Non-antimicrobial series -0.35 -0.75 to +0.06 0.09
SDD series +0.82 +0.14 to +1.50 0.019
Mode of diagnosis
b
-0.38 -0.72 to -0.04 0.03
Proportion trauma admissions
c
-0.13 -0.58 to +0.33 0.58
<90% ventilated patients
d
-0.31 -0.83 to +0.22 0.24
SDD, Selective Digestive Decontamination; VAP-IP, Ventilator associat ed pneumonia incidence proportion.
a. Interpretation. The benchmark groups in each mode l form the reference group and the size of this coefficient equals the difference in logits from 0 (a logit
equal to 0 equates to a proportion of 50%; a logit equal to -1.26 equates to a proportion of 22.1%). The other coefficients in each model represent the additional
difference in logits for groups positive for that factor versus the reference group.
b. For diagnosis using bronchoscopic versus tracheal based sampling.
c. Per 100% of admissions being for trauma.
d. For studies for which <90% of patients received >24 hours of mechanical ventilation.
Hurley Critical Care 2011, 15:R7
/>Page 11 of 17
objective gold standard is an important issue in the case of
VAP for which there are several definitions in use, with
those that require bronchoscopic based sampling being
possibly a more specific but less sensitive diagnostic stan-
dard [135].
Additional to this is that some of the studies included
patients who were not ventilated, which is problematic
for the diagnosis of VAP. Also, the proportio n of
patients admitted for trauma, used here as a surrogate
for the patient mix, ranged between 0% and 100%
among the studies. These issues in V AP diagnosis have
been identi fied as group level factors in meta-regression
models 2, 3, 5 and 6.
Limitations of this analysis
There are several limitations of this analysis. The ran-
dom effects method of analysis presumes that the
groups in each summation are representative of a ‘ran-
dom’ selection of an undefinable super-population of
groups. The VAP-IP benchmark derived here may only
be representative of patient groups as found within sys-
tematic reviews.
Only nine reviews were used in this analysis and other
smal ler reviews have not been included. However, other
reviews applicable to this patient group can be tested
against the 95% prediction range derived from the
benchmark groups here. For example, systematic reviews
of kinetic b ed [136] therapy and topical chlohexidene
[137] as methods for the preventi on of VAP had identi-
fied 10 and 7 studies respectively. Of the 17 studies
identified in these two systematic reviews, only two stu-
dies, one from each systematic review, had a control
group with a VAP-IP above 47.3%, the upper 95% limit
of the prediction range derived from the benchmark
groups here, whe reas three had an intervention group
VAP-IP below the lower 95% limit of the prediction
range derived from the benchmark groups.
Also, studies of SDD which had a non-concurrent
design have not been included in the meta-regression.
This would help to test the postulated contextual effect
of SDD. Among the SDD studies included here, three
have a third non-concurrent control group arm in addi-
tion to the two concurrent arms [101,104,131]. The
VAP-IP of all three of these non-concurrent control
groups is less than 24% [12].
A further limitation was that the number of group
level factors that could be explored was limited by those
that were readily available and identified for all the
groups in the analysis. Origin from a European country
and year of publication were tested and found not to be
Table 5 Meta-regression models 4-6: benchmark and intervention groups
Meta-regression analysis of logit VAP-IP
Factor Coefficient
a
95% confidence interval P
Simple model (model 4; all studies)
Benchmark groups (reference group) -1.26 -1.46 to -1.06 <0.001
Non-antimicrobial series -0.32 -0.64 to -0.01 0.054
SDD series -0.37 -0.70 to -0.03 0.03
Full model (model 5; all studies)
Benchmark groups (reference group) -1.19 -1.50 to -0.89 <0.001
Non-antimicrobial series -0.46 -0.84 to -0.08 0.019
SDD series -0.54 -0.88 to -0.18 0.003
Mode of diagnosis
b
-0.19 -0.50 to +0.13 0.24
Proportion trauma admissions
c
+0.34 -0.07 to +0.76 0.11
<90% ventilated patients
d
-0.30 -0.77 to +0.17 0.21
Full model (model 6; highest quality studies)
Benchmark groups (reference group) -1.05 -1.36 to -0.74 <0.001
Non-antimicrobial series -0.57 -0.99 to -0.16 0.008
SDD series -0.35 -1.09 to +0.39 0.34
Mode of diagnosis
b
-0.30 -0.64 to +0.04 0.08
Proportion trauma admissions
c
-0.06 -0.52 to +0.41 0.81
<90% ventilated patients
d
-0.11 -0.60 to +0.38 0.67
SDD, Selective Digestive Decontamination; VAP-IP, Ventilator associat ed pneumonia incidence proportion.
a. Interpretation. The benchmark groups in each mode l form the reference group and the size of this coefficient equals the difference in logits from 0 (a logit
equal to 0 equates to a proportion of 50%; a logit equal to -1.26 equates to a proportion of 22.1%). The other coefficients in each model represent the additional
difference in logits for groups positive for that factor versus the reference group.
b. For diagnosis using bronchoscopic versus tracheal based sampling.
c. Per 100% of admissions being for trauma.
d. For studies for which <90% of patients received >24 hours of mechanical ventilation.
Hurley Critical Care 2011, 15:R7
/>Page 12 of 17
significant in preliminary analyses (data not shown).
Other factors such as the prevalence of antibiotic use
have not been explored beyond that accounted for by
duplex study design. Also the duration of mechanical
ventilation has not been considered b eyond the group
average, which appeared to be similar across the strata
(Table 1). The appropriate investigation of t hese factors
would require patient level data to control for the possi-
ble influence of ecological bias [138].
Ther e are three possible interpretations of these para-
doxical findings. First, publication and citation bias need
to be considered. Deriving t he benchmark f rom four
non-sys tematic and one systemat ic reviews was done to
test th e stability of the benchmark estimate (Table 2). In
replications of the benchmark range fro m these five
reviews separately this varies by no more than five per-
centage points.
Given that 11 of the 33 control groups from studies of
SDD are above the upper limit of the 95% prediction
range of the benchmark where only 2.5% of the distribu-
tion would be predicted to be found, this could be taken
to indicate a deficit of 407 groups below the upper limit
of the 95% prediction range of the benchmark {407 =
(11 * 97.5/2.5)- 22)}. This estimate corresponds to an
earlier test for publication bias using a funnel plot
method which indicated a deficit of >500 ‘inlier’ groups
with VAP-IP < 45% from studies of SDD that had been
unpublished or were otherwise ‘missing’ [12].
A second interpretation is that the possible impacts of
unmeasured and unknown patient level risk factors for
VAP-IP have not been evaluated in this analysis. How-
ever, for such a risk factor to account for the discrepan-
cies between the VAP-IP of the cont rol groups of SDD
studies versus the benchmark groups is unlikely. Such
putative risk factors would need to be consistently
strong across the range of studies and yet have a pro-
foundly uneven distributionbetweentheSDDstudies
versus other studies. This is in contrast to the inconsis-
tent strength and direction of the known VAP risk fac-
tors [2,3].
For example, duration of mechanical ventilation is the
strongest patient level risk factor for VAP with increases
of approximately 2 per 100 patients per day of ventila-
tion during the second week of ventilation [139]. The
discrepanc ies in VAP-IP noted here between the control
groups of SDD studies versus the benchmark would
equate to a differenc e in mean duration of ventilation
across all groups of 6.8 days.
A third interpretation is a possible contextual effect of
SDD. The possibility of c ontextual effects due to cross
colonization and infection within the ICU environment
resulting from SDD use as was postulated in the original
study of SDD [10] needs to be considered [140]. SDD is
known to alter the colonization among recipients
[141,142]. However, identifying cross colonization within
a single study is difficult. A major limitation toward
testing this postulate is that colonization pressure [143]
and cross colonization, two crucial intermediary steps,
have not been measured in any of these studies.
Conclusions
The VAP-IP among control groups of SDD studies is
more variable and the mean is >50% greater than other
groups within the evidence base including the VAP
benchmark. These paradoxical findings cannot be
accounted for through group level adjustments for
proportion of trauma admiss ions, mode of VAP diagno-
sis and proportion of patients receiving prolonged
ventilation.
Apart f rom major publication bias, or the effect of a
major and as yet unidentified and mal-distributed
patient level VAP risk factor, or the effect of in-apparent
outbreaks [140], these paradoxical discrepancies cannot
be explained. The interpretation of the studie s of SDD
treatments cannot proceed without further consideration
that SDD may have a contextual effect as originally pos-
tulated [10].
Key messages
• A VAP-IP benchmark derived from 45 observa-
tional (benchmark) groups of mechanically ventilated
patients is 22.1%.
• The mean VAP-IP of 35 control groups from stu-
dies of three non-antimicrobial methods of VAP pre-
vention versus 33 control groups of studies of SDD
are, respectively, within 2 percentage points of versus
more than 13 percentage points higher than the
benchmark.
• By contrast, the mean VAP-IP of 35 intervention
groups studies of non-antimicrobial meth ods versus
34 SDD in terventi on groups are each within six per-
centage points of the benchmark.
• The paradoxical findings are most apparent in
comparisons limited to the highest quality studies.
• These observations cannot readily be accounted for
with adjustments for group level factors such as pro-
portion of trauma admissions, mode of diagnosis
and study quality.
Additional material
Additional file 1: VAP-IP data for benchmark groups.
Additional file 2: VAP-IP data for component groups of studies of
non-antibiotic methods of VAP prevention.
Additional file 3: VAP-IP data for component groups of studies of
SDD.
Hurley Critical Care 2011, 15:R7
/>Page 13 of 17
Abbreviations
CI: confidence interval; ICU: Intensive Care Unit; IQR: interquartile range; MV:
mechanical ventilation; SDD: selective digestive decontamination; SE:
standard error; VAP: Ventilator associated pneumonia; VAP-IP: VAP-Incidence
proportion.
Author details
1
Rural Health Academic Centre, Melbourne Medical School, The University of
Melbourne, ‘Dunvegan’ 806 Mair St., Ballarat, Victoria 3350, Australia.
2
Infection Control Committees, Ballarat Health Services and St John of God
Hospital, Ballarat, and Physician, Division of Internal Medicine, Ballarat Health
Services, 101 Drummond St., N, Ballarat, 3350, Victoria, Australia.
Authors’ contributions
JH produced the design of the study, performed the statistical analysis,
wrote the manuscript and read and approved the final manuscript.
Competing interests
The author declares that he has no competing interests.
Received: 28 June 2010 Revised: 18 October 2010
Accepted: 7 January 2011 Published: 7 January 2011
References
1. George DL: Epidemiology of nosocomial ventilator-associated
pneumonia. Infect Control Hosp Epidemiol 1993, 14:163-169.
2. Cook DJ, Kollef MH: Risk factors for ICU-acquired pneumonia. JAMA 1998,
279:1605-1606.
3. Chastre J, Fagon JY: Ventilator-associated pneumonia. Am J Respir Crit Care
Med 2002, 165:867-903.
4. Bergmans DCJJ, Bonten MJM: Nosocomial pneumonia. In Hospital
Epidemiology and Infection Control. 3 edition. Edited by: Mayhall CG.
Philadelphia: Lippincott Williams 2004:311-339.
5. Safdar N, Dezfulian C, Collard HR, Saint S: Clinical and economic
consequences of ventilator-associated pneumonia: a systematic review.
Crit Care Med 2005, 33:2184-2193.
6. Liberati A, D’Amico R, Pifferi S, Torri V, Brazzi L, Parmelli E: Antibiotic
prophylaxis to reduce respiratory tract infections and mortality in adults
receiving intensive care (Review). Cochrane Database Syst Rev 2009,
CD000022.
7. Messori A, Trippoli S, Vaiani M, Gorini M, Corrado A: Bleeding and
pneumonia in intensive care patients given ranitidine and sucralfate for
prevention of stress ulcer: meta-analysis of randomised controlled trials.
BMJ 2000, 321:1103-1106.
8. Subirana M, Solà I, Benito S: Closed tracheal suction systems versus open
tracheal suction systems for mechanically ventilated adult patients.
Cochrane Database Syst Rev 2007, CD004581.
9. Siempos II, Vardakas KZ, Kopterides P, Falagas ME: Impact of passive
humidification on clinical outcomes of mechanically ventilated patients:
a meta-analysis of randomized controlled trials. Crit Care Med 2007,
35:2843-2851.
10. Stoutenbeek CP, van Saene HK, Miranda DR, Zandstra DF: The effect of
selective decontamination of the digestive tract on colonisation and
infection rate in multiple trauma patients. Intensive Care Med 1984,
10:185-192.
11. de Smet AMGA, Kluytmans JAJW, Cooper BS, Mascini EM, Benus RFJ, van
der Werf TS, van der Hoeven JG, Pickkers P, Bogaers-Hofman D, van der
Meer NJ, Bernards AT, Kuijper EJ, Joore JC, Leverstein-van Hall MA,
Bindels AJ, Jansz AR, Wesselink RM, de Jongh BM, Dennesen PJ, van
Asselt GJ, te Velde LF, Frenay IH, Kaasjager K, Bosch FH, van Iterson M,
Thijsen SF, Kluge GH, Pauw W, de Vries JW, Kaan JA, et al:
Decontamination of the digestive tract and oropharynx in ICU patients.
NEJM 2009, 360:20-31.
12. Hurley JC: Profound effect of study design factors on ventilator-
associated pneumonia incidence of prevention studies: benchmarking
the literature experience. J Antimicrob Chemother 2008, 61:1154-1161.
13. Higgins JP, Thompson SG, Spiegelhalter DJ: A re-evaluation of random-
effects meta-analysis. J R Stat Soc Ser A Stat Soc 2009, 172:137-159.
14. Spiegelhalter DJ: Handling over-dispersion of performance indicators.
Qual Saf Health Care 2005, 14:347-351.
15. Agresti A: Categorical Data Analysis. 2 edition. Hoboken: Wiley Interscience;
2002.
16. Greenland S, O’Rourke
K: Meta-analysis. In Modern Epidemiology 3 edition.
Edited by: Rothman KJ, Greenland S, Lash TL. Philadelphia: Lippincott,
Williams and Wilkins; 2008:652-682.
17. Harris RJ, Bradburn MJ, Deeks JJ, Harbord RM, Altmamn DG, Sterne JA:
Metan: fixed and random effects-meta-analysis. Stata J 2008, 8:3-28.
18. Harbord RM, Higgins JP: Meta-regression in Stata. Stata J 2008, 8:493-519.
19. Akca O, Koltka K, Uzel S, Cakar N, Pembeci K, Sayan MA, Tutuncu AS,
Karakas SE, Calangu S, Ozkan T, Esen F, Telci L, Sessler DI, Akpir K: Risk
factors for early-onset, ventilator-associated pneumonia in critical care
patients: selected multiresistant versus nonresistant bacteria.
Anesthesiology 2000, 93:638-645.
20. Apostolopoulou E, Bakakos P, Katostaras T, Gregorakos L: Incidence and
risk factors for ventilator-associated pneumonia in 4 multidisciplinary
intensive care units in Athens, Greece. Respir Care 2003, 48:681-688.
21. Baker AM, Meredith JW, Haponik EF: Pneumonia in intubated trauma
patients. Microbiology and outcomes. Am J Respir Crit Care Med 1996,
153:343-349.
22. Baraibar J, Correa H, Mariscal D, Gallego M, Valles J, Rello J: Risk factors for
infection by Acinetobacter baumannii in intubated patients with
nosocomial pneumonia. Chest 1997, 112:1050-1054.
23. Beck-Sague CM, Sinkowitz RL, Chinn RY, Vargo J, Kaler W, Jarvis WR: Risk
factors for ventilator-associated pneumonia in surgical intensive-care-
unit patients. Infect Control Hosp Epidemiol 1996, 17:374-376.
24. Bercault N, Boulain T: Mortality rate attributable to ventilator-associated
nosocomial pneumonia in an adult intensive care unit: a prospective
case-control study. Crit Care Med 2001, 29:2303-2309.
25. Bochicchio GV, Joshi M, Bochicchio K, Shih D, Meyer W, Scalea TM: A time-
dependent analysis of intensive care unit pneumonia in trauma
patients. J Trauma 2004, 56:296-301.
26. Bonten MJ, Gaillard CA, van Tiel FH, Smeets HG, van der Geest S,
Stobberingh EE: The stomach is not a source for colonization of the
upper respiratory tract and pneumonia in ICU patients. Chest 1994,
105:878-884.
27. Braun SR, Levin AB, Clark KL: Role of corticosteroids in the development
of pneumonia in mechanically ventilated head-trauma victims. Crit Care
Med 1986, 14 :198-201.
28. Craven DE, Kunches LM, Kilinsky V, Lichtenberg DA, Make BJ, McCabe WR:
Risk factors for pneumonia and fatality in patients receiving continuous
mechanical ventilation. Am Rev Respir Dis 1986, 133:792-796.
29. Daschner F, Kappstein I, Schuster F, Scholz R, Bauer E, Joossens D, Just H:
Influence of disposable (’Conchapak’) and reusable humidifying systems
on the incidence of ventilation pneumonia. J
Hosp Infect 1988,
11:161-168.
30. Daumal F, Colpart E, Manoury B, Mariani M, Daumal M: Changing heat and
moisture exchangers every 48 hours does not increase the incidence of
nosocomial pneumonia. Infect Control Hosp Epidemiol 1999, 20:347-349.
31. de Latorre FJ, Pont T, Ferrer A, Rossello J, Palomar M, Planas M: Pattern of
tracheal colonization during mechanical ventilation. Am J Respir Crit Care
Med 1995, 152:1028-1033.
32. Eggimann P, Hugonnet S, Sax H, Touveneau S, Chevrolet JC, Pittet D:
Ventilator-associated pneumonia: caveats for benchmarking. Intensive
Care Med 2003, 29:2086-2089.
33. Elatrous S, Boukef R, Ouanes Besbes L, Marghli S, Nooman S, Nouira S,
Abroug F: Diagnosis of ventilator-associated pneumonia: agreement
between quantitative cultures of endotracheal aspiration and plugged
telescoping catheter. Intensive Care Med 2004, 30:853-858.
34. Fagon JY, Chastre J, Domart Y, Trouillet JL, Pierre J, Darne C, Gibert C:
Nosocomial pneumonia in patients receiving continuous mechanical
ventilation. Prospective analysis of 52 episodes with use of a protected
specimen brush and quantitative culture techniques. Am Rev Respir Dis
1989, 139:877-884.
35. Fagon JY, Chastre J, Vuagnat A, Trouillet JL, Novara A, Gibert C: Nosocomial
pneumonia and mortality among patients in intensive care units. JAMA
1996, 275:866-869.
36. Garrouste-Orgeas M, Chevret S, Arlet G, Marie O, Rouveau M, Popoff N,
Schlemmer B: Oropharyngeal or gastric colonization and nosocomial
pneumonia in adult intensive care unit patients. A prospective study
based on genomic DNA analysis. Am J Respir Crit Care Med 1997,
156:1647-1656.
Hurley Critical Care 2011, 15:R7
/>Page 14 of 17
37. Ibrahim EH, Ward S, Sherman G, Kollef MH: A comparative analysis of
patients with early-onset vs late-onset nosocomial pneumonia in the
ICU setting. Chest 2000, 117:1434-1442.
38. Ibrahim EH, Tracy L, Hill C, Fraser VJ, Kollef MH: The occurrence of
ventilator-associated pneumonia in a community hospital: risk factors
and clinical outcomes. Chest 2001, 120:555-561.
39. Jacobs S, Chang RW, Lee B, Bartlett FW: Continuous enteral feeding: a
major cause of pneumonia among ventilated intensive care unit
patients. JPEN J Parenter Enteral Nutr 1990, 14:353-356.
40. Jimenez P, Torres A, Rodriguez-Roisin R, de la Bellacasa JP, Aznar R,
Gatell JM, Agusti-Vidal A: Incidence and etiology of pneumonia acquired
during mechanical ventilation. Crit Care Med 1989, 17 :882-885.
41. Kanafani ZA, Kara L, Hayek S, Kanj SS: Ventilator-associated pneumonia at
a tertiary-care center in a developing country: incidence, microbiology,
and susceptibility patterns of isolated microorganisms. Infect Control
Hosp Epidemiol 2003, 24:864-869.
42. Kappstein I, Schulgen G, Beyer U, Geiger K, Schumacher M, Daschner FD:
Prolongation of hospital stay and extra costs due to ventilator-
associated pneumonia in an intensive care unit. Eur J Clin Microbiol Infect
Dis 1992, 11:504-508.
43. Kingston GW, Phang PT, Leathley MJ: Increased incidence of nosocomial
pneumonia in mechanically ventilated patients with subclinical
aspiration. Am J Surg 1991, 161:589-592.
44. Kollef MH: Ventilator-associated pneumonia. A multivariate analysis. JAMA
1993, 270:1965-1970.
45. Kollef MH, Silver P, Murphy DM, Trovillion E: The effect of late-onset
ventilator-associated pneumonia in determining patient mortality. Chest
1995, 108:1655-1662.
46. Kollef MH, Von Harz B, Prentice D, Shapiro SD, Silver P, St John R,
Trovillion E: Patient transport from intensive care increases the risk of
developing ventilator-associated pneumonia. Chest 1997, 112:765-773.
47. Langer M, Mosconi P, Cigada M, Mandelli M: Long-term respiratory
support and risk of pneumonia in critically ill patients. Intensive Care
Unit Group of Infection Control. Am Rev Respir Dis 1989, 140:302-305.
48. Mauritz W, Graninger W, Schindler I, Karner J, Zadrobilek E, Sporn P:
[Pathogenic flora in the gastric juice and bronchial secretion of long-
term ventilated intensive-care patients]. Anaesthesist 1985, 34:203-207.
49. Memish ZA, Cunningham G, Oni GA, Djazmati W: The incidence and risk
factors of ventilator-associated pneumonia in a Riyadh hospital. Infect
Control Hosp Epidemiol 2000, 21:271-273.
50. Moine P, Timsit JF, De Lassence A, Troche G, Fosse JP, Alberti C, Cohen Y:
Mortality associated with late-onset pneumonia in the intensive care
unit: results of a multi-center cohort study. Intensive Care Med 2002,
28:154-163.
51. Papazian L, Bregeon F, Thirion X, Gregoire R, Saux P, Denis JP, Perin G,
Charrel
J, Dumon JF, Affray JP, Gouin F: Effect of ventilator-associated
pneumonia on mortality and morbidity. Am J Respir Crit Care Med 1996,
154:91-97.
52. Rashkin MC, Davis T: Acute complications of endotracheal intubation.
Relationship to reintubation, route, urgency, and duration. Chest 1986,
89:165-167.
53. Rello J, Quintana E, Ausina V, Castella J, Luquin M, Net A, Prats G:
Incidence, etiology, and outcome of nosocomial pneumonia in
mechanically ventilated patients. Chest 1991, 100:439-444.
54. Rello J, Ausina V, Ricart M, Puzo C, Net A, Prats G: Nosocomial respiratory
tract infections in multiple trauma patients. Influence of level of
consciousness with implications for therapy. Chest 1992, 102:525-529.
55. Rello J, Ausina V, Ricart M, Puzo C, Quintana E, Net A, Prats G: Risk factors
for infection by Pseudomonas aeruginosa in patients with ventilator-
associated pneumonia. Intensive Care Med 1994, 20:193-198.
56. Rello J, Sonora R, Jubert P, Artigas A, Rue M, Valles J: Pneumonia in
intubated patients: role of respiratory airway. Care. Am J Respir Crit Care
Med 1996, 154:111-115.
57. Rodriguez JL, Gibbons KJ, Bitzer LG, Dechert RE, Steinberg SM, Flint LM:
Pneumonia: incidence, risk factors, and outcome in injured patients. J
Trauma 1991, 31:907-912.
58. Ruiz-Santana S, Garcia Jimenez A, Esteban A, Guerra L, Alvarez B, Corcia S,
Gudin J, Martinez A, Quintana E, Armengol S, et al: ICU pneumonias: a
multi-institutional study. Crit Care Med 1987, 15:930-932.
59. Salata RA, Lederman MM, Shlaes DM, Jacobs MR, Eckstein E, Tweardy D,
Toossi Z, Chmielewski R, Marino J, King CH, et al: Diagnosis of nosocomial
pneumonia in intubated, intensive care unit patients. Am Rev Respir Dis
1987, 135:426-432.
60. Sofianou DC, Constandinidis TC, Yannacou M, Anastasiou H, Sofianos E: Analysis
of risk factors for ventilator-associated pneumonia in a multidisciplinary
intensive care unit. Eur J Clin Microbiol Infect Dis 2000, 19:460-463.
61. Tejada Artigas A, Bello Dronda S, Chacon Valles E, Munoz Marco J,
Villuendas Uson MC, Figueras P, Suarez FJ, Hernandez A: Risk factors for
nosocomial pneumonia in critically ill trauma patients. Crit Care Med
2001, 29:304-309.
62. Timsit JF, Chevret S, Valcke J, Misset B, Renaud B, Goldstein FW, Vaury P,
Carlet J: Mortality of nosocomial pneumonia in ventilated patients:
influence of diagnostic tools. Am J Respir Crit Care Med 1996, 154:116-123.
63. Torres A, Aznar R, Gatell JM, Jimenez P, Gonzalez J, Ferrer A, Celis R, Rodriguez-
Roisin R: Incidence, risk, and prognosis factors of nosocomial pneumonia in
mechanically ventilated patients. Am Rev Respir Dis 1990,
142:5
23-528.
64. Adams DH, Hughes M, Elliott TS: Microbial colonization of closed-system
suction catheters used in liver transplant patients. Intensive Crit Care Nurs
1997, 13:72-76.
65. Ben-Menachem T, Fogel R, Patel RV, Touchette M, Zarowitz BJ, Hadzijahic N,
Divine G, Verter J, Bresalier RS: Prophylaxis for stress-related gastric
hemorrhage in the medical intensive care unit. A randomized,
controlled, single-blind study. Ann Intern Med 1994, 121:568-575.
66. Boots RJ, George N, Faoagali JL, Druery J, Dean K, Heller RF: Double-heater-
wire circuits and heat-and-moisture exchangers and the risk of
ventilator-associated pneumonia. Crit Care Med 2006, 34:687-693.
67. Boots RJ, Howe S, George N, Harris FM, Faoagali J: Clinical utility of
hygroscopic heat and moisture exchangers in intensive care patients.
Crit Care Med 1997, 25:1707-1712.
68. Branson RD, Davis K Jr, Brown R: Comparison of three humidification
techniques during mechanical ventilation: Patient selection, cost, and
infection considerations. Respir Care 1996, 41:809-816.
69. Combes P, Fauvage B, Oleyer C: Nosocomial pneumonia in mechanically
ventilated patients, a prospective randomised evaluation of the
Stericath closed suctioning system. Intensive Care Med 2000, 26:878-882.
70. Conrad SA, Gabrielli A, Margolis B, Quartin A, Hata JS, Frank WO, Bagin RG,
Rock JA, Hepburn B, Laine L: Randomized, double-blind comparison of
immediate-release omeprazole oral suspension versus intravenous
cimetidine for the prevention of upper gastrointestinal bleeding in
critically ill patients. Crit Care Med 2005, 33:760-765.
71. Cook D, Guyatt G, Marshall J, Leasa D, Fuller H, Hall R, Peters S, Rutledge F,
Griffith L, McLellan A, et al: A comparison of sucralfate and ranitidine for
the prevention of upper gastrointestinal bleeding in patients requiring
mechanical ventilation. Canadian Critical Care Trials Group. N Engl J Med
1998, 338:791-797.
72. Deppe SA, Kelly JW, Thoi LL, Chudy JH, Longfield RN, Ducey JP, Truwit CL,
Antopol MR: Incidence of colonization, nosocomial pneumonia, and
mortality in critically ill patients using a Trach Care closed-suction
system versus an open-suction system: prospective, randomized study.
Crit Care Med 1990, 18:1389-1393.
73. Dreyfuss D, Djedaini K, Gros I, Mier L, Le Bourdelles G, Cohen Y,
Estagnasie P, Coste F, Boussougant Y: Mechanical ventilation with heated
humidifiers or heat and moisture exchangers: effects on patient
colonization and incidence of nosocomial pneumonia. Am J Respir Crit
Care Med 1995, 151:986-992.
74. Eddleston JM, Vohra A, Scott P, Tooth JA, Pearson RC, McCloy RF,
Morton AK, Doran BH: A comparison of the frequency of stress ulceration
and secondary pneumonia in sucralfate- or ranitidine-treated intensive
care unit patients. Crit Care Med 1991, 19:1491-1496.
75. Eddleston JM, Pearson RC, Holland J, Tooth JA, Vohra A, Doran BH:
Prospective endoscopic study of stress erosions and ulcers in critically ill
adult patients treated with either sucralfate or placebo. Crit Care Med
1994, 22:1949-1954.
76. Hanisch EW, Encke A, Naujoks F, Windolf J: A randomized, double-blind
trial for stress ulcer prophylaxis shows no evidence of increased
pneumonia.
Am J Surg 1998, 176:453-457.
77.
Hurni JM, Feihl F, Lazor R, Leuenberger P, Perret C: Safety of combined
heat and moisture exchanger filters in long-term mechanical ventilation.
Chest 1997, 111:686-691.
78. Johnson KL, Kearney PA, Johnson SB, Niblett JB, MacMillan NL, McClain RE:
Closed versus open endotracheal suctioning: costs and physiologic
consequences. Crit Care Med 1994, 22:658-666.
Hurley Critical Care 2011, 15:R7
/>Page 15 of 17
79. Kirton OC, DeHaven B, Morgan J, Morejon O, Civetta J: A prospective,
randomized comparison of an in-line heat moisture exchange filter and
heated wire humidifiers: rates of ventilator-associated early-onset
(community-acquired) or late-onset (hospital-acquired) pneumonia and
incidence of endotracheal tube occlusion. Chest 1997, 112:1055-1059.
80. Kollef MH, Shapiro SD, Boyd V, Silver P, Von Harz B, Trovillion E, Prentice D:
A randomized clinical trial comparing an extended-use hygroscopic
condenser humidifier with heated-water humidification in mechanically
ventilated patients. Chest 1998, 113:759-767.
81. Lacherade JC, Auburtin M, Cerf C, Van de Louw A, Soufir L, Rebufat Y,
Rezaiguia S, Ricard JD, Lellouche F, Brun-Buisson C, et al: Impact of
humidification systems on ventilator-associated pneumonia: a
randomized multicenter trial. Am J Respir Crit Care Med 2005,
172:1276-1282.
82. Laggner AN, Lenz K, Base W, Druml W, Schneeweiss B, Grimm G:
Prevention of upper gastrointestinal bleeding in long-term ventilated
patients. Sucralfate versus ranitidine. Am J Med 1989, 86:81-84.
83. Lorente L, Lecuona M, Martin MM, Garcia C, Mora ML, Sierra A: Ventilator-
associated pneumonia using a closed versus an open tracheal suction
system. Crit Care Med 2005, 33:115-119.
84. Lorente L, Lecuona M, Jimenez A, Mora ML, Sierra A: Tracheal suction by
closed system without daily change versus open system. Intensive Care
Med 2006, 32 :538-544.
85. Lorente L, Lecuona M, Jimenez A, Mora ML, Sierra A: Ventilator-associated
pneumonia using a heated humidifier or a heat and moisture
exchanger: a randomized controlled trial [ISRCTN88724583]. Crit Care
2006, 10:R116.
86. Martin C, Perrin G, Gevaudan MJ, Saux P, Gouin F: Heat and moisture
exchangers and vaporizing humidifiers in the intensive care unit. Chest
1990, 97:144-149.
87. Memish ZA, Oni GA, Djazmati W, Cunningham G, Mah MW: A randomized
clinical trial to compare the effects of a heat and moisture exchanger
with a heated humidifying system on the occurrence rate of ventilator-
associated pneumonia. Am J Infect Control 2001, 29:301-305.
88. Metz CA, Livingston DH, Smith JS, Larson GM, Wilson TH: Impact of
multiple risk factors and ranitidine prophylaxis on the development of
stress-related upper gastrointestinal bleeding: a prospective, multicenter,
double-blind, randomized trial. The Ranitidine Head Injury Study Group.
Crit Care Med 1993, 21:1844-1849.
89. Mustafa NA, Akturk G, Ozen I, Koksal I, Erciyes N, Solak M: Acute stress
bleeding prophylaxis with sucralfate versus ranitidine and incidence of
secondary pneumonia in intensive care unit patients. Intensive Care Med
1995, 21:287.
90. O’Keefe GE, Gentilello LM, Maier RV: Incidence of infectious complications
associated with the use of histamine2-receptor antagonists in critically
ill trauma patients. Ann Surg 1998, 227:120-125.
91. Pickworth KK, Falcone RE, Hoogeboom JE, Santanello SA: Occurrence of
nosocomial pneumonia in mechanically ventilated trauma patients: a
comparison of sucralfate and ranitidine. Crit Care Med 1993, 21:1856-1862.
92. Prod’hom G, Leuenberger P, Koerfer J, Blum A, Chiolero R, Schaller MD,
Perret C, Spinnler O, Blondel J, Siegrist H, et
al: Nosocomial pneumonia in
mechanically ventilated patients receiving antacid, ranitidine, or
sucralfate as prophylaxis for stress ulcer. A randomized controlled trial.
Ann Intern Med 1994, 120:653-662.
93. Rabitsch W, Kostler WJ, Fiebiger W, Dielacher C, Losert H, Sherif C,
Staudinger T, Seper E, Koller W, Daxbock F, et al: Closed suctioning system
reduces cross-contamination between bronchial system and gastric
juices. Anesth Analg 2004, 99:886-892.
94. Roustan JP, Kienlen J, Aubas P, Aubas S, du Cailar J: Comparison of
hydrophobic heat and moisture exchangers with heated humidifier during
prolonged mechanical ventilation. Intensive Care Med 1992, 18:97-100.
95. Thomason MH, Payseur ES, Hakenewerth AM, Norton HJ, Mehta B,
Reeves TR, Moore-Swartz MW, Robbins PI: Nosocomial pneumonia in
ventilated trauma patients during stress ulcer prophylaxis with
sucralfate, antacid, and ranitidine. J Trauma 1996, 41:503-508.
96. Topeli A, Harmanci A, Cetinkaya Y, Akdeniz S, Unal S: Comparison of the
effect of closed versus open endotracheal suction systems on the
development of ventilator-associated pneumonia. J Hosp Infect 2004,
58:14-19.
97. Welte T, Ziesing S, Schulte S, Wagner TO: Incidence of ventilator
associated pneumonia in mechnaically ventilated pateints: a comparison
of closed versus open endotracheal suctioning [abstract]. Eur Respir J
1997, 10:319.
98. Zeitoun SS, de Barros AL, Diccini S: A prospective, randomized study of
ventilator-associated pneumonia in patients using a closed vs. open
suction system. J Clin Nurs 2003, 12:484-489.
99. Abele-Horn M, Dauber A, Bauernfeind A, Russwurm W, Seyfarth-Metzger I,
Gleich P, Ruckdeschel G: Decrease in nosocomial pneumonia in
ventilated patients by selective oropharyngeal decontamination (SOD).
Intensive Care Med 1997, 23:187-195.
100. Aerdts SJ, van Dalen R, Clasener HA, Festen J, van Lier HJ, Vollaard EJ:
Antibiotic prophylaxis of respiratory tract infection in mechanically
ventilated patients. A prospective, blinded, randomized trial of the
effect of a novel regimen. Chest 1991, 100:783-791.
101. Bergmans DC, Bonten MJ, Gaillard CA, Paling JC, van der Geest S, van
Tiel FH, Beysens AJ, de Leeuw PW, Stobberingh EE: Prevention of
ventilator-associated pneumonia by oral decontamination: a
prospective, randomized, double-blind, placebo-controlled study. Am J
Respir Crit Care Med 2001, 164:382-388.
102. Blair P, Rowlands BJ, Lowry K, Webb H, Armstrong P, Smilie J: Selective
decontamination of the digestive tract: a stratified, randomized,
prospective study in a mixed intensive care unit. Surgery 1991,
110:303-309.
103. Boland JP, Sadler DL, Stewart W, Wood DJ, Zerick W, Snodgrass KR:
Reduction of nosocomial respiratory tract infections in the multiple
trauma patients requiring mechanical ventilation by selective parenteral
and enteral antisepsis regimen (SPEAR) in the intensive care. XVII
International Congress of Chemotherapy: 1991 Berlin; 1991.
104. Brun-Buisson C, Legrand P, Rauss A, Richard C, Montravers F, Besbes M,
Meakins JL, Soussy CJ, Lemaire F: Intestinal decontamination for control
of nosocomial multiresistant gram-negative bacilli. Study of an outbreak
in an intensive care unit. Ann Intern Med
1989, 110:873-881.
105.
Camus C, Bellissant E, Sebille V, Perrotin D, Garo B, Legras A, Renault A, Le
Corre P, Donnio PY, Gacouin A, et al: Prevention of acquired infections in
intubated patients with the combination of two decontamination
regimens. Crit Care Med 2005, 33:307-314.
106. Cockerill FR, Muller SR, Anhalt JP, Marsh HM, Farnell MB, Mucha P,
Gillespie DJ, Ilstrup DM, Larson-Keller JJ, Thompson RL: Prevention of
infection in critically ill patients by selective decontamination of the
digestive tract. Ann Intern Med 1992, 117:545-553.
107. Ferrer M, Torres A, Gonzalez J, Puig de la Bellacasa J, el-Ebiary M, Roca M,
Gatell JM, Rodriguez-Roisin R: Utility of selective digestive
decontamination in mechanically ventilated patients. Ann Intern Med
1994, 120:389-395.
108. Finch RG, Tomlinson P, Holliday M, Sole K, Stack KC, Rocker G: Selective
decontamination of the digestive tract (SDD) in the prevention of
secondary sepsis in a medical/surgical intensive care unit [abstract].
Seventeenth international congress of chemotherapy, Berlin; 1991, 0471.
109. Gastinne H, Wolff M, Delatour F, Faurisson F, Chevret S: A controlled trial in
intensive care units of selective decontamination of the digestive tract
with nonabsorbable antibiotics. The French Study Group on Selective
Decontamination of the Digestive Tract. N Engl J Med 1992, 326:594-599.
110. Georges B, Mazerolles M, Decun JF, Rouge P, Pomies S, Cougot P:
Décontamination digestive sélective résultats d’une étude chez le
polytraumatisé. Réanimation Soins Intensifs Médecin d’Urgence 1994,
3:621-627.
111. Hammond JM, Potgieter PD, Saunders GL, Forder AA: Double-blind study
of selective decontamination of the digestive tract in intensive care.
Lancet 1992, 340:5-9.
112. Jacobs S, Foweraker JE, Roberts SE: Effectiveness of selective
decontamination of the digestive tract (SDD) in an ICU with a policy
encouraging a low gastric pH. Clin Intens Care 1992, 3:52-58.
113. Kerver AJ, Rommes JH, Mevissen-Verhage EA, Hulstaert PF, Vos A, Verhoef J,
Wittebol P: Prevention of colonization and infection in critically ill
patients: a prospective randomized study. Crit Care Med 1988,
16:1087-1093.
114. Korinek AM, Laisne MJ, Nicolas MH, Raskine L, Deroin V, Sanson-Lepors MJ:
Selective decontamination of the digestive tract in neurosurgical
intensive care unit patients: a double-blind, randomized, placebo-
controlled study. Crit Care Med 1993, 21:1466-1473.
115. Krueger WA, Lenhart FP, Neeser G, Ruckdeschel G, Schreckhase H,
Eissner HJ, Forst H, Eckart J, Peter K, Unertl KE: Influence of combined
Hurley Critical Care 2011, 15:R7
/>Page 16 of 17
intravenous and topical antibiotic prophylaxis on the incidence of
infections, organ dysfunctions, and mortality in critically ill surgical
patients: a prospective, stratified, randomized, double-blind, placebo-
controlled clinical trial. Am J Respir Crit Care Med 2002, 166:1029-1037.
116. Laggner AN, Tryba M, Georgopoulos A, Lenz K, Grimm G, Graninger W,
Schneeweiss B, Druml W: Oropharyngeal decontamination with
gentamicin for long-term ventilated patients on stress ulcer prophylaxis
with sucralfate? Wien Klin Wochenschr 1994, 106:15-19.
117. Lingnau W, Berger J, Javorsky F, Fille M, Allerberger F, Benzer H: Changing
bacterial ecology during a five-year period of selective intestinal
decontamination. J Hosp Infect 1998, 39:195-206.
118. Palomar M, Alvarez-Lerma F, Jorda R, Bermejo B, Catalan Study Group of
Nosocomial Pneumonia Prevention: Prevention of nosocomial infection in
mechanically ventilated patients: selective digestive decontamination
versus sucralfate. Clin Intens Care 1997, 8:228-235.
119. Pneumatikos I, Koulouras V, Nathanail C, Goe D, Nakos G: Selective
decontamination of subglottic area in mechanically ventilated patients
with multiple Trauma. Intensive Care Med 2002, 28:432-437.
120. Pugin J, Auckenthaler R, Lew DP, Suter PM: Oropharyngeal
decontamination decreases incidence of ventilator-associated
pneumonia. A randomized, placebo-controlled, double-blind clinical trial.
JAMA 1991, 265:2704-2710.
121. Quinio B, Albanese J, Bues-Charbit M, Viviand X, Martin C: Selective
decontamination of the digestive tract in multiple trauma patients. A
prospective double-blind, randomized, placebo-controlled study. Chest
1996, 109:765-772.
122. Rocha LA, Martin MJ, Pita S, Paz J, Seco C, Margusino L, Villanueva R,
Duran MT: Prevention of nosocomial infection in critically ill patients by
selective decontamination of the digestive tract. A randomized, double
blind, placebo-controlled study. Intensive Care Med 1992, 18:398-404.
123. Rodriguez-Roldan JM, Altuna-Cuesta A, Lopez A, Carrillo A, Garcia J, Leon J,
Martinez-Pellus AJ: Prevention of nosocomial lung infection in ventilated
patients: use of an antimicrobial pharyngeal nonabsorbable paste. Crit
Care Med 1990, 18:1239-1242.
124. Sanchez Garcia M, Cambronero Galache JA, Lopez Diaz J, Cerda Cerda E,
Rubio Blasco J, Gomez Aguinaga MA, Nunez Reiz A, Rogero Marin S, Onoro
Canaveral JJ, Sacristan del Castillo JA: Effectiveness and cost of selective
decontamination of the digestive tract in critically ill intubated patients.
A randomized, double-blind, placebo-controlled, multicenter trial. Am J
Respir Crit Care Med 1998, 158:908-916.
125. Stoutenbeek CP, van Saene HKF, Zandstra DF: Prevention of multiple
organ failure by selective decontamination of the digestive tract in
multiple trauma patients. In The Immune Consequences of Shock, Trauma
and Sepsis. Volume 2. Edited by: Faist E, Baue AE, Schildberg FW. Lengerich:
Pabst Science; 1996:1055-1066.
126. Stoutenbeek CP, van Saene HK, Miranda DR, Zandstra DF: The effect of
selective decontamination of the digestive tract on mortality in multiple
trauma patients: a multicenter randomized controlled trial. Intensive Care
Med 2007, 33 :261-270.
127. Ulrich C, Harinck-de Weerd JE, Bakker NC, Jacz K, Doornbos L, de Ridder VA:
Selective decontamination of the digestive tract with norfloxacin in the
prevention of ICU-acquired infections: a prospective randomized study.
Intensive Care Med 1989, 15:424-431.
128. Unertl K, Ruckdeschel G, Selbmann HK, Jensen U, Forst H, Lenhart FP,
Peter K: Prevention of colonization and respiratory infections in long-
term ventilated patients by local antimicrobial prophylaxis. Intensive Care
Med 1987, 13 :106-113.
129. Verwaest C, Verhaegen J, Ferdinande P, Schetz M, Van den Berghe G,
Verbist L, Lauwers P: Randomized, controlled trial of selective digestive
decontamination in 600 mechanically ventilated patients in a
multidisciplinary intensive care unit. Crit Care Med 1997, 25:63-71.
130. Wiener J, Itokazu G, Nathan C, Kabins SA, Weinstein RA: A randomized,
double-blind, placebo-controlled trial of selective digestive
decontamination in a medical-surgical intensive care unit. Clin Infect Dis
1995, 20:861-867.
131. Winter R, Humphreys H, Pick A, MacGowan AP, Willatts SM, Speller DC:
A controlled trial of selective decontamination of the digestive tract in
intensive care and its effect on nosocomial infection. J Antimicrob
Chemother 1992, 30:73-87.
132. Higgins JP, Thompson SG, Deeks JJ, Altman DG: Measuring inconsistency
in meta-analyses. BMJ 2003, 327:557-560.
133. Iezzoni LI: The risks of risk adjustment. JAMA 1997, 278:1600-1607.
134. Hurley JC: Prophylaxis with enteral antibiotics in ventilated patients:
selective decontamination or selective cross-infection? Antimicrob Agents
Chemother 1995, 39:941-947.
135. Morris AC, Kefala K, Simpson AJ, Wilkinson TS, Everingham K, Kerslake D,
Raby S, Laurenson IF, Swann DG, Walsh TS: Evaluation of the effect of
diagnostic methodology on the reported incidence of ventilator-
associated pneumonia. Thorax 2009, 64:516-522.
136. Delaney A, Gray H, Laupland KB, Zuege DJ: Kinetic bed therapy to prevent
nosocomial pneumonia in mechanically ventilated patients: a systematic
review and meta-analysis. Crit Care 2006, 10:R70.
137. Chlebicki MP, Safdar N: Topical chlorhexidine for prevention of ventilator-
associated pneumonia: a meta-analysis. Crit Care Med 2007, 35:595-602.
138. Hurley JC: Individual patient data meta-analysis in intensive care
medicine and contextual effects. Intensive Care Med 2010, 36:903-904.
139. Cook DJ, Walter SD, Cook RJ, Griffith LE, Guyatt GH, Leasa D, Jaeschke RZ,
Brun-Buisson C, for the Canadian Critical Care Trails Group: Incidence of
and risk factors for ventilator-associated pneumonia in critically ill
patients. Ann Intern Med 1998, 129:433-440.
140. Hurley JC: Inapparent outbreaks of ventilator-associated pneumonia: an
ecologic analysis of prevention and cohort studies. Infect Control Hosp
Epidemiol 2005, 26:374-390.
141. Ebner W, Kropec-Hubner A, Daschner FD: Bacterial resistance and
overgrowth due to selective decontamination of the digestive tract.
Eur
J Clin Microbiol Infect Dis 2000, 19:243-247.
142. Saunders GL, Hammond JM, Potgieter PD, Plumb HA, Forder AA:
Microbiological surveillance during selective decontamination of the
digestive tract (SDD). J Antimicrob Chemother 1994, 34:529-544.
143. Merrer J, Santoli F, Appere de Vecchi C, Tran B, De Jonghe B, Outin H:
“Colonization pressure” and risk of acquisition of methicillin-resistant
Staphylococcus aureus in a medical intensive care unit. Infect Control
Hosp Epidemiol 2000, 21:718-723.
doi:10.1186/cc9406
Cite this article as: Hurley: Paradoxical ventilator associated pneumonia
incidences among selective digestive decontamination studies versus
other studies of mechanically ventilated patients: benchmarking the
evidence base. Critical Care 2011 15:R7.
Submit your next manuscript to BioMed Central
and take full advantage of:
• Convenient online submission
• Thorough peer review
• No space constraints or color figure charges
• Immediate publication on acceptance
• Inclusion in PubMed, CAS, Scopus and Google Scholar
• Research which is freely available for redistribution
Submit your manuscript at
www.biomedcentral.com/submit
Hurley Critical Care 2011, 15:R7
/>Page 17 of 17