Báo cáo y học: " Endothelial Computed tomographic assessment of lung weights in trauma patients with early posttraumatic lung dysfunction" potx
Bạn đang xem bản rút gọn của tài liệu. Xem và tải ngay bản đầy đủ của tài liệu tại đây (346.47 KB, 10 trang )
RESEARCH Open Access
Computed tomographic assessment of lung
weights in trauma patients with early
posttraumatic lung dysfunction
Andreas W Reske
1*†
, Alexander P Reske
2†
, Till Heine
3
, Peter M Spieth
2
, Anna Rau
1
, Matthias Seiwerts
4
,
Harald Busse
4
, Udo Gottschaldt
1
, Dierk Schreiter
5
, Silvia Born
6
, Marcelo Gama de Abreu
2
, Christoph Josten
3
,
Hermann Wrigge
1
, Marcelo BP Amato
7
Abstract
Introduction: Quantitative computed tomography (qCT)-based assessment of total lung weight (M
lung
) has the
potential to differentiate atelectasis from consolidation and could thus provide valuable information for managing
trauma patients fulfilling commonly used criteria for acute lung injury (ALI). We hypothesized that qCT would
identify atelectasis as a frequent mimic of early posttraumatic ALI.
Methods: In this prospective observational study, M
lung
was calcula ted by qCT in 78 mechanically ventilated
trauma patients fulfilling the ALI criteria at admission. A reference interval for M
lung
was derived from 74 trauma
patients with morphologically and functionally normal lungs (reference). Results are given as medians with
interquartile ranges.
Results: The ratio of arterial partial pressure of oxygen to the fraction of inspired oxygen was 560 (506 to 616)
mmHg in reference patients and 169 (95 to 240) mmHg in ALI patients. The median reference M
lung
value was 885
(771 to 973) g, and the reference interval for M
lung
was 584 to 1164 g, which matched that of previous reports.
Despite the significantly greater median M
lung
value (1088 (862 to 1,342) g) in the ALI group, 46 (59%) ALI patients
had M
lung
values within the reference interval and thus most likely had atelectasis. In only 17 patients (22%), M
lung
was increased to the range previously reported for ALI patients and compatible with lung consolidation.
Statistically significant differences between atelectasis and consolidation patients were found for age, Lung Injury
Score, Glasgow Coma Scale score, total lung volume, mass of the nonaerated lung compartment, ventilator-free
days and intensive care unit-free days.
Conclusions: Atelectasis is a frequent cause of early posttraumatic lung dysfunction. Differentiation between
atelectasis and consolidation from other causes of lung damage by using qCT may help to identify patients who
could benefit from management strategies such as damag e control surgery and lung-protective mechanical
ventilation that focus on the prevention of pulmonary complications.
Introduction
Trauma patients may be affected by several conditions
predisposing them to acute lung injury (ALI) and fre-
quently fulfill all criter ia for ALI pro posed by the Amer-
ican-European Consensus Conference on Acute
Respiratory Distress Syndrome (AECC) [1]. However,
concerns have been raised that these ALI criteria (acute
onset, presence of a typical risk factor, arterial partial
pressure of oxygen to fraction of inspired oxygen ratio
(PaO
2
/FiO
2
) less than 300 mmHg, absence of heart fail-
ure and bilateral infiltrates visualized on chest X- rays)
capture a heterogeneous group of patients and may be
nonspecific, particularly in trauma patients [2-4]. The
appropriateness of ventilatory management of trauma
patients based solely on these criteria has also been
questioned [4,5].
* Correspondence:
† Contributed equally
1
Department of Anesthesiology and Intensive Care Medicine, University
Hospital Leipzig, Liebigstrasse 20, D-04103 Leipzig, Germany
Full list of author information is available at the end of the article
Reske et al. Critical Care 2011, 15:R71
/>© 2011 Reske et al.; licensee B ioMed Central Ltd. This is an open access article distributed under the terms of the Creative Commons
Attribution Lice nse (http://c reativecommons.org/licenses/by/2.0), which permits unrestricted use, distribution, and reproduction in
any medium, provided the original work is properly cited.
Computed tomography (CT) has a higher sensitivity
than radiographs for detecting lung parenchymal
changes [6,7]. Nevertheless, the visual confirmation of
bilate ral pulmonary infiltrates by CT instead of chest X-
rays is not supported by the current ALI definition and
carries the risk of detecting pulmona ry opacifications
with limited clinical relevance [1,6]. Despite this limita-
tion, quantitative CT (qCT) analysis enables the unique
noninvasive assessment of total lung weight (M
lung
)and
can be used to distinguish different causes of early post-
traumatic pulmonary opacification and thus different
populations of ALI patients [2,8-14].
If a patient has pulmonary opacifications on qCT but
has a normal M
lung
, atelectasis due to hypoventilation,
the use of anesthetics and high inspiratory oxygen con-
centrations would be the most likely explanation for
impaired oxygenation [15]. If a significantly increased
M
lung
suggests consolidation from a more significant
lung injury (for example, hemorrhage, contusion or
edema from capillary leakage) [10-13], a focus on the
prevention of secondary lung injury, such as by perform-
ing damage control surgery and implementin g lung-pro -
tective mechanical ventilation, would appear appropriate
[3,4,16-19]. Atelectasis mimicking ALI instead may war-
rant more aggressive ventilatory management and early
definitive surgical management [4,5,20-24].
In this study, we aimed to u se qCT t o (1) establish a refer-
ence interval for M
lung
of mechanically ventilated trauma
patients w ith morphologically and functionally normal lungs
and ( 2) study M
lung
in trauma patients who fulfilled t he ALI
criteria. W e h ypothesized t hat qCT would identify atelectasis
as a frequen t mimic of early posttraumatic ALI. In t he future,
this information could aid in managing patients with early
posttraumatic lung d ysfunction.
Materials and methods
Data for this prospective observational study were col-
lected during routine clinical management at the Uni-
versity Hospital Leipzig. The study was approved by the
ethics committee of the University of Leipzig (approval
numbers 202/2003 and 311/2007). The need for
informed consent was waived because no interventions
or additional patient manipulations were required.
Our study consisted of two parts (Figure 1). First, we
analyzed the M
lung
of trauma patients with normal lungs
to establish a reference interval (reference group). Sec-
ond, M
lung
values were assessed in patients with early
posttraumatic ALI. A small subset of qCT data used in
the present study were analyzed in a previous noninter-
ventional study [25].
Reference group
Trauma patients with morphologically and functionally
normal lungs who underwent emergency CT were
divided into spontaneously breathing (reference sponta-
neous) and mechanically ventilated (reference ventilated)
patients (Figure 1 and Table 1). Patients with pneu-
mothorax, pleural fluid or opacification s other than
small, localized dorsal atelectasis were not included. The
decision whether a lung was normal was based on the
consensus of one radiologist and two intensivists. If data
were available, the PaO
2
/FiO
2
ratio had to be greater
than 400 mmHg.
ALI group
Trauma patients were eligible for the ALI group if they
had undergone CT within 24 hours posttrauma, fulfilled
the clinical criteria for ALI (that is, acute onset, typical
trigger, absence of heart failure and PaO
2
/FiO
2
ratio
below 300 mmHg) at admission and CT showed bilat-
eral pulmonary opacifications (Figure 1) [1].
Physiological and demographic data were obtained
from the patient data management system into which
these data had been prospectively and automatically
entered. The ventilator-free days and the intensive care
unit (ICU)-free days were calculated as the number of
days without mechanical ventilation or ICU treatment,
respectively, within a period o f 28 days [26]. The Lung
Injury Score (LIS), the Injury Severity Score (ISS), the
Abbrevia ted Injury Scale of the Thorax (AIS-T) and the
Thoracic Trauma Severity Score (TTSS) were calculated
at the time of admission [27-29]. The Glasgow Coma
Scale (GCS) score at the trauma scene and the a mount
of intravenous fluids administered prior to CT were cal-
culated on the basis of the ambulance report form.
Pressure-controlled mechanical ventilation (reference
ventilated and ALI) during primary resuscitation and
CT was standardized and included the following ventila-
tor settings (Oxylog 3000; Dräger, Lübeck, Germany):
target tidal volume of 6 ml/kg estimated body weight
(estimated weight in kilograms equals height in centi-
meters minus 100), respiratory rate of 20 breaths min
-1
and positive end-expiratory pressure of 10 cmH
2
O
[21,30].
CT scanning
Each CT scan was requested by the treating physicians
as routine diag nostic procedure in emergency trauma
patients [21,31]. Depending on availability, two m ulti-
slice CT scanners were used, either a Somatom Volume
Zoom (120-kV tube voltage, 165-mA tube current, 4 ×
2.5-mm collimation; Siemen s, Erlangen, Germany ) or a
Philips MX8000 IDT 16 (120-kV tube voltage, 170-mA
tube current, 16 × 1.5-mm collimation; Philips Medical
Systems, Hamburg, Germany). As part of routine clinical
imaging, contiguous images were reconstructed with
either 10-mm slice thickness and the enhancing filter
“B60f” on the Siemens scanner or 5-mm thickness and
Reske et al. Critical Care 2011, 15:R71
/>Page 2 of 10
the standard filter “B” on the Philips scanner. Intrave-
nous with contrast material (120 ml of iopamidol 300;
Schering, Berlin, Germany) was used as part of the clini-
cal protocol in all patients. Because of the observation al
study design, the degree of inspirati on during CT could
not be controlled: Reference spontaneous patients were
asked to hold their breath after inspiration (without
checking for compliance) during CT. Reference venti-
lated and ALI patients were scanned du ring uninter-
rupted mechanical ve ntilation, which is current clinical
practice in our institution. Calibration of the CT scan-
ners was performed using air and the manufacturer’s
standard phantom.
Quantitative CT analysis
The lung parenchyma was segmented manually in CT
images covering the entire lungs (Osiris software; Uni-
versity Hospital Geneva, Geneva, Switzerland) [25].
Window levels and widths appropriate for the lung par-
enchyma (-500/1,500 HU) or the mediastinum (50/250
HU) were used. Major hilar v essels and bronchi, pneu-
mothoraces, pleural fluids and gross motion artefacts
were manually excluded. Only in aerated lung regions
did we use a threshold (-350 HU)-based segmentation
technique in an attempt to guide and standa rdize the
manual exclusion of partial volume effects close to the
thoracic wall, mediastinum, heart or diaphragm. T o do
so, window level and width were set to (-350/0 HU),
and the segmentation line was drawn at the black-white
interface [32-34]. Opacified lung regions were segmen-
ted manually using anatomical landmarks.
The total lung volume (V
lung
), the total lung mass
(M
lung
) and the masses of differe ntly aerated lung com-
partments were calculated voxel-by-voxel using custo-
mized software as previously described [9,10,12,25,35].
M
lung
and V
lung
values were calculated on the basis of
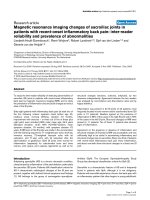
Figure 1 Flowchart illustrating group assignmen t. RIS/PACS, Radiology Information System and Picture Archiving and Communication
Systems of the Department of Radiology. CT, computed tomography; PaO
2
/FiO
2
, ratio of arterial partial pressure of oxygen to fraction of inspired
oxygen; reference spontaneous group, spontaneously breathing trauma patients with normal lung morphology on CT; reference ventilated
group, mechanically ventilated trauma patients with normal lung morphology; ALI group, mechanically ventilated trauma patients fulfilling the
criteria for acute lung injury (ALI) as defined by the American-European consensus conference (AECC) on acute respiratory distress syndrome [1].
Ø, exclusion criteria.
Reske et al. Critical Care 2011, 15:R71
/>Page 3 of 10
all lung voxels within the -1,000 to +100 HU range. The
following HU ranges were used to separate differently
aerated lung compartments: nonaerated, -100 to +100
HU; poorly aerated, -101 to -500 HU; normally aerated,
-501 to -900 HU; and hyperaerated, -901 to -1,000 HU.
The masses of dif ferently aerated lung compartments
were calculated as percentages of M
lung
. Although it was
calculated, we omitted between-group comparison of
the hyperaerated compartment because two different
CT scanners and image reconstruction protocols were
used, and such comparison was not required for the
present study [30].
The validity of our analytical method was reviewed in
27 patients by placing a water-filled plastic bottle next
to the thorax. We then selected an arbitrary region of
interest (ROI) within this bottle in the CT image and
compared the weight resulting from our voxel-by-voxel
analysis method with that obtained by simply multiply-
ing the volume of interest (ROI area × slice thickness)
by the volumetric mass densit y of water (approximately
997.77 kg/m
3
at 22°C).
Statistical analysis
Data are given as medians with interquartile ranges
unless specified otherwise. According to Clinical and
Laboratory Standards Institute guide line C28-A3 [36],
the 95% reference interval of M
lung
was calculated using
the robust method because the number of reference
subjects was smaller than 120 [3 6,37]. Results were
compared between subgroups using the Mann-Whitney
U test or the Kruskal -Wallis test. Confidence intervals
(95% CI) for normal M
lung
reported in previous studies
were calculated [38]. Analysis of variance (ANOVA) was
used to compare the M
lung
values from these previous
studies with our reference patients (Shapiro-Wilk test
indicated normal distribution). Linear regression analysis
was used to calculate coefficients and 95% CIs for the
correlation of body height and weight with M
lung
.The
effect of adjusting for sex, age and group regarding the
relationship between M
lung
and body height was tested
by entering these variable s into the regression model. It
was defined apriorithat only variables explaining ≥5%
ofthevarianceinM
lung
values would be kept in the
final mo del. Bland-Altman plots were used to compare
the ROI weights used for validation of our voxel-by-
voxelanalyticalmethod[39].Alltestsweretwo-sided.
Statistical significance was assumed if P < 0.05. Statisti-
cal analyses were performed using SPSS 12.0 software
(SPSS, Inc., Chicago, IL, USA) and MedCalc software
(MedCalc Software, Mariakerke, Belgium).
Results
Reference patients
We analyzed 74 trauma patients with morphologically
and functionally normal lungs. Reference ventilated
patients were more frequently male, more severely
Table 1 Demographic data
a
Patient demographics ALI Reference ventilated Reference spontaneous
Number of patients 78 43 31
Median age
ns
42 (23 to 51) 27 (21 to 45) 32 (22 to 44)
Sex (male/female)
b
61/17 37/6 19/12
Median height
b
, cm 176 (173 to 180) 175 (170 to 183) 174 (168 to 183)
Median weight
b
, kg 80 (74 to 90) 75 (70 to 82) 73 (59 to 85)
Median Body Mass Index
b
,kgm
-2
26 (23 to 28) 24 (23 to 26) 23 (21 to 24)
Median PaO
2
/FiO
2
, mmHg 169 (95 to 240) 560 (506 to 616)
d
n.a.
Median Lung Injury Score 2.3 (2.0 to 3.0) n.a. n.a.
Median Injury Severity Score
c
36 (29 to 48) 20 (12 to 26)
d
12 (6 to 16)
d,e
Median AIS-T 4 (4 to 4) n.a. n.a.
Median Thoracic Trauma Severity Score
b
11 (9 to 14) n.a. n.a.
Median Glasgow Coma Scale score
c
11 (4 to 15) 11 (7 to 15) 15 (15 to 15)
d,e
Median volume of intravenous fluids
c
, ml 2,000 (1,125 to 3,000) 1,000 (500 to 1,500)
d
1,000 (500 to 1,000)
d
Median time to CT
ns
, min 122 (90 to 207) 105 (79 to 129) 100 (81 to 136)
Median ventilator-free days
b
17 (4 to 23) 27 (19 to 27) n.a.
Median ICU-free days
b
7 (0 to 17) 22 (10 to 26) n.a.
a
All values are given as medians with interquartil e ranges. ALI, patients with acute lung injury at admission; reference ventilated, mechanically ventilated patients
with normal lungs; reference spontaneous, spontaneously breathing patients with normal lungs; Body Mass Index, weight in kilograms divided by the square of
the height in meters; PaO
2
/FiO
2
, ratio of arterial partial pressure of oxygen to fraction of inspired oxygen; AIS-T, Abbreviated Injury Scale of the Thorax; time to
CT, interval between trauma and computed tomography (CT); ventilator-free days, number of days without mechanical ventilation within a period of 28 days;
ICU, intensive care unit; ICU-free days, number of days without ICU treatment within a period of 28 days; n.a., not applicable;
ns
, not significant. Positive end-
expiratory pressure (PEEP) was 10 cmH
2
O in all mechanically ventilated patients except for five; in three patients, PEEP >10 cmH
2
O was already applied before
admission and two patients were spontaneously breathing during CT.
b
No statistical test performed.
c
P < 0.001 for the Kruskal-Wallis test over all groups.
d
P <
0.001 versus ALI.
e
P < 0.05 versus reference ventilated group.
Reske et al. Critical Care 2011, 15:R71
/>Page 4 of 10
injured and received more intravenous fluids than refer-
ence spontaneous patients. One reference ventilated
patient (2%) died as a result of severe head injury.
Demographic data are given in Table 1.
Results from qCT are given in Table 2. Supporting
their classification as normal, all reference patients had
negligible amounts of nonaerated lung (Table 2). The
median M
lung
of all reference patients was 885 (771 to
973) g, and the mean M
lung
of all reference patients was
871 (95% CI, 838 to 905) g. The 95% reference interval
for M
lung
was 584 to 1,164 g. No significant dif ferences
(P = 0.55; ANOVA) were found between mean M
lung
values of reference ventilated, reference spontaneous or
mean normal M
lung
reported by Gattinoni et al. [10]
(850 (9 5% CI, 785 to 915) g), Puybasset et al. [11] (943
(95% CI, 857 to 1,029) g) and Whimst er et al. [40] ( 850
(95% CI, 818 to 881) g).
For reference patients, M
lung
correlated moderately
with body height (R
2
=0.35,P < 0.0001), but not reli-
ably with actual body weight (R
2
=0.14).Theequation
for the regression of M
lung
(ingrams)onbodyheight
(in centimeters) for all reference patients had the follow-
ing parameters: coefficient (height) = 9.3 (95% CI, 6.4 to
12.3) and y-intercept = -768 (95% CI, -129 1 to -246).
Adjustment for sex by including a dummy-coded sex
variable (male = 0) sign ificantly improved the model for
regression of M
lung
on body height (ΔR
2
=0.05,P =
0.02 for the R
2
change). The parameters of the sex-
adjusted regression equation were coefficient ( height) =
7.2 (95% CI, 3.8 to 10.6), coefficient (sex) = -88.6 (95%
CI, -160.7 to -16.5) and y-intercept = -365 (95% CI,
-973 to 244). Adjusting for age or group (reference
spontaneous versus reference ventilated) did not
improve the model ( P = 0.65 and P = 0.14, respectively).
ALI patients
Seventy-eight patients fulfilled the AECC criteria for ALI
at admission. All patients were severely injured, and
only one patient (ISS = 12) had an ISS below 16 points.
Demographic data are given in Table 1, and the results
of qCT are given in Table 2.
Fifteen ALI patients (19%) died as a result of nonpul-
monary complications, nine patients died of severe head
injury, five died of uncontrollable hemorrhage and one
died of late sepsis and multiorgan failure. Patients who
died did not have greater M
lung
than survivors (P =
0.75). Patien ts with severe head injury (GCS score <8, n
= 30) [41] had significantly greater M
lung
(1,274 (962 to
1,634) g) than patients with GCS score ≥8(n = 48, 981
(802 to 1,161) g; P < 0.001).
Although the median M
lung
(1,088 (862 to 1,342) g) of
our ALI patients was significantly greater than that of our
reference p atients (P < 0.0001), i t was low er than the mean
values reported for other ALI patients, for example by
Patroniti et al. (1,513 (95% CI 1,426 to 1,600) g) and by
Gattinoni et al. (1,500 ( 95% CI 1,380 to 1,6 20) g) [1 0,12,42].
No reliable correlation was found between M
lung
and
scores for trauma severity (ISS, AIS-T, TTSS, LIS and
GCS), the volume of intravenous fluids, the PaO
2
/FiO
2
ratio or the time between trauma and CT (all R
2
≤ 0.16).
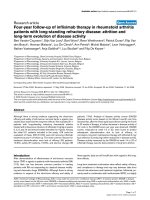
Forty-six (59%) ALI patients had M
lung
below the
upper limit of the reference interval (that is, 1,164 g)
and were thus allocated to an atelectasis subgroup
(Figure 2, Table 3). We also defined a consolidation sub-
group u sing the lower limit of the 95% CI of the mean
M
lung
(i.e. 1380 g) reported for ALI patients by Gatti-
noni et al. [10]. Statistically significant differences
between atelectasis and consolidation patients were
found for the parameters age, LIS, GCS, V
lung
,massof
Table 2 Lung volumes and weights quantified by CT
a
Parameter ALI Reference ventilated Reference spontaneous
Median V
lung
b
, ml 3,208 (2,574 to 4,289) 4,228 (3,701 to 4,621) 3,195 (2,670 to 4,918)
Median V
lung
in women
b
, ml 2,865 (2,413 to 3,293) 3,498 (2,957 to 3,948) 2779 (2,526 to 3,878)
Median V
lung
in men
b
, ml 3,304 (2,562 to 4,513) 4,426 (3,801 to 4,760) 3363 (2,979 to 6,121)
Median M
lung
c
, g 1,088 (862 to 1,342) 893 (785 to 968)
d
884 (724 to 986)
d,e
Median M
lung
in women, g 814 (748 to 1,250) 738 (664 to 765) 720 (620 to 824)
Median M
lung
in men, g 1,119 (913 to 1,358) 902 (847 to 981) 928 (864 to 993)
Median M
hyper
b
, % 0 (0 to 3) 2 (0 to 4) 0 (0 to 4)
Median M
normal
b
, % 55 (39 to 68) 88 (85 to 91) 85 (79 to 88)
Median M
poor
b
, % 17 (14 to 23) 6 (6 to 10) 9 (7 to 17)
Median M
non
b
, % 20 (11 to 34) 1 (1 to 2) 1 (1 to 2)
a
All values are given as medians with interquartil e ranges. ALI, patients with acute lung injury already at admission; reference ventilated, mechanically ventilated
patients with normal lungs; reference spontaneous, spontaneously breathing patients with normal lungs; V
lung
, total lung volume; M
lung
, total lung mass; M
hyper
,
mass of hyperaerated lung compartment; M
normal
, mass of normally aerated lung compartment; M
poor
, mass of poorly aerated lung compartment; M
non
, mass of
nonaerated lung compartment. The weights of differently aerated lung compartments were calculated as percentages of M
lung
.V
lung
and M
lung
values were
calculated for each sex separately as well as for all patients in a group to assess sex-specific differences.
b
Because the degree of insp iration was not controlled
during computed tomography, between-group comparison of V
lung
and differently aerated lung compartments was omitted.
c
P < 0.001 for the Kruskal-Wallis test
over all groups;
d
P < 0.001 versus ALI;
e
P = 0.74 versus reference ventilated.
Reske et al. Critical Care 2011, 15:R71
/>Page 5 of 10
the nonaerated lung compartment and, interestingly,
ventilator-free days and ICU-free days (Table 3).
Validation of the mass estimation technique
The mean (± standard deviation) weight of the test-ROI
obtained by geometrical calculation was 13.0 ± 5.4 g.
The values from our voxe l-by-voxel method were
slightly smaller. The mean difference (bias) between
both methods was -2.4% and the limits of agreement
were -4.6% and 0.2% of the mean weight of the test-
ROI.
Discussion
We found that atelectasis was the most likely cause of
lung dysfunction in more than half of patients who ful-
filled the clinical criteria for ALI and showed lung opa-
cifications on admission CT early after trauma.
Comparison of M
lung
values derived from qCT with a
reference interval for normal M
lung
could help to assess
the etiology of ALI and improve the definit ion of differ-
ent p opulations of ALI patien ts [2,8,10-14,42]. A group
of mechanically ventilated, volume-loaded trauma
patients with morphologically and functionally normal
lungs offered us the opportunity to confirm the normal
range of M
lung
obtained in previous analyses of diagnos-
tic CT in healthy, spontaneously breathing volunteer s
[10,11]. The M
lung
values measured in our reference
groups are in good agreement with the M
lung
values
from these previous qCT analyses and M
lung
of normal
lungs at autopsy [10,11,40]. Thus, our results suggest
that moderate p ositive intrathorac ic p ressure potentially
affecting pulmonary blood and/or lymph flow and mod-
erate intravenous volume loading have limi ted effect on
M
lung
.
Calculation of M
lung
and parameters such as the
excess lung tissue or weight by performing qCT can
help to distinguish atelectasis from consolidation due to
more significant lung damage [10-13,43]. It could be
argued that atelectasis may also be distin guished visually
from contusion or edema on the basis of typical topo-
graphical distributions. Analysis of qCT, however, can
still assess M
lung
inthepresenceofpleuralfluidor
when atelectasis is obscuring edema or pulmonary con-
tusions [16,22]. When lung aeration is impaired without
a con comitant increase in M
lung
, atelectasis is the most
likely explanation [11,13]. Accordingly, atelectasis was
the most plausible cause of lung dysfunction in 59% o f
our ALI patients (Table 3). Interestingly, atelectasis
patients also had significantly lower V
lung
values than
consolida tion patients (Table 3). Although V
lung
was not
controlled in our st udy, the latter observation is compa-
tible with the concept of atelectasis: V
lung
is reduced by
collapse, while consolidation of the lung does not neces-
sarily decrease V
lung
[44]. The identification of trauma
patients in whom atelectasis mimics ALI could be help-
ful in decision making and individualization of care
(that is, early definitive stabilization rather than damage
control surgery). Atelectasis may persist into the post-
traumatic period, pr omote bacterial growth and nosoco-
mial pneumonia and affect patient outcome
[3,23,45-50]. Therefore, more aggressive ventilatory
management, early definitive surgical treatment and
timely weaning from mechanical ventilation could
shorten the ICU treatment and reduce the incidence of
infections in patients with atelectasis [4,20-24,49].
Thirty -two ALI patients (41%) had increased M
lung
.In
only 17 patient s (22%) was M
lung
incr eased to the range
previously reported for ALI patients, suggesting consoli-
dation from more significant lung injury due to contu-
sion, hemorrhage, aspiration or edema resulting from
pulmonary and/or systemic inflammation with capillary
leakage [10-13]. Although fluid overload may also play a
role [3], we did not find significantly higher infusion
volumes in c onsoli dati on patients, and all five patien ts
who received more than four liters of infusions had
M
lung
values within the reference interval (Table 3). The
Figure 2 Comparison of lung weights. Lung weights of 78
patients with acute lung injury (ALI) upon admission (red circles) in
comparison to the values of 43 mechanically ventilated trauma
patients with morphologically and functionally normal lungs
(reference ventilated, gray circles). Dashed lines mark the 95%
reference intervals for total lung mass and total lung volume,
respectively, calculated from reference ventilated patients. Because
reference ventilated patients were ventilated with the same positive
end-expiratory pressure (10 cmH
2
O) and also underwent computed
tomography during uninterrupted mechanical ventilation, only
these reference ventilated patients were used for the graphical
comparison with ALI patients in this graph. ALI patients whose data
points fall within the gray box did not have an increased lung
weight.
Reske et al. Critical Care 2011, 15:R71
/>Page 6 of 10
association of severe head injury with increased M
lung
further underlines the fact that multiple factors, such as
neurogenic pulmonary edema, may be involved in the
development of posttraumatic lung dysfunction [41].
Even if the precise eti ology of postt raumatic lung dys-
function remains unclear in some patients, information
on preexisting lung damage could help clinicians to
judge the individual patient’s tolerance for further
aggressive shock resuscitation and definitive surgical
repair [20,24]. It could also gui de clinicians in choosing
treatment concepts such as lung-protective mechanical
ventilation or damage control surgery, which are focused
on the prevention of “second hits” to lungs which have
already been primed by shock and pulmonary or sys-
temic injuries. Among such “second hits” are surgical
trauma, ongoing intraoperative blood loss and transfu-
sion, fat embolism following intramedullary nailing or
injurious mechanical ventilation [3,17-20,51].
Parameters such as ISS or PaO
2
/FiO
2
, which have pre-
viously been used for the prediction and further charac-
terization of posttraumatic ALI, failed to distinguish
atelectasis from consolidation patients [3,52,53]. In con-
trast, age as well as LIS, GCS and qCT results differed
statistically significantly between these groups. Interest-
ingly, atelectasis patients spent fewer days on mechani-
cal v entilation and in the ICU than c onsolidation
patients (Table 3). However, given the fact that all
patients fulfilling the ALI criteria early after trauma
have been managed according to the damage control
concept in our institution, the latter differences should
be considered hypothesis-generating rather than hypoth-
esis-confirming. The variable reliability of clinical para-
meters and scores for characterizing posttraumatic ALI
supports the potential clinical usefulness o f qCT, which
is the only availab le in vivo method to directly and reli-
ably quantify M
lung
and the amount of nonaerated lung
tissue, which both characterize the severity of lung
injury [10-12,52].
Some aspects of our methodology warrant discussion.
(1) We studied ALI patients within 24 hours after
trauma (Table 1) because it was our aim to study the
etiology of early posttraumatic respiratory failure, which
may differ significantly from respiratory problems devel-
oping later [3,4,49,54]. (2) All whole-body CT scans per-
formed in our emergency trauma patients routinely
involved the clinically indicated application of contrast
material [21,31]. A possible effect of contrast material
on the normal M
lung
was the reason why we included a
reference group and did not refer only to existing data
[10,11,40,55]. The normal M
lung
found in our reference
patients matched that in previous reports, which sup-
ports the lack of an effect of contrast material on the
qCT assessment of M
lung
in patients with normal lungs
[55]. Patients with atelectasis should also remain unaf-
fected by a possible contrast material-associated increase
in M
lung
. In contrast, the leakage of contrast material
Table 3 Patient subgroups defined by different ranges of lung weights
a
Patient subgroups Atelectasis (≤ reference range) Above reference range Consolidation
Definition M
lung
≤1,164 g M
lung
>1,164 g M
lung
>1,380 g
Number of patients
b
46 (59%) 32 (41%) 17 (22%)
Median age
c
, yr 45 (32 to 53) 28 (17 to 46) 21 (17 to 48)
Median PaO
2
/FiO
2
ns
, mmHg 184 (128 to 252) 136 (78 to 238) 132 (68 to 230)
Median Lung Injury Score
e
2.3 (1.6 to 2.6) 2.7 (2.3 to 3.3) 3.0 (2.3 to 3.3)
Median Injury Severity Score
ns
34 (29 to 45) 41 (28 to 50) 36 (25 to 50)
Median AIS-T score
b
4 (4 to 4) 4 (4 to 4) 4 (4 to 4)
Median Thoracic Trauma Severity Score
ns
11 (8 to 14) 12 (9 to 15) 12 (11 to 15)
Median Glasgow Coma Scale score
e
14 (10 to 15) 6 (3 to 12) 7 (3 to 15)
Median volume of intravenous fluids
ns
, ml 2,000 (1,000 to 3,000) 2,000 (1,500 to 2,875) 2,500 (1,500 to 3,000)
Median time to CT
ns
, min 135 (90 to 220) 112 (90 to 177) 131 (103 to 227)
Median ventilator-free days
d
19 (10 to 25) 15 (0 to 19) 15 (0 to 19)
Median ICU-free days
c
14 (2 to 22) 1 (0 to 13) 5 (0 to 14)
Median V
lung
e
, ml 2,832 (2,226 to 3,669) 3,812 (3,134 to 4,696) 3,696 (3,019 to 4,668)
Median M
lung
b
, g 899 (787 to 1,048) 1,398 (1,265 to 1,972) 1,930 (1,461 to 2,065)
Median M
non
e
, % 16 (10 to 25) 34 (18 to 52) 40 (33 to 57)
a
All values are given as medians with interquartil e ranges. Atelectasis, patients with lung weights (M
lung
) within the reference interval (that is, 584 to 1,164 g) for
normal M
lung
; above reference, patients with M
lung
values exceeding the upper limit of the reference interval (that is, 1,164 g); consolidation, patients with M
lung
values exceeding the lower limit of the 95% confidence interval of the mean M
lung
values reported for patients with acute lung injury (that is, 1,380 g [10]);
PaO
2
/FiO
2
, ratio of arterial partial pressure of oxygen to fraction of inspired oxygen; AIS-T, Abbreviated Injury Scale of the Thorax; time to CT, interval between
trauma and computed tomography (CT); ventilator-free days, number of days without mechanical ventilation within a period of 28 days; ICU, intensive care unit;
ICU-free days, number of days without ICU treatment within a period of 28 days; V
lung
, total lung volume; M
lung
, total lung mass; M
non
, percentage mass of
nonaerated lung compartment (percentage of M
lung
value);
ns
, not significant.
b
No statistical test performed.
c
P < 0.05,
d
P < 0.001 and
e
P < 0.01, respectively, for
the Kruskal-Wallis test over all groups.
Reske et al. Critical Care 2011, 15:R71
/>Page 7 of 10
into the pulmonary interstitium may artefactually
increase M
lung
calculated on the basis of qCT in patients
with an injured alveolar-capillary barrier [55]. H owever,
although desirable from a scientific perspective, contrast
material administration appears unavoidable in emer-
gencytraumapatients,andapossibleartefactual
increase in M
lung
must be taken into account. ( 3)
Because varying segmentations result in inconsistent
M
lung
values, we used a threshold-based (-350 HU) seg-
mentation technique in addition to manual segmenta-
tion to improve the highly subjectiv e manual exclusion
of partial volume effects at the boundaries of aerated
lung regions. So far, no CT study in ALI patients has
included such attempts, and thus this threshold was
adopted from other thoracic qCT applications. (4)
Because the manual interaction necessary for qCT ana-
lysis is time-consuming, it might still be considered
unrealistic to introduce qCT-based information into
clinical practice. The extrapolation method, which we
described recently, offers significant time savings and
could aid the clinical implementation of qCT [14,25].
Limitations of our study
Because chest X-rays were not obtained in addition to
CT scans during routine clinical imaging, we could not
confirm the presence of infiltrates conventionally on the
basis of chest X-rays. Moreover, our results may not be
directly transferrable to patients subjected to higher
intrathoracic pressures or massive intravenous volume
loading. While M
lung
is only minimally affected, para-
meters characterizing lung aeration and volume depend
on the degree of inspiration as well as on differences
between CT scanners and image reconstruction proto-
cols. Because CT scanning was performed during
ongoing mechanical ventilation, the end-expiratory
amount of nonaerated lung might have been underesti-
mated. Different CT scanners and image reconstruction
interact with the qu antification of hyperaeration. There-
fore, w e omitted the between-group comparison of the
differently aerated lung compartments, which was not
the focus of the present study (Table 2) [30].
Conclusions
qCT can detect different etiologies of posttraumatic lung
dysfunction. Atelectasis was the most likely c ause of
early posttraumatic lung dysfunction in more than half
of our patients. Whether individualized care based on
qCT actually offers an option to prevent secondary lung
injury, reduce posttraumatic pulmonary complications
and improve outcome remains to be studied.
Key messages
• Diagnosis, management and further study of ALI in
trauma patients may b e hampered by uncertainties
about the fulfillmen t of the criter ia for ALI proposed
by the AECC.
• Differentiation between atelectasis and consolida-
tion of the lung by qCT may help to identify
patients with different etiologies of posttraumatic
lung dysfunction.
• In our study, atelectasis was the most likely cause
of early posttraumatic lung dysfunction in more
than half of patients, and only 20% of patients had
M
lung
values in the range previously reported for
ALI.
• Trauma patients with atelectasis may require
shorter periods of mechanical ventilation a nd treat-
ment in the ICU.
• In the future, information from qCT could aid in
managing patients with early posttraumatic lung
dysfunction.
Abbreviations
AECC: American-European Consensus Conference on Acute Respiratory
Distress Syndrome; AIS-T: Abbreviated Injury Scale of the Thorax; ALI: acute
lung injury; ANOVA: analysis of variance; ARDS: acute respiratory distress
syndrome; 95% CI: 95% confidence interval; CT: computed tomography; FiO
2
:
fraction of inspired oxygen; GCS: Glasgow Coma Scale; HU: Hounsfield units;
ICU: intensive care unit; IQR: interquartile range; ISS: Injury Severity Score; LIS:
Lung Injury Score; M
lung
: lung weight; PaO
2
: arterial partial pressure of
oxygen; PEEP: positive end-expiratory pressure; qCT: quantitative analysis of
computed tomography; TTSS: Thoracic Trauma Severity Score; V
lung
: lung
volume.
Acknowledgements
Institutional funding was provided by Leipzig University Hospital.
Author details
1
Department of Anesthesiology and Intensive Care Medicine, University
Hospital Leipzig, Liebigstrasse 20, D-04103 Leipzig, Germany.
2
Pulmonary
Engineering Group, Department of Anesthesiology and Intensive Care
Medicine, University Hospital Carl Gustav Carus, Fetscherstrasse 74, D-01307
Dresden, Germany.
3
Department of Trauma and Reconstructive Surgery,
University Hospital Leipzig, Liebigstrasse 20, D-04103 Leipzig, Germany.
4
Department of Diagnostic and Interventional Radiology, University Hospital
Leipzig, Liebigstrasse 20, D-04103 Leipzig, Germany.
5
Department of Surgery,
Surgical Intensive Care Unit, University Hospital Carl Gustav Carus,
Fetscherstrasse 74, D-01307 Dresden, Germany.
6
Innovation Center
Computer Assisted Surgery (ICCAS), University of Leipzig, Semmelweisstrasse
14, D-04103 Leipzig, Germany.
7
Cardio-Pulmonary Department, Pulmonary
Division, Hospital das Clínicas, University of São Paulo Medical School, Av. Dr
Arnaldo 455 (Room 2206, 2nd floor), São Paulo 01246-903, Brazil.
Authors’ contributions
AWR and APR contributed equally to this work. AWR, APR, DS, MS, CJ and
MBPA planned the study. AWR, APR, DS, MS, HB, and UG were responsible
for the data acquisition. AWR, APR, TH, AR, MS, HB, SB and UG performed
the quantitative CT analysis. AWR, PMS, HW, MGA and MBPA undertook the
statistical analysis. All authors contributed to the preparation of the
manuscript. The principal investigators, AWR and APR, had full access to the
data analyzed in the study and take full responsibility for the integrity of all
of the data and the accuracy of the data analysis.
Competing interests
The authors declare that they have no competing interests.
Received: 8 December 2010 Revised: 31 January 2011
Accepted: 25 February 2011 Published: 25 February 2011
Reske et al. Critical Care 2011, 15:R71
/>Page 8 of 10
References
1. Bernard GR, Artigas A, Brigham KL, Carlet J, Falke K, Hudson L, Lamy M,
Legall JR, Morris A, Spragg R: The American-European Consensus
Conference on ARDS: definitions, mechanisms, relevant outcomes, and
clinical trial coordination. Am J Respir Crit Care Med 1994, 149:818-824.
2. Spragg RG, Bernard GR, Checkley W, Curtis JR, Gajic O, Guyatt G, Hall J,
Israel E, Jain M, Needham DM, Randolph AG, Rubenfeld GD, Schoenfeld D,
Thompson BT, Ware LB, Young D, Harabin AL: Beyond mortality: future
clinical research in acute lung injury. Am J Respir Crit Care Med 2010,
181:1121-1127.
3. Croce MA, Fabian TC, Davis KA, Gavin TJ: Early and late acute respiratory
distress syndrome. J Trauma 1999, 46:361-366.
4. Dicker RA, Morabito DJ, Pittet JF, Campbell AR, Mackersie RC: Acute
respiratory distress syndrome criteria in trauma patients: why the
definitions do not work. J Trauma 2004, 57:522-526.
5. Johannigman JA, Miller SL, Davis BR, Davis K Jr, Campbell RS, Branson RD:
Influence of low tidal volumes on gas exchange in acute respiratory
distress syndrome and the role of recruitment maneuvers. J Trauma
2003, 54:320-325.
6. Kwon A, Sorrells DL Jr, Kurkchubasche AG, Cassese JA, Tracy TF Jr, Luks FI:
Isolated computed tomography diagnosis of pulmonary contusion does
not correlate with increased morbidity. J Pediatr Surg 2006, 41:78-82.
7. Schild HH, Strunk H, Weber W, Stoerkel S, Doll G, Hein K, Weitz M:
Pulmonary contusion: CT vs plain radiograms. J Comput Assist Tomogr
1989, 13:417-420.
8. Levitt JE, Bedi H, Calfee CS, Gould MK, Matthay MA: Identification of early
acute lung injury at initial evaluation in an acute care setting prior to
the onset of respiratory failure. Chest 2009, 135:936-943.
9. Gattinoni L, Caironi P, Pelosi P, Goodman LR: What has computed
tomography taught us about the Acute Respiratory Distress Syndrome?
Am J Respir Crit Care Med 2001, 164:1701-1711.
10. Gattinoni L, Caironi P, Cressoni M, Chiumello D, Ranieri VM, Quintel M,
Russo S, Patroniti N, Cornejo R, Bugedo G: Lung recruitment in patients
with the acute respiratory distress syndrome. N Engl J Med 2006,
354:1775-1786.
11. Puybasset L, Cluzel P, Gusman P, Grenier P, Preteux F, Rouby JJ: Regional
distribution of gas and tissue in acute respiratory distress syndrome. I.
Consequences for lung morphology. CT Scan ARDS Study Group.
Intensive Care Med 2000, 26:857-869.
12. Patroniti N, Bellani G, Maggioni E, Manfio A, Marcora B, Pesenti A:
Measurement of pulmonary edema in patients with acute respiratory
distress syndrome. Crit Care Med 2005, 33:2547-2554.
13. Rouby JJ, Puybasset L, Nieszkowska A, Lu Q: Acute respiratory distress
syndrome: lessons from computed tomography of the whole lung. Crit
Care Med 2003, 31(Suppl 4):S285-S295.
14. Gattinoni L, Cressoni M: Quantitative CT in ARDS: towards a clinical tool?
Intensive Care Med 2010, 36:1803-1804.
15. Brismar B, Hedenstierna G, Lundquist H, Strandberg A, Svensson L, Tokics L:
Pulmonary densities during anesthesia with muscular relaxation: a
proposal of atelectasis. Anesthesiology 1985, 62:422-428.
16.
Groeneveld AB: Increased permeability-oedema and atelectasis in
pulmonary dysfunction after trauma and surgery: a prospective cohort
study. BMC Anesthesiol 2007, 7:7.
17. Gajic O, Frutos-Vivar F, Esteban A, Hubmayr RD, Anzueto A: Ventilator
settings as a risk factor for acute respiratory distress syndrome in
mechanically ventilated patients. Intensive Care Med 2005, 31:922-926.
18. dos Santos CC, Slutsky AS: Protective ventilation of patients with acute
respiratory distress syndrome. Crit Care 2004, 8:145-147.
19. Tsukamoto T, Chanthaphavong RS, Pape HC: Current theories on the
pathophysiology of multiple organ failure after trauma. Injury 2010,
41:21-26.
20. O’Toole RV, O’Brien M, Scalea TM, Habashi N, Pollak AN, Turen CH:
Resuscitation before stabilization of femoral fractures limits acute
respiratory distress syndrome in patients with multiple traumatic injuries
despite low use of damage control orthopedics. J Trauma 2009,
67:1013-1021.
21. Schreiter D, Reske A, Stichert B, Seiwerts M, Bohm SH, Kloeppel R, Josten C:
Alveolar recruitment in combination with sufficient positive end-
expiratory pressure increases oxygenation and lung aeration in patients
with severe chest trauma. Crit Care Med 2004, 32:968-975.
22. Reske A, Seiwerts M, Reske A, Gottschaldt U, Schreiter D: Early recovery
from post-traumatic acute respiratory distress syndrome. Clin Physiol
Funct Imaging 2006, 26:376-379.
23. Duggan M, Kavanagh BP: Pulmonary atelectasis: a pathogenic
perioperative entity. Anesthesiology 2005, 102:838-854.
24. Vallier HA, Cureton BA, Ekstein C, Oldenburg FP, Wilber JH: Early definitive
stabilization of unstable pelvis and acetabulum fractures reduces
morbidity. J Trauma 2010, 69:677-684.
25. Reske AW, Reske AP, Gast HA, Seiwerts M, Beda A, Gottschaldt U, Josten C,
Schreiter D, Heller N, Wrigge H, Amato MB: Extrapolation from ten
sections can make CT-based quantification of lung aeration more
practicable. Intensive Care Med 2010, 36:1836-1844.
26. Schoenfeld DA, Bernard GR, ARDS Network: Statistical evaluation of
ventilator-free days as an efficacy measure in clinical trials of treatments
for acute respiratory distress syndrome. Crit Care Med 2002, 30:1772-1777.
27. Murray JF, Matthay MA, Luce JM, Flick MR: An expanded definition of the
adult respiratory distress syndrome. Am Rev Respir Dis 1988, 138:720-723.
28. Civil ID, Schwab CW: The Abbreviated Injury Scale, 1985 revision: a
condensed chart for clinical use. J Trauma
1988, 28:87-90.
29.
Pape HC, Remmers D, Rice J, Ebisch M, Krettek C, Tscherne H: Appraisal of
early evaluation of blunt chest trauma: development of a standardized
scoring system for initial clinical decision making. J Trauma 2000,
49:496-504.
30. Reske AW, Busse H, Amato MB, Jaekel M, Kahn T, Schwarzkopf P,
Schreiter D, Gottschaldt U, Seiwerts M: Image reconstruction affects
computer tomographic assessment of lung hyperinflation. Intensive Care
Med 2008, 34:2044-2053.
31. Huber-Wagner S, Lefering R, Qvick LM, Körner M, Kay MV, Pfeifer KJ,
Reiser M, Mutschler W, Kanz KG, Working Group on Polytrauma of the
German Trauma Society: Effect of whole-body CT during trauma
resuscitation on survival: a retrospective, multicentre study. Lancet 2009,
373:1455-1461.
32. Kim H, Maekado M, Tan JK, Ishikawa S, Tsukuda M: Automatic extraction of
ground-glass opacity shadows on CT images of the thorax by
correlation between successive slices. Proceedings of the 17th IEEE
International Conference on Tools with Artificial Intelligence (ICTAI’05) 2005,
607-612.
33. Li R, Lewis JH, Cerviño LI, Jiang SB: 4D CT sorting based on patient
internal anatomy. Phys Med Biol 2009, 54:4821-4833.
34. Li G, Xie H, Ning H, Lu W, Low D, Citrin D, Kaushal A, Zach L,
Camphausen K, Miller RW: A novel analytical approach to the prediction
of respiratory diaphragm motion based on external torso volume
change. Phys Med Biol 2009, 54:4113-4130.
35. Borges JB, Okamoto VN, Matos GF, Caramez MP, Arantes PR, Barros F,
Souza CE, Victorino JA, Kacmarek RM, Barbas CS, Carvalho CR, Amato MB:
Reversibility of lung collapse and hypoxemia in early acute respiratory
distress syndrome. Am J Respir Crit Care Med 2006, 174:268-278.
36. Clinical and Laboratory Standards Institute: Defining, establishing, and
verifying reference intervals in the clinical laboratory: approved guideline. 3
edition. Wayne, PA: Clinical and Laboratory Standards Institute; 2008, CLSI
Document C28-A3.
37. Horn PS, Pesce AJ, Copeland BE: A robust approach to reference interval
estimation and evaluation. Clin Chem 1998, 44:622-631.
38. Deeks J: Are you sure that’s a standard deviation? (part 1). Cochrane
News 1997, 10:11-12.
39. Bland JM, Altman DG: Statistical methods for assessing agreement
between two methods of clinical measurement. Lancet 1986, 1:307-310.
40. Whimster WF, Macfarlane AJ: Normal lung weights in a white population.
Am Rev Respir Dis 1974, 110:478-483.
41. Baumann A, Audibert G, McDonnell J, Mertes PM: Neurogenic pulmonary
edema. Acta Anaesthesiol Scand 2007, 51:447-455.
42. de Hemptinne Q, Remmelink M, Brimioulle S, Salmon I, Vincent JL: ARDS: a
clinicopathological confrontation. Chest 2009, 135:944-949.
43.
Gattinoni L, Pesenti A, Bombino M, Baglioni S, Rivolta M, Rossi F, Rossi G,
Fumagalli R, Marcolin R, Mascheroni D, Torresin A: Relationships between
lung computed tomographic density, gas exchange, and PEEP in acute
respiratory failure. Anesthesiology 1988, 69:824-832.
44. Hubmayr RD: Perspective on lung injury and recruitment: a skeptical
look at the opening and collapse story. Am J Respir Crit Care Med 2002,
165:1647-1653.
Reske et al. Critical Care 2011, 15:R71
/>Page 9 of 10
45. Pelosi P, Jaber S: Noninvasive respiratory support in the perioperative
period. Curr Opin Anaesthesiol 2010, 23:233-238.
46. Richardson JD, Woods D, Johanson WG Jr, Trinkle JK: Lung bacterial
clearance following pulmonary contusion. Surgery 1979, 86:730-735.
47. van Kaam AH, Lachmann RA, Herting E, De Jaegere A, van Iwaarden F,
Noorduyn LA, Kok JH, Haitsma JJ, Lachmann B: Reducing atelectasis
attenuates bacterial growth and translocation in experimental
pneumonia. Am J Respir Crit Care Med 2004, 169:1046-1053.
48. Ferreyra G, Long Y, Ranieri VM: Respiratory complications after major
surgery. Curr Opin Crit Care 2009, 15:342-348.
49. Antonelli M, Moro ML, Capelli O, De Blasi RA, D’Errico RR, Conti G, Bufi M,
Gasparetto A: Risk factors for early onset pneumonia in trauma patients.
Chest 1994, 105:224-228.
50. Leone M, Brégeon F, Antonini F, Chaumoître K, Charvet A, Ban LH,
Jammes Y, Albanèse J, Martin C: Long term outcome in chest trauma.
Anesthesiology 2008, 109:864-871.
51. Stewart RM, Park PK, Hunt JP, McIntyre RC Jr, McCarthy J, Zarzabal LA,
Michalek JE, National Institutes of Health/National Heart, Lung, and Blood
Institute Acute Respiratory Distress Syndrome Clinical Trials Network: Less is
more: improved outcomes in surgical patients with conservative fluid
administration and central venous catheter monitoring. J Am Coll Surg
2009, 208:725-735.
52. Miller PR, Croce MA, Bee TK, Qaisi WG, Smith CP, Collins GL, Fabian TC:
ARDS after pulmonary contusion: accurate measurement of contusion
volume identifies high-risk patients. J Trauma 2001, 51:223-228.
53. Miller PR, Croce MA, Kilgo PD, Scott J, Fabian TC: Acute respiratory distress
syndrome in blunt trauma: identification of independent risk factors. Am
Surg 2002, 68:845-850.
54. Michelet P, Couret D, Brégeon F, Perrin G, D’Journo XB, Pequignot V, Vig V,
Auffray JP: Early onset pneumonia in severe chest trauma: a risk factor
analysis. J Trauma 2010, 68:395-400.
55. Bouhemad B, Richecoeur J, Lu Q, Malbouisson LM, Cluzel P, Rouby JJ, ARDS
CT Scan Study Group: Effects of contrast material on computed
tomographic measurements of lung volumes in patients with acute lung
injury. Crit Care 2003, 7:63-71.
doi:10.1186/cc10060
Cite this article as: Reske et al.: Computed tomographic assessment of
lung weights in trauma patients with early posttraumatic lung
dysfunction. Critical Care 2011 15:R71.
Submit your next manuscript to BioMed Central
and take full advantage of:
• Convenient online submission
• Thorough peer review
• No space constraints or color figure charges
• Immediate publication on acceptance
• Inclusion in PubMed, CAS, Scopus and Google Scholar
• Research which is freely available for redistribution
Submit your manuscript at
www.biomedcentral.com/submit
Reske et al. Critical Care 2011, 15:R71
/>Page 10 of 10