Báo cáo y học: "Respiratory pulse pressure variation fails to predict fluid responsiveness in acute respiratory distress syndrome" ppsx
Bạn đang xem bản rút gọn của tài liệu. Xem và tải ngay bản đầy đủ của tài liệu tại đây (1022.75 KB, 11 trang )
RESEARCH Open Access
Respiratory pulse pressure variation fails to
predict fluid responsiveness in acute respiratory
distress syndrome
Karim Lakhal
1
, Stephan Ehrmann
2
, Dalila Benzekri-Lefèvre
3
, Isabelle Runge
3
, Annick Legras
2
,
Pierre-François Dequin
2
, Emmanuelle Mercier
2
, Michel Wolff
1
, Bernard Régnier
1
, Thierry Boulain
3*
Abstract
Introduction: Fluid responsiveness prediction is of utmost interest during acute respiratory distress syndrome
(ARDS), but the performance of respiratory pulse pressure variati on (Δ
RESP
PP) has scarcely been reported. In patients
with ARDS, the pathophysiology of Δ
RESP
PP may differ from that of healthy lungs because of low tidal volume (Vt),
high respiratory rate, decreased lung and sometimes chest wall compliance, which increase alveolar and/or pleural
pressure. We aimed to assess Δ
RESP
PP in a large ARDS population.
Methods: Our study population of nonarrhythmic ARDS patients without inspiratory effort were considered
responders if their cardiac output increased by >10% after 500-ml volume expansion.
Results: Among the 65 included patients (26 responders), the area under the receiver-operating curve (AUC) for
Δ
RESP
PP was 0.75 (95% confidence interval (CI
95
): 0.62 to 0.85), and a best cutoff of 5% yielded positive and
negative likelihood ratios of 4.8 (CI
95
: 3.6 to 6.2) and 0.32 (CI
95
: 0.1 to 0.8), respectively. Adjusting Δ
RESP
PP for Vt,
airway driving pressure or respiratory variations in pulmonary artery occlusion pressure (ΔPAOP), a surrogate for
pleural pressure variations, in 33 Swan-Ganz catheter carriers did not markedly improve its predictive performance.
In patients with ΔPAOP above its median value (4 mmHg), AUC for Δ
RESP
PP was 1 (CI
95
: 0.73 to 1) as compared
with 0.79 (CI
95
: 0.52 to 0.94) otherwise (P = 0.07). A 300-ml volume expansion induced a ≥2 mmHg increase of
central venous pressure, suggesting a change in cardiac preload, in 40 patients, but none of the 28 of 40
nonresponders responded to an additional 200-ml volume expansion.
Conclusions: During protective mechanical ventilation for early ARDS, partly because of insufficient changes in
pleural pressure, Δ
RESP
PP performance was poor. Careful fluid challenges may be a safe alternative.
Introduction
Many appealing indices have been proposed to predict
fluid responsiveness, using hea rt-lung interactions (for
example, respiratory variations of pulse pressure
(Δ
RESP
PP)) [1,2] or passive leg raising [3]. Δ
RESP
PP
requires controlled mecha nical ventilation in nonar-
rhythmic patients sufficiently sedated for not triggering
the ventilator [4]. As the use of sedation in the intensive
care unit (ICU) has decreased over the past few years,
this situation is rarely encountered, exc ept in cases such
as severe respiratory failure (such as acute respiratory
distress syndrome (ARDS)) requiring perfect patient-
ventilator interactions. Of note, fluid responsiveness pre-
diction is crucial in patients with ARDS because of
increased alveolar-capillary membrane permeability [5],
and avoiding unnecessary fluid loading has been shown
to have a positive effect on patient outcome [6].
Nevertheless, cardiopulmonary interactions are com-
plex in case of ARDS, particularly when lung-prote ctive
mechanical ventilation (low tidal volume) is performed
as recommended nowadays [5], and several limitations
may downplay the usefulness of Δ
RESP
PP. First, the mag-
nitude of the insufflated tidal volume (Vt) affects the
magnitude of Δ
RESP
PP (or other indices derived from
* Correspondence:
3
Service de réanimation médicale, Hôpital La Source, centre hospitalier
régional, avenue de l’Hôpital, F-45067 Orléans cedex 1, France
Full list of author information is available at the end of the article
Lakhal et al. Critical Care 2011, 15:R85
/>© 2011 Lakhal et al.; license e BioMed Central Ltd. This is an open access article distributed under the terms of the Creative Commons
Attribution License (http://creati vecommons.org/licenses/by/2.0), which permits unrestricted use, distribution, and reproduct ion in
any medium, provided the original work is properly cited.
respiratory changes in stroke volume) in non-ARDS or
mixed ARDS and non-ARDS patients [7-9]. Thus, the
performance of Δ
RESP
PP becomes poor when the Vt is
settled below 8 ml/kg [10,11]. Second, ARDS patients
exhibit a marked decrease in lung and sometimes chest
wall compliance [5]. Consequently, airway driving pres-
sure (plateau pressure (Pplat) minus total positive end-
expiratory pressure (PEEPt)) for a given Vt is greater in
ARDS than in healthy lungs [12]. Therefore, it has been
hypothesized that, despite a reduced Vt, cyclic swings in
airway pressure are still high enough to maintain
Δ
RESP
PP predictive ability in ARDS patients [13]. How-
ever, one may question this assumption. Ind eed,
Δ
RESP
PP results of swings in right atrial pressure which
are close to pericardial and pleural pressure swings.
Rather than airway driving pressure, the main determi-
nants of respiratory changes in pleural, pericardial and
atrial pressure are Vt magnitude and chest wall compli-
ance (both of which determine the compre ssion of the
anatomic structures in the cardiac fossa) [14,15].
Decreased lung compliance during ARDS may therefore
have little effect on Δ
RESP
PP [12]. Last, to avoid respira-
tory acidosis, reduced Vt is frequently combined with an
increased respiratory rate (RR), which may a lso down-
play the performance of Δ
RESP
PP [16].
Thus, Δ
RESP
PP may be of interest to guide fluid ther-
apy during ARDS, b ut several physiological mechanisms
may limit its validity. The current literature about its
performance in ARDS is scarce, and opposite conclu-
sions have been drawn [10,17]. We aimed to assess the
performance of Δ
RESP
PP to predict fluid responsiveness
in a large population of patients with ARDS.
Materials and methods
ARDS patients from another study were studied [3] and
are being partly shared with another study [18]. In the
three participating centers (Hôpital Bichat-Claude Ber-
nard, Paris, France; Centre Hospitalier Régional Univer-
sitaire of Tours, Tours, France; and Centre Hospitalier
Régional of Orléans, Orléans, France), patients were
included over the same 18-month period, either after
written informed consent was obtained from a relative
or after emergency enrollment followed by delayed con-
sent as approved by our regional ethics board.
Patients
Adults with acute circulatory failure (systolic blood pres-
sure <90 mmHg, mean blood pressure <65 mm Hg, skin
mottling, urine output <0.5 ml/kg/hour, arterial lactate
>2.5 mM/l or vasopressor infusion) and ARDS [19]
exhibiting a Ramsay sedation scale score >4 and no
arrhythmia were included if they were receiving
mechanical ventilation in volume-controlled mode wit h-
out triggering the ventilator.
Patients were not included if they were receiving
diuretic treatment, had uncontrolled hemorrhage, were
in a state of brain death, were receiving intraaortic bal-
loon pump support, had a risk of fluid loading-induced,
life-threatening, hypoxemia (partial pressure of O
2
to
fraction of inspired O
2
ratio (PaO
2
/FiO
2
ratio) <70
mmHg, body weight indexed extravascular lung water
(EVLWi) >22 ml
-1
kg
-1
(PiCCO™ system: Pulsion Medi-
cal Systems AG, Munich, Germany), transmural pul-
monary artery occlusion pressure (PAOPtm) >22 mmHg
(pulmonary artery catheter; Edwards Lifesciences, Irvine,
CA, USA)). PAOPtm equals PAOP minus an estimation
of the extramural pressure that acts on pulmonary ves-
sels and was calculated as follows: PAOPtm = end
expiratory PAOP - [PEEPt × (end inspiratory PAOP -
end expiratory PAOP)/(Pplat - PEEPt)]) [20].
The study procedure w as stopped in c ase of change s
in respirator settings or vasoactive therapy, occurrence
of arrhythmia or respiratory intolerance to volume
expansion (EVLWi >22 ml
-1
kg
-1
or PAOPtm >22
mmHg or 5% decrease in pulse oxymetry (SpO
2
)).
Mechanical ventilation, vasoactive therapy, sedation and
paralysis were set by the attending physician and not
modified.
Measurements
Hemodynamic (heart rate (HR), blood pressure and car-
diac output (CO)) and respiratory parameters (PEEPt,
Pplat, RR and Vt) were measured at baseline, immedi-
ately after infusion of 300 ml of modified fluid gelatin
over 18 minutes (to assess the respiratory tolerance) and
an additional 200 ml over 12 minutes.
CO was measur ed through end-expiratory injection of
10 ml or 15 ml (transcardiac or transpulmonary thermo-
dilution, respectively) of an iced dextrose solution (using
a closed injection system with in-line temperature mea-
surement: CO-set+™ system (Edwards Lifesciences) or
that which is included in the PiCCO™ system). Three
consecutive measurements within 10% (if not, seven
measurements) were averaged.
The correct placement of the pulmonary artery cathe-
ter was ascertained by visualization of concordant wave-
forms and calculation of the respiratory c hanges in
PAOP (ΔPAOP)-to-respiratory changes in pulmonary
artery pressure (ΔPAP) ratio [21].
Central venous pressure (CV P) (direct reading of the
displayed value), PAOP (end-expiratory value measured
on frozen waveform) and blood pressure were measured
with a disposable transducer (TruWave™; Baxter Divi-
sion Edwards, Maurepas, Fran ce), zeroed at the level of
the midaxillary line. Offline, on high-resolution paper
tracings, including airwa y and blood pressure waveforms
and after their numerical enlargement, Δ
RESP
PP was cal-
culated by an o bserver blinded to other hemodynamic
Lakhal et al. Critical Care 2011, 15:R85
/>Page 2 of 11
data as follows and averaged over three consecutive
respiratory cycles:
RESP
PP =
(
maximal PP − minimal PP
)
/[
(
maximal PP + minimal PP
)
/2]
,
within one respiratory cycle [1]. Other indices derived
from respiratory changes in arterial pressure were calcu-
lated over t hree consecutive respiratory cycles: the
expiratory decrease in systolic pressure (dDown) and the
respiratory changes in systolic pressure (SPV) [15].
Echocardiography was performed within 6 hours of
measurements to quantify valvular regurgitations and to
detect intracardiac shunts or acute cor pulmonale (right-
to-left ventricular end-diastolic area ratio above 0.6 with
paradoxical septal wall motion).
Statistical analysis
Patients were classified as responders if volume expan-
sioninducedanincreaseinCO≥10% and as nonre-
sponders otherwise. Indeed, a measured increase of CO
above 9% (which we rounded t o 10%) reliably reflects
that a real change has taken place [22]. To validate this
choice of cutoff in our patients (asse ssment of intermea-
surement variability within each set of measurements),
we calculated the least significant change (LSC) for each
set of CO measurements in each patient at each phase
((1.96√2)CV/√number of measurements within one set)
with CV being the coefficient of variation (SD/mean).
Thus, we ascertained that each individual patient classi-
fied as a responder had a CO increase above LSC [23].
Calculations were also performed using a 15% relative
[1,4] or an absolute 300 ml/min/m
2
[24] cutoff to define
fluid responsiveness.
Variables (expressed as means ± SD or n (%)) were
compared using Student’s t-test and Fisher’sexacttest
(between responders and nonresponders), paired Stu-
dent’s t-test (for each patient), analysis of variance a nd
the c
2
test (between centers). For each index (Δ
RESP
PP,
SPV and dDown), we calculated the area under the recei-
ver-operating characteristic curve (AUC), determined
positive and negative likelihood ratio s (LR+ and LR-) for
the best cutoff (Youden method) and for the widely used
cutoff of 12% for Δ
RESP
PP [2]. The values of 5 and 10 for
LR+ (or 0.2 and 0.1 for LR-) helped to divide the continu-
ous scale of likelihood ratios into three categories: weak,
good and strong evidence of discriminative power [25].
AUC values in subgroups of patients were compared
[26]. P < 0.05 was considered statistically significant. All
statistical tests were two-tailed and performed using
MedCalc software (Mariakerke, Belgium) and Statview
software (SAS Institute, Cary, NC, USA).
Results
Sixty-five patients were included (Table 1). The mean
LSCs of CO measurements were 6.7% and 6.5% at
baseline and after volume expansion, respectively, and
all responders exhibited individual CO changes from
baseline to after volume expansion greater t han their
individual LSCs. Administration of catecholamine was
the sole criterion triggering inclusion in 14 patients
Table 1 Main characteristics of the patients at the time
of inclusion
a
Patient characteristic Data
Age, yr 59 ± 15
Sex, male/female 45/20
SAPS II score 56 ± 19
Main diagnosis at admission, n
Septic shock 28
Acute respiratory failure 12
Other 25
Delay between admission and study
inclusion, n (%)
<24 hours 42 (65%)
24 to 48 hours 12 (18%)
>48 hours 11 (17%)
Ramsay score 5 versus 6, n 14 versus 51
Responders using 10% versus 15% CO change to
define fluid responsiveness, n (%)
26 (40%) versus 21
(32%)
Arterial lactate concentration, mM/l (n = 61) 3.0 ± 2.5
Arterial lactate concentration >2.5 mM/l, n (%) 25 (38%)
Urine output during the past hour, ml/kg 0.8 ± 0.8
Urine output during the last hour <0.5 ml/kg, n (%) 22 (34%)
Skin mottling, n (%) 22 (34%)
Catecholamine infusion, n (%) 59 (91%)
Norepinephrine, μg/kg/min (n = 53) 0.76 ± 0.88
Epinephrine, μg/kg/min (n = 10) 0.59 ± 0.49
Dobutamine, μg/kg/min (n = 20) 13 ± 10
CO measured by PiCCO™/versus pulmonary artery
catheter, n (%)
32 (49%)/33 (51%)
Arterial catheter site, femoral versus radial, n (%) 51 (78%)/14 (22%)
PEEPt, cmH
2
O 8.5 ± 3.2
Plateau pressure, cmH
2
O 21.2 ± 5.0
Driving pressure (plateau pressure - PEEPt cmH
2
O) 13.7 ± 4.1
Alveolar to vascular pressure transmission index (n
= 33) [20]
0.39 ± 0.17
Respiratory changes in PAOP, mmHg (n = 33) 4.8 ± 2.0 (range, 2
to 9)
Tidal volume, ml 457 ± 67
Tidal volume indexed to measured versus
predicted body weight, ml/kg
6.5 ± 1.4 versus
6.9 ± 0.95
Respiratory system static compliance, ml/cmH
2
O 40.4 ± 15.8
RR, cycles/minute 24 ± 6
HR:RR ratio 4.5 ± 1.6
I:E ratio, % 31 ± 6
PaO
2
:FiO
2
ratio, mmHg 136 ± 50
a
SAPS, simplified acute physiology score II; CO, cardiac output; PEEPt; total
positive end-expiratory pressure; PAOP, pulmonary artery occlusion pressure; I:
E, inspiration length:expiration length ratio. HR:RR, heart rate:respiratory rate
ratio.
Quantitative variables are expressed as mean ± SD.
Lakhal et al. Critical Care 2011, 15:R85
/>Page 3 of 11
(22%): norepinephrine (n = 13, 0.40 ± 0.46 μg/kg/min)
or epinephrine (n =1,0.26μg /kg/min). Volume expan-
sion was interrupted in two patients after 300-ml intol-
erance (one because o f a 6% drop in SpO
2
and one
because of an increased EVLWi >22 ml/kg). Data after
300-ml volume expansion w ere used for analysis of
these two patients. Hemodynamic parameters at baseline
and their evolution after volume expansion are detailed
in Table 2. The proportion of responders, the Simplified
Acute Physiology Score II, baseline mean arterial pres-
sure,HR,CO,andΔ
RESP
PP were similar between cen-
ters (all P > 0.05).
Predictive performance
Δ
RESP
PP was associated with an AUC of 0.75 (95% con-
fidence interval (CI
95
): 0.62 to 0.85) and a best cutoff
value of 5% (LR+ and LR- of 4.8 (CI
95
: 3.6 to 6.2) and
0.32 (CI
95
: 0.1 to 0.8), respectively) (Table 3 and Figures
1 and 2). The common 12% cutoff [2,17] was associated
with LR+ and LR- values of 2 (CI
95
: 0.8 to 4.9) and 0.92
(CI
95
: 0.3 to 2.8), respectively.
Adjusting Δ
RESP
PP for various estimates of extramural
vascular pressure variations (Δ
RESP
PP/Pplat, Δ
RESP
PP/
driving pressure, and Δ
RESP
PP/Vt ratios) did not lead to
major improvement in predictive performance (Figure
3). In the 33 carriers of a pulmonary artery catheter,
Δ
RESP
PP/ΔPAP and Δ
RESP
PP/ΔPAOP were associated
with AUCs of 0.79 (CI
95
: 0.61 to 0.92) and 0.81 (CI
95
:
0.64 to 0.93), respectively. Figures 2 and 3 show the
important overlap of baseline values of each index
between responders and nonresponders.
With the purpose of identifying a subpopulation in
which Δ
RESP
PP might achieve better results, we per-
formed a subgroup analysis. In case of respiratory
variationinPAOPaboveitsmedianvalue(>4mmHg),
Δ
RESP
PP was associated with an AUC of 1 (CI
95
:0.73to
1) as compared with 0.79 (CI
95
: 0 .52 to 0.94) otherwise
(P = 0.07), with a marked decrease of the visual overlap
of baseline values of Δ
RESP
PP between responders and
nonresponders (Figure 4A). Dividing our whole popula-
tion according to t he median value of airway driving
pressure (10 c mH
2
O) did not lead to marked difference
in AUC and/or in the visual overlap (Figure 4B).
Overall, Δ
RESP
PP perf ormed similarly in the subgroups
of patients according to respiratory system compliance,
norepinephrine dosage, administration of neuromuscular
blocking agents (n = 26), site of the arterial catheter
(radial (n = 14) or femoral (n = 51)) (Additional file 1).
SPV (n = 65), dDown (n = 45), CVP (n = 65), PAOP
(n = 33) and PAOPtm (n = 33) were associated with an
AUC below 0.78 (Figure 2). All the results were similar
when using a 15% relative or a 300 ml/min/m
2
absolute
cutoff for volume expansion-induced increase in CO to
define fluid responsiveness (Table 3 and Additional file
1, Figures S1 and S2). Among the 40 patients whose
CVP increased by ≥2 mmHg after 300-ml fluid loading,
none of the 28 nonresponders after 300 ml responded
to the additional 200-ml fluid loading.
Discussion
The main finding of this large multicenter study of 65
shocked ARDS patients with neither arrhythmia nor
spontaneous respiratory activity is that the performance
of Δ
RESP
PP is poor in this clinical situation. Because
fluid responsiveness prediction is of utmost importance
in ARDS, we attempted unsuccessfully to improve
Δ
RESP
PP performance by (1) its indexation, (2) analyzing
different cutoffs for Δ
RESP
PP or fluid responsiveness
Table 2 Hemodynamic parameters at baseline and after 500 ml volume expansion
a
Before volume expansion After volume expansion
Hemodynamic parameter Responders Nonresponders Responders Nonresponders
Heart rate, beats/min 101 ± 25 99 ± 24 98 ± 25
c
95 ± 23
c
Arterial pressure, mmHg 68 ± 12 73 ± 12 80 ± 16
c
80 ± 14
c
Central venous pressure, mmHg 9.5 ± 4.3 11.8 ± 4.4
b
12.3 ± 4.8
c
15.6 ± 4.8
c
PAOP, mmHg (n = 33) 9.6 ± 3.3 13.2 ± 3.7
b
14.9 ± 6.1
c
17.5 ± 3.7
c
Transmural PAOP (n = 33) [20] 6.2 ± 3.8 10.1 ± 3.9
b
10.9 ± 6.5
c
14.2 ± 4.1
c
pulse pressure (mmHg) 49 ± 14 56 ± 14
b
64 ± 18
c
59 ± 16
Δ
RESP
PP, % 7.4 ± 5.2 3.8 ± 4.2
b
4.9 ± 4.2
c
2.9 ± 3
dDown, mmHg (n = 45) 6.5 ± 4.4 1.8 ± 2.5
b
1.9 ± 5.4
c
1.2 ± 1.6
SPV, mmHg 5.7 ± 4.3 2.8 ± 2.8
b
4.8 ± 3.2
c
2.2 ± 1.6
Pulmonary arterial pressure, mmHg (n = 33) 25 ± 6 29 ± 5
b
29 ± 7
c
35 ± 6
c
Cardiac index, l/min/m
2
3.3 ± 1.5 3.6 ± 1.4 4.2 ± 1.8
c
3.5 ± 1.4
a
PAOP, pulmonary artery occlusion pressure; Δ
RESP
PP, respiratory variations of pulse pressure; dDown, difference between the average, over three consecutive
respiratory cycles, of the minimal value of systolic blood pressure during a respiratory cycle and the value of systolic blood pressure during apnea; SPV,
respiratory changes in systolic arterial pressure over three consecutive respiratory cycles;
b
P < 0.05 (responders versus nonresponders);
c
P < 0.05 for comparison
between before and after volume expansion.
Quantitative variables are expressed as mean ± SD.
Lakhal et al. Critical Care 2011, 15:R85
/>Page 4 of 11
definition or (3) identifying subgroups where Δ
RESP
PP
may perform better.
Huang et al.’s study [17], including 22 patients, speci-
fically addressed the issue of Δ
RESP
PP performance in
ARDS and reported a similar AUC (0.77) for Δ
RESP
PP as
in our population (0.75 (CI
95
:0.62to0.085)).Inour
study, the AUC was not good, as the lower bound of
the 95 % confidence interval was below 0.75 [27]. Partly
because confidence intervals for AUCs were not
reported in Huang et al.’s study [17], it was considered
that these authors’ conclusion (that Δ
RESP
PP remains a
reliable predictor of fluid responsi veness for ARDS
patients ventilated with low Vt and high PEEP) was a
misinterpretation [28,29]. In a large, multicenter popula-
tion of ARDS patients, our results are similar to those
of De Backer et al. [10], who found, in 33 patient s (97%
ARDS patients) receiving Vt <8 ml/kg, that Δ
RESP
PP did
not perform better than PAOP. Other authors also
observed this low performance of Δ
RESP
PP in case of
low Vt. One can reasonably assume that many patients
in those studies had ARDS, despite the lack of specific
subgroup analysis [11,30]. Again, the complex pathophy-
siology of transmission of airway pressure changes to
intrathoracic vascular structures [12,14,15] justified ana-
lyzing specifically the performance of Δ
RESP
PP in ARDS
patients.
Interestingly, our mean Δ
RESP
PP was low at baseli ne
(5.2%) compared with most studies exhibiting values
close to 12% [2] (6% to 10% in ARDS patients [10,17]).
Many causes can be identified to explain this low base-
line Δ
RESP
PP value. First, it may be a consequence of
including patients already resuscitated. Indeed, large
volume expansion before inclusion (not recorded) may
explain the low variations in blood pressure waveform
we observed. However, despite this initial resuscitation,
40% of our patients were still fluid responders. Second,
as previously shown [7,8,10,11], the low Δ
RESP
PP may
also be related to the low Vt used in our population (6.9
±0.95ml
-1
kg
-1
) compared with other studies reporting
values of at least 8 ml
-1
kg
-1
[1,4,31-36]. Third, beyond
their Vt dependency, breath-related indices also depend
on the RR, and more specifically on the HR:RR ratio
[16]. Again, our respiratory settings (RR, 24 ± 6/minute;
HR:RR ratio, 4.5 ± 1.6) differed from those previously
reported, with values ranging from 8 to 17/minute for
mean RR and from 5 to 8 for mean HR:RR ratio
[8,31-33,36]. It is noteworthy that these two limitations
of Δ
RESP
PP (low Vt and high RR) o ften come together
in particular in case of ARDS. Figure 5 illustrates the
impact of Vt and HR:RR ratio on Δ
RESP
PP in our
population.
Beyond these limitations (low Vt and high RR) causing
false-negative cases of Δ
RESP
PP, false-positive cases may
also arise because of a common phenomenon during
ARDS: pulmonary artery hypertension [37,38] and/or
right ventricular dysfunction [39]. We only searched for
marked ultrasonographic signs of acute cor pulmonale
(arrows in Figure 1). Performing more sophisticated
measurements of right ventricular function (for example,
peak systolic velocity of tricuspid annular motion) would
have sensitized the detection of this restriction for
Δ
RESP
PP usefulness [39]. It is noteworthy that pulmon-
ary artery hypertension and/or right ventricular failure
maybeanevenmorefrequentlimitationofΔ
RESP
PP i n
case of later or more severe ARDS (PaO2/FiO2 <70)
than patients whom we included.
Moreover, changes in chest wall compliance may also
affect Δ
RESP
PP, posit ively or negatively. Decreased chest
Table 3 Predictive performance of Δ
RESP
PP according to chosen cutoff and fluid responsiveness definition
a
Definition of fluid
responsiveness
Increase in CO >10% after
volume expansion
Increase in CO >15% after
volume expansion
Increase in CO >300 ml/min/m
2
after volume expansion
AUC for Δ
RESP
PP 0.75 (0.62 to 0.85) 0.75 (0.63 to 0.85) 0.76 (0.63 to 0.84)
Cutoff for Δ
RESP
PP 12% 5%
b
12% 5%
b
12% 4%
b
LR+ 2
(0.8 to 4.9)
4.8
(3.6 to 6.2)
2.8
(1.2 to 6.8)
3.7
(2.8 to 4.9)
4.5
(2.2 to 9.5)
3.5
(2.6 to 4.7)
LR- 0.92
(0.3 to 2.8)
0.32
(0.1 to 0.8)
0.87
(0.3 to 2.6)
0.30
(0.1 to 0.8)
0.87
(0.1 to 6.0)
0.46
(0.2 to 1.1)
Se 0.15
(0.05 to 0.35)
0.73
(0.52 to 0.88)
0.19
(0.06 to 0.42)
0.76
(0.53 to 0.92)
0.16
(0.06 to 0.32)
0.62
(0.45 to 0.78)
Sp 0.92
(0.79 to 0.98)
0.85
(0.70 to 0.94)
0.93
(0.81 to 0.99)
0.80
(0.65 to 0.90)
0.96
(0.82 to 0.99)
0.82
(0.63 to 0.94)
PPV 0.57
(0.20 to 0.88)
0.76
(0.54 to 0.90)
0.57
(0.20 to 0.88)
0.64
(0.43 to 0.81)
0.86
(0.42 to 0.98)
0.82
(0.63 to 0.94)
NPV 0.62
(0.48 to 0.74)
0.83
(0.67 to 0.92)
0.71
(0.57 to 0.82)
0.88
(0.72 to 0.95)
0.47
(0.33 to 0.60)
0.62
(0.45 to 0.7)
a
CO, cardiac output; AUC, area under the receiver operating characteristic curve; Δ
RESP
PP, respiratory changes in pulse pressure; LR+, positive likelihood ratio; LR-,
negative likelihood ratio; Se, sens itivity; Sp, specificity; PPV; positive predictive value; NPV, negative predictive value;
b
best cutoff identified in our study
population. Ranges in parentheses represent 95% confidence intervals.
Lakhal et al. Critical Care 2011, 15:R85
/>Page 5 of 11
wall compliance, observed in cases of intraabdominal
hypertension (extrapulmonary ARDS) [40] increases
respiratory pleural pressure variations for a given Vt
[14,15]. Thus, Δ
RESP
PP may be higher and present false-
positive results in this situation. At the opposite, chest wall
compliance may be increased through the use of muscle
relaxants, which was the case in 40% of our patients, and
then induce reduced intrathoracic pressure swings and
therefore potential false-negative Δ
RESP
PP results. The lack
of measurement of chest wall compliance in our patients
(that is, no esophageal pressur e measurement) precluded
precise analysis of this factor. Nevertheless, using PAOP as
a surrogate for esophageal pressure measurements, we
performed some physiological analysis which allowed us
to gain some insight into this issue.
Our findings do not confirm the hypot hesis according
to which, owing to ARDS-induced decrease in lung
compliance, a small Vt (<8 ml/kg) may cause sufficie nt
changes in intrathoracic pressure, allowing Δ
RESP
PP to
perform well in this population [13]. Actually, ARDS-
induced increase in lung stiffness is indeed associated
with an increased airway driving pressure (by increased
Pplat) for a given Vt [14], but the primary determinants
of pleural pressure variations (and then of Δ
RESP
PP)
have been shown to be the magnitude of Vt and chest
wall compliance (both of them ruling the compression
of the cardiovascular structures), regardless of lung
compliance [14]. Indeed, using changes in PAOP as a
surrogate for pleural pressure variations [41], we found
that Δ
RESP
PP tended to perform markedly better in
patients with high ΔPAOP (Figure 4A), illustrating the
importance of high Vt and low chest wal l compliance
for Δ
RESP
PP to be useful. Indeed, in our analysis (with
the limits of using ΔPAOP as a surrogate), respirator y
changes in PAOP represent the r atio of Vt/chest wall
compliance (detailed calculation in Additional file 1).
The rather goo d AUC (0 .81 (CI
95
: 0.64 to 0.93)) that
we found for Δ
RESP
PP/ΔPAOP (in the subset of Swan-
Ganz catheter carriers) suggests that a more precise
approach of pleural pressure swings may be a more
interesting way to correct the crude Δ
RESP
PP and to
improve its predictive ability. Not surprisingly, and a s
previously reported in case of low Vt [11], no improve-
ment was observed in Δ
RESP
PP performance when it
was corrected for airway driving pressure. Moreover,
there was no marked evidence of better performance of
Δ
RESP
PP in cases of high airw ay driving pressure (Figure
4B), reminding us that this parameter is not a major
determinant of Δ
RESP
PP.
Our ARDS patients exhibited higher values of respira-
tory system static compliance (total of lung and chest
wall compliance) than values usually reported in ARDS
patients(40versus26to30ml/cmH
2
O) [10,17,42].
There are three potential explanations for this difference:
(1) because the PEEP level was not fixed by protocol,
some patients may have had PEEP levels high enough to
optimize recruitment and respiratory compliance [42];
(2) patients were studied at the early phase of ARDS
(Table 1), and lung compliance is classically lower in late
ARDS; and 3) we did not include the patient s with the
most severe cases of ARDS (PaO
2
:FiO
2
ratio <70) for
safety reasons. Of note, Δ
RESP
PP showed similar perfor-
mance in patients with respiratory system static compli-
ance below or above its median value (Additional fil e 1),
preventing the use of this parameter to identify patients
in whom Δ
RESP
PP might perform better. Because of
high er respiratory system compliance, our airway driving
pressur e was in the lower reported ran ge (13.7 versus 14
to 17 cmH
2
O) [10,17,42]. However, our mean Vt va lue
was slightly higher (6.9 versus 6.3 to 6.4 ml/kg)
[10,17,42] . Again , as Δ
RESP
PP is mostl y influenced by the
Vt rather than the airway driving pressure [7,10,14], one
would have expected even better performance of Δ
RESP
PP
than that reported in similar previous works.
In our population, the best cutoff value for Δ
RESP
PP
was 5%, that is, close to that previously reported in
ARDS patients with low Vt [10]. Another explanation
for the poor ability of Δ
RESP
PP to predict fluid respon-
siveness may be that this low cutoff exposes it to errors
in measurements because of low signal-to-noise ratio
[12]. Of note, numerical recordings of Δ
RESP
PP in ARDS
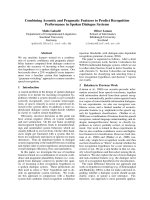
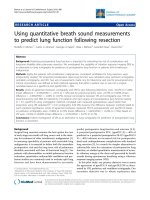
Figure 1 Performance of respiratory changes in pulse pressure
(Δ
RESP
PP) in the whole shocked acute respiratory distress
syndrome (ARDS) population (n = 65). Receiver-operating
characteristic (ROC) curve obtained for Δ
RESP
PP to predict a 10%
increase in cardiac output after 500 ml volume expansion. AUC, area
under the ROC curve. LR+, positive likelihood ratio. LR-, negative
likelihood ratio.
Lakhal et al. Critical Care 2011, 15:R85
/>Page 6 of 11
patients [10,17] did not lead to better performance than
using high-resolution paper tracings, as we did.
For the same reasons developed for Δ
RESP
PP, we found
that the other breath-related, blood pressure-derived
indices, dDown and SPV, were of similar poor perfor-
mance in predicting fluid responsiveness in our ARDS
population. Before using fluid responsiveness prediction
tools, one has to identify patients who may actually benefit
from having their CO increased by fluids. In an overall
population, many fluid responders actually do not need
any fluids (that is, no need for an increase in CO). All of
our patients were in acute circulatory failure and most
presented signs of tissular hypoperfusion (oliguria in 34%,
mottled skin in 34% and hyperlactatemia in 38%), suggest-
ingthattheymaybenefitfromvolumeexpansion,but
baseline CVP (11 ± 4 mmHg) and PAOP (12 ± 4 mmHg)
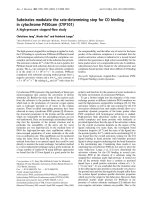
Figure 2 Individual values of baseline static and breath-derived indices in responders and nonresponders. CVP, central venous pressure;
PAOP; pulmonary artery occlusion pressure; PAOPtm, transmural pulmonary artery occlusion pressure (see Materials and methods section for
details) [20]; Δ
RESP
PP, respiratory changes in arterial pulse pressure; dDown, expiratory decrease in systolic arterial pressure; SPV, respiratory
changes in systolic arterial pressure; AUC, area under the receiver-operating characteristic curve. Responders are defined as patients increasing
their cardiac output by at least 10% after a 500-ml volume expansion. The arrows show patients with acute cor pulmonale (see Materials and
methods section for definition).
Lakhal et al. Critical Care 2011, 15:R85
/>Page 7 of 11
were unhelpful (Figure 2) [43]. It is precisely in these
patients, that is, those with persistent circulatory failure
despite initial resuscitation, that other indices are required;
but Δ
RESP
PP is disappointing in patients with ARDS. In
this situation, a fluid challenge may be performed [44].
Thus, during volume expansion, an increase in CVP ≥2
mmHg is considered to reflect that the Frank-Starling
mechanism of the heart has been tested [43]. Interestingly,
among the 40 patients who fulfilled this CVP change cri-
terion after 300-ml volume expansion, none of the 28
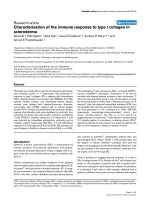
Figure 3 Individual values of baseline respiratory changes in arterial pulse pressure (Δ
RESP
PP) corrected for surrogates of res piratory
variations in pleural pressure. Vt, tidal volume; driving pressure, airway plateau pressure minus total end-expiratory pressure; ΔPAOP:
respiratory changes in pulmonary artery occlusion pressure; ΔPAP, respiratory changes in pulmonary artery pressure; AUC, area under the
receiver-operating characteristic curve. Responders are defined as patients increasing their cardiac output of at least 10% after 500-ml volume
expansion.
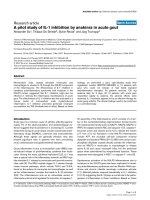
Figure 4 Individual values of baseline Δ
RESP
PP according to volume responsiveness status and to either respiratory change in PAOP
(ΔPAOP) or airway driving pressure. For the purpose of this physiological analysis, patients with ultrasonographic signs of acute cor pulmonale
were excluded. The central boxes represent the values from the lower to the upper quartile (25th to 75th percentile). The middle line represents
the median. Δ
RESP
PP, respiratory changes in pulse pressure to predict a 10% increase in cardiac output after 500-ml volume expansion; AUC, area
under the receiver-operating characteristic curve. (A) Analysis of the 33 patients with a pulmonary artery catheter. Median for respiratory changes
in pulmonary artery occlusion pressure (PAOP) was 4 mmHg. Respiratory change in PAOP equals tidal volume (Vt) divided by chest wall
compliance (see Additional file 1 for detailed calculations). Therefore, patients represented in the right part of the figure are those combining a
higher Vt and lower chest wall compliance. (B) The median airway driving pressure was 10 cmH
2
O(n = 59).
Lakhal et al. Critical Care 2011, 15:R85
/>Page 8 of 11
nonresponder patients responded after 300 ml to the addi-
tional 200-ml volume expansion. Therefore, performing
careful fluid challenges while monitoring both CVP and
CO may be a safe way to limit undue fluid loading during
ARDS.
Conclusions
In our population of patients with early ARDS who were
receiving protective mechanical ventilation, partly
because of insufficient changes in pleural pressure,
Δ
RESP
PP performed poorly in predicting fluid respon-
siveness. Fluid management in patients with ARDS may
rely on fluid challenges.
Key messages
• Respiratory variations of pulse pressure (Δ
RESP
PP)
perform poorly in predicting fluid responsiveness in
patients with ARDS.
• Both low tidal volume (by decreasing respiratory
pleural pressure changes) and low HR:RR ratio
downplay the performance of Δ
RESP
PP.
• Respiratory changes in pleural pressure, but not
airway driving pressure, are the main de terminant of
Δ
RESP
PP.
• No simple means of improving Δ
RESP
PP perfor-
mance was found.
• Because optimal fluid management is of utmost
importance in ARDS patients, clinicians have t o rely
on other means, such as fluid challenges, for this
purpose.
Additional material
Additional file 1: Additional data and figures. Impact of several
clinical factors on the performance of Δ
RESP
PP: subgroup comparisons
according to respiratory system compliance, norepinephrine dosage,
neuromuscular blocking agent use and site of the artery catheter. Impact
of the definition of fluid responsiveness on the performance of Δ
RESP
PP,
individual values of baseline static and breath-derived indices in
responders and nonresponders using the 15% cutoff for cardiac output
to define fluid responsiveness, performance of Δ
RESP
PP using the 15%
cutoff for cardiac output to define fluid responsiveness. Impact of chest
wall compliance on Δ
RESP
PP provides additional comments to Figure 4.
AUC, area under the receiver-operating characteristic curve; Δ
RESP
PP,
respiratory changes in pulse pressure.
Abbreviations
Δ
RESP
PP: respiratory variations in pulse pressure; ΔPAP: respiratory changes in
pulmonary artery pressure; ΔPAOP: respiratory changes in pulmonary artery
occlusion pressure; ARDS: acute respiratory distress syndrome; AUC: area
under the receiver-operating characteristic curve; CO: cardiac output; CVP:
central venous pressure; dDown: difference between the average, over three
consecutive respiratory cycles, of the minimal value of systolic blood
pressure during a respiratory cycle and the value of systolic blood pressure
during apnea; HR: heart rate; LR+: positive likelihood ratio; LR: negative
likelihood ratio; LSC: least significant change; PAOP: pulmonary artery
occlusion pressure; PAOPtm: transmural pulmonary artery occlusion pressure;
PEEP: positive end-expiratory pressure; Pplat: plateau pressure; RR: respiratory
rate; SPV: respiratory changes in systolic arterial pressure over three
consecutive respiratory cycles; Vt: tidal volume.
Acknowledgements
This study was supported by Projet Hospitalier de Recherche Clinique grant
PHRC R10-5, centre hospitalier d’Orléans, France, September 2004.
Author details
1
Service de réanimation médicale et maladies infectieuses, Hôpital Bichat-
Claude Bernard, Assistance Publique des Hôpitaux de Paris, 18 rue Henri
Huchard, F-75018 Paris, France.
2
Service de réanimation médicale
polyvalente, centre hospitalier régional universitaire de Tours, 2 boulevard
Tonnelé, F-37044 Tours, France.
3
Service de réanimation médicale, Hôpital La
Source, centre hospitalier régional, avenue de l’Hôpital, F-45067 Orlé ans
cedex 1, France.
Authors’ contributions
KL, SE and TB contributed to the conception and design of the study. KL, SE,
DBL, IR, EM, PFD, AL and TB contributed to the acquisition of data. KL, SE,
MW, BR and TB contributed to the drafting and revision of the manuscript.
Competing interests
The authors declare that they have no competing interests.
Figure 5 Baseline Δ
RESP
PPaccordingtoVtandHR:RRratio.
Beyond chest wall compliance, Δ
RESP
PP is influenced by Vt [10], HR:
RR ratio [16] and fluid responsiveness status. This is confirmed in our
study population by using a composite index including these
respiratory settings: Vt × HR:RR ratio. Two-way analysis of variance
disclosed that the product of Vt × HR:RR ratio and the responder
versus nonresponder status independently influenced the value of
Δ
RESP
PP (P = 0.0013 and P = 0.0014, respectively). The results of post
hoc tests (Fisher’s procedure of least significant difference) between
quartiles of (Vt × HR:RR ratio) are shown. With regard to the need
for this physiological analysis, patients with ultrasonographic
evidence of acute cor pulmonale (n = 4) were excluded. Vt, tidal
volume; HR, heart rate. RR, respiratory rate; Δ
RESP
PP, respiratory
changes in pulse pressure. Responders are defined as those patients
with a 10% increase in cardiac output after 500-ml volume
expansion. The central boxes represent the values from the lower to
the upper quartile (25th to 75th percentile). The middle line
represents the median value.
Lakhal et al. Critical Care 2011, 15:R85
/>Page 9 of 11
Received: 2 January 2011 Revised: 2 February 2011
Accepted: 7 March 2011 Published: 7 March 2011
References
1. Michard F, Boussat S, Chemla D, Anguel N, Mercat A, Lecarpentier Y,
Richard C, Pinsky MR, Teboul JL: Relation between respiratory changes in
arterial pulse pressure and fluid responsiveness in septic patients with
acute circulatory failure. Am J Respir Crit Care Med 2000, 162:134-138.
2. Marik PE, Cavallazzi R, Vasu T, Hirani A: Dynamic changes in arterial
waveform derived variables and fluid responsiveness in mechanically
ventilated patients: a systematic review of the literature. Crit Care Med
2009, 37:2642-2647.
3. Lakhal K, Ehrmann S, Runge I, Benzekri-Lefèvre D, Legras A, Dequin PF,
Mercier E, Wolff M, Régnier B, Boulain T: Central venous pressure
measurements improve the accuracy of leg raising-induced change in
pulse pressure to predict fluid responsiveness. Intensive Care Med 2010,
36:940-948.
4. Monnet X, Rienzo M, Osman D, Anguel N, Richard C, Pinsky MR, Teboul JL:
Passive leg raising predicts fluid responsiveness in the critically ill. Crit
Care Med 2006, 34:1402-1407.
5. Malhotra A: Low-tidal-volume ventilation in the acute respiratory distress
syndrome. N Engl J Med 2007, 357:1113-1120.
6. Heart National, Lung, and Blood Institute Acute Respiratory Distress
Syndrome (ARDS) Clinical Trials Network, Wiedemann HP, Wheeler AP,
Bernard GR, Thompson BT, Hayden D, deBoisblanc B, Connors AF Jr,
Hite RD, Harabin AL: Comparison of two fluid-management strategies in
acute lung injury. N Engl J Med 2006, 354:2564-2575.
7. Reuter DA, Bayerlein J, Goepfert MS, Weis FC, Kilger E, Lamm P, Goetz AE:
Influence of tidal volume on left ventricular stroke volume variation
measured by pulse contour analysis in mechanically ventilated patients.
Intensive Care Med 2003, 29:476-480.
8. Charron C, Fessenmeyer C, Cosson C, Mazoit JX, Hebert JL, Benhamou D,
Edouard AR: The influence of tidal volume on the dynamic variables of
fluid responsiveness in critically ill patients. Anesth Analg 2006,
102:1511-1517.
9. Renner J, Cavus E, Meybohm P, Tonner P, Steinfath M, Scholz J, Lutter G,
Bein B: Stroke volume variation during hemorrhage and after fluid
loading: impact of different tidal volumes. Acta Anaesthesiol Scand 2007,
51:538-544.
10. De Backer D, Heenen S, Piagnerelli M, Koch M, Vincent JL: Pulse pressure
variations to predict fluid responsiveness: influence of tidal volume.
Intensive Care Med 2005, 31:517-523.
11. Vallée F, Richard JC, Mari A, Gallas T, Arsac E, Verlaan PS, Chousterman B,
Samii K, Genestal M, Fourcade O: Pulse pressure variations adjusted by
alveolar driving pressure to assess fluid responsiveness. Intensive Care
Med 2009, 35:1004-1010.
12. Lefrant JY, De Backer D: Can we use pulse pressure variations to predict
fluid responsiveness in patients with ARDS? Intensive Care Med 2009,
35:966-968.
13. Teboul JL, Vieillard-Baron A: Clinical value of pulse pressure variations in
ARDS: still an unresolved issue? Intensive Care Med 2005, 31:499-500.
14. Romand JA, Shi W, Pinsky MR: Cardiopulmonary effects of positive
pressure ventilation during acute lung injury.
Chest 1995, 108:1041-1048.
15.
Perel A, Pizov R, Cotev S: Systolic blood pressure variation is a sensitive
indicator of hypovolemia in ventilated dogs subjected to graded
hemorrhage. Anesthesiology 1987, 67:498-502.
16. De Backer D, Taccone FS, Holsten R, Ibrahimi F, Vincent JL: Influence of
respiratory rate on stroke volume variation in mechanically ventilated
patients. Anesthesiology 2009, 110:1092-1097.
17. Huang CC, Fu JY, Hu HC, Kao KC, Chen NH, Hsieh MJ, Tsai YH: Prediction of
fluid responsiveness in acute respiratory distress syndrome patients
ventilated with low tidal volume and high positive end-expiratory
pressure. Crit Care Med 2008, 36:2810-2816.
18. Lakhal K, Ehrmann S, Runge I, Legras A, Dequin PF, Mercier E, Wolff M,
Régnier B, Boulain T: Tracking hypotension and dynamic changes in
arterial blood pressure with brachial cuff measurements. Anesth Analg
2009, 109:494-501.
19. Bernard GR, Artigas A, Brigham KL, Carlet J, Falke K, Hudson L, Lamy M,
Legall JR, Morris A, Spragg R: The American-European Consensus
Conference on ARDS: definitions, mechanisms, relevant outcomes, and
clinical trial coordination. Am J Respir Crit Care Med 1994, 149:818-824.
20. Teboul JL, Pinsky MR, Mercat A, Anguel N, Bernardin G, Achard JM,
Boulain T, Richard C: Estimating cardiac filling pressure in mechanically
ventilated patients with hyperinflation. Crit Care Med 2000, 28:3631-3636.
21. Teboul JL, Besbes M, Andrivet P, Axler O, Douguet D, Zelter M, Lemaire F,
Brun-Buisson C: A bedside index assessing the reliability of pulmonary
occlusion pressure measurements during mechanical ventilation with
positive end-expiratory pressure. J Crit Care 1992, 7:22-29.
22. Ostergaard M, Nilsson LB, Nilsson JC, Rasmussen JP, Berthelsen PG:
Precision of bolus thermodilution cardiac output measurements in
patients with atrial fibrillation. Acta Anaesthesiol Scand 2005, 49:366-372.
23. Lodder MC, Lems WF, Ader HJ, Marthinsen AE, van Coeverden SC, Lips P,
Netelenbos JC, Dijkmans BA, Roos JC: Reproducibility of bone mineral
density measurement in daily practice. Ann Rheum Dis 2004, 63:285-289.
24. Magder S, Bafaqeeh F: The clinical role of central venous pressure
measurements. J Intensive Care Med 2007, 22:44-51.
25. Grimes DA, Schulz KF: Refining clinical diagnosis with likelihood ratios.
Lancet 2005, 365:1500-1505.
26. Hanley JA, McNeil BJ: The meaning and use of the area under a receiver
operating characteristic (ROC) curve. Radiology 1982, 143:29-36.
27. Ray P, Le Manach Y, Riou B, Houle TT: Statistical evaluation of a
biomarker. Anesthesiology 2010, 112:1023-1040.
28. Journois D, Squara P: Back
to “belief-based medicine” because of receiver
operating characteristic curves? Crit Care Med 2009, 37:1532-1533.
29. Payen D, Vallée F, Mari A, Richard JC, De Backer D: Can pulse pressure
variations really better predict fluid responsiveness than static indices of
preload in patients with acute respiratory distress syndrome? Crit Care
Med 2009, 37:1178.
30. Muller L, Louart G, Bousquet PJ, Candela D, Zoric L, de La Coussaye JE,
Jaber S, Lefrant JY: The influence of the airway driving pressure on
pulsed pressure variation as a predictor of fluid responsiveness. Intensive
Care Med 2010, 36:496-503.
31. Vieillard-Baron A, Chergui K, Rabiller A, Peyrouset O, Page B, Beauchet A,
Jardin F: Superior vena caval collapsibility as a gauge of volume status in
ventilated septic patients. Intensive Care Med 2004, 30:1734-1739.
32. Cannesson M, Attof Y, Rosamel P, Desebbe O, Joseph P, Metton O,
Bastien O, Lehot JJ: Respiratory variations in pulse oximetry
plethysmographic waveform amplitude to predict fluid responsiveness
in the operating room. Anesthesiology 2007, 106:1105-1111.
33. Cannesson M, Slieker J, Desebbe O, Farhat F, Bastien O, Lehot JJ: Prediction
of fluid responsiveness using respiratory variations in left ventricular
stroke area by transoesophageal echocardiographic automated border
detection in mechanically ventilated patients. Crit Care 2006, 10:R171.
34. Hofer CK, Müller SM, Furrer L, Klaghofer R, Genoni M, Zollinger A: Stroke
volume and pulse pressure variation for prediction of fluid
responsiveness in patients undergoing off-pump coronary artery bypass
grafting. Chest 2005, 128:848-854.
35. Kramer A, Zygun D, Hawes H, Easton P, Ferland A: Pulse pressure variation
predicts fluid responsiveness following coronary artery bypass surgery.
Chest 2004, 126:1563-1568.
36. Preisman S, Kogan S, Berkenstadt H, Perel A: Predicting fluid
responsiveness in patients undergoing cardiac surgery: functional
haemodynamic parameters including the Respiratory Systolic Variation
Test and static preload indicators. Br J Anaesth 2005, 95:746-755.
37. Daudel F, Tüller D, Krähenbühl S, Jakob SM, Takala J: Pulse pressure
variation and volume responsiveness during acutely increased
pulmonary artery pressure: an experimental study. Crit Care 2010, 14:
R122.
38. Wyler von Ballmoos M, Takala J, Roeck M, Porta F, Tueller D, Ganter CC,
Schröder R, Bracht H, Baenziger B, Jakob SM: Pulse-pressure variation and
hemodynamic response in patients with elevated pulmonary artery
pressure: a clinical study. Crit Care 2010, 14:R111.
39. Mahjoub Y, Pila C, Friggeri A, Zogheib E, Lobjoie E, Tinturier F, Galy C,
Slama M, Dupont H: Assessing fluid responsiveness in critically ill
patients: false-positive pulse pressure variation is detected by Doppler
echocardiographic evaluation of the right ventricle. Crit Care Med 2009,
37:2570-2575.
40. Ranieri VM, Brienza N, Santostasi S, Puntillo F, Mascia L, Vitale N, Giuliani R,
Memeo V, Bruno F, Fiore T, Brienza A, Slutsky AS: Impairment
of lung and
chest wall mechanics in patients with acute respiratory distress
syndrome: role of abdominal distension. Am J Respir Crit Care Med 1997,
156:1082-1091.
Lakhal et al. Critical Care 2011, 15:R85
/>Page 10 of 11
41. Bellemare P, Goldberg P, Magder SA: Variations in pulmonary artery
occlusion pressure to estimate changes in pleural pressure. Intensive Care
Med 2007, 33:2004-2008.
42. Briel M, Meade M, Mercat A, Brower RG, Talmor D, Walter SD, Slutsky AS,
Pullenayegum E, Zhou Q, Cook D, Brochard L, Richard JC, Lamontagne F,
Bhatnagar N, Stewart TE, Guyatt G: Higher vs lower positive end-
expiratory pressure in patients with acute lung injury and acute
respiratory distress syndrome: systematic review and meta-analysis.
JAMA 2010, 303:865-873.
43. Antonelli M, Levy M, Andrews PJ, Chastre J, Hudson LD, Manthous C,
Meduri GU, Moreno RP, Putensen C, Stewart T, Torres A: Hemodynamic
monitoring in shock and implications for management. International
Consensus Conference, Paris, France, 27-28 April 2006. Intensive Care Med
2007, 33:575-590.
44. Vincent JL, Weil MH: Fluid challenge revisited. Crit Care Med 2006,
34:1333-1337.
doi:10.1186/cc10083
Cite this article as: Lakhal et al.: Respiratory pulse pressure variation fails
to predict fluid responsiveness in acute respiratory distress syndrome.
Critical Care 2011 15:R85.
Submit your next manuscript to BioMed Central
and take full advantage of:
• Convenient online submission
• Thorough peer review
• No space constraints or color figure charges
• Immediate publication on acceptance
• Inclusion in PubMed, CAS, Scopus and Google Scholar
• Research which is freely available for redistribution
Submit your manuscript at
www.biomedcentral.com/submit
Lakhal et al. Critical Care 2011, 15:R85
/>Page 11 of 11