Báo cáo y học: "Multinational, observational study of procalcitonin in ICU patients with pneumonia requiring mechanical ventilation: a multicenter observational study" pot
Bạn đang xem bản rút gọn của tài liệu. Xem và tải ngay bản đầy đủ của tài liệu tại đây (360.78 KB, 9 trang )
RESEARCH Open Access
Multinational, observational study of
procalcitonin in ICU patients with pneumonia
requiring mechanical ventilation: a multicenter
observational study
Frank Bloos
1
, John C Marshall
2
, Richard P Dellinger
3
, Jean-Louis Vincent
4
, Guillermo Gutierrez
5
, Emanuel Rivers
6
,
Robert A Balk
7
, Pierre-Francois Laterre
8
, Derek C Angus
9
, Konrad Reinhart
1*
, Frank M Brunkhorst
1
Abstract
Introduction: The intent of this study was to determine whether serum procalcitonin (PCT) levels are associated
with prognosis, measured as organ dysfunctions and 28-day mortality, in patients with severe pneumonia.
Methods: This was a multicenter, observational study of critically ill adult patients with pneumonia requiring
mechanical ventilation conducted in 10 academic hospitals in Canada, the United States, and Central Europe. PCT
was measured daily for 14 days using an immuno-luminometric assay.
Results: We included 175 patients, 57 with community acquired pneumonia (CAP), 61 with ventilator associated
pneumonia (VAP) and 57 with hospital acquired pneumonia (HAP). Initial PCT levels were higher in CAP than VAP
patients (median (interquartile range: IQR); 2.4 (0.95 to 15.8) vs. 0.7 (0.3 to 2.15), ng/ml, P < 0.001) but not
significantly different to HAP (2.2 (0.4 to 8.0) ng/ml). The 28-day ICU mortality rate for all patients was 18.3% with a
median ICU length of stay of 16 days (range 1 to 142 days). PCT levels were higher in non-survivors than in
survivors. Initial and maximum PCT levels correlated with maximum Sequential Organ Failure Assessment (SOFA)
score r
2
= 0.50 (95% CI: 0.38 to 0.61) and r
2
= 0.57 (0.46 to 0.66), respectively. Receiver operating curve (ROC)
analysis on discrimination of 28-day mortality showed areas under the curve (AUC) of 0.74, 0.70, and 0.69 for
maximum PCT, initial PCT, and Acute Physiology and Chronic Health Evaluation (APACHE) II score, respectively. The
optimal cut-off to predict mortality for initial PCT was 1.1 ng/ml (odds ratio: OD 7.0 (95% CI 2.6 to 25.2)) and that
for maximum PCT was 7.8 ng/ml (odds ratio 5.7 (95% CI 2.5 to 13.1)).
Conclusions: PCT is associated with the severity of illness in patients with severe pneumonia and appears to be a
prognostic marker of morbidity and mortality comparable to the APACHE II score.
Introduction
Respiratory tract infections requiring mechanical ventila-
tion account for the majority of all infe ctions treated in
the intensive care unit (ICU) and are associated with
prolonged hospital stay and high ICU mortality [1-3].
The Pneumonia Severity Index (PSI) is commonly used
for risk stratification of patients with pneumonia. How-
ever, this parameter showed only moderate association
with outcome prediction and was judged to be inade-
quate to guide clinical care [4].
Numerous studies have evaluated the diagnostic per-
formance of invasive procedures, or of biochemical and
molecular markers in blood or bronchoalveolar lavage
(BAL) in patients with ventilator-associ ated pneumonia
(VAP), hospital acquired pneumonia (HAP) and com-
munity acquired pneumonia (CAP). These methods are
difficult to apply to daily clinical practice and none has
proved to be predictive of outcome [5-8]. Furthermore,
many aspects in the strategies for diagnosing HAP and
VAP especially regarding the importance of invasive
* Correspondence:
1
Department of Anesthesiology and Intensive Care Medicine, Jena University
Hospital, Erlanger Allee 101, 07747 Jena, Germany
Full list of author information is available at the end of the article
Bloos et al. Critical Care 2011, 15:R88
/>© 2011 Bloos et al.; licensee BioMed Central Ltd This is an open access article distributed under the terms of the Creative Commons
Attribution License ( which permits unre stricted use, distri bution, and reproduction in
any medium, provided the original work is pro perly cited
procedures are still controversial [9,10]. Indeed, a recent
study revealed that use of invasive procedures for etiolo-
gical diagnosis of pneumonia varies considerably
between European ICUs [11]. This uncertainty is most
likely responsible for antib iotic overtreatment observed
in this group of patients [12,13]. Thus, measures to aid
the early identification of p atients with pneumonia are
underdeveloped. Such m easures are needed as patients
with pneumonia are at high risk of death and would
benefit from early adaption of therapy.
Procalcitonin (PCT), a relatively novel marker of infec-
tious processes, has been shown to be associated with
the severity of inflammation and prognosis during sepsis
and septic shock [14-16]. In two large studies in the
emergency department, low PCT-values were associated
with a low risk of death in patients with CAP [17,18].
Luyt and colleagues reported that PCT levels decreased
during the clinical cours e of VAP but were significantly
higher from Day 1 to Day 7 in patients with unfavorable
outcomes [19]. The significance of PCT is emphasized
bytheobservationthatthecourseofPCTlevelsmay
safely guide antimicrobial therapy in patients with com-
munity acquired lower respiratory tract infections
[20,21] and ICU patients with suspected bacterial infec-
tions [22]. However, data about the significance of PCT
in patients with hospital and ventilator acquired pneu-
monia requiring intensive care therapy are still limited.
The aim of this multicent er study was to test the
hypothesis that serum PCT levels can assist in identify-
ing patients with severe pneumonia who are at increased
risk of poor outcome, measured as organ dysfunction
and 28-day mortality.
Materials and methods
In this multicenter, multi-national, observational study,
patients admitted consecutively to the ICUs of 10 aca-
demic hospitals (8 in Canada and the United States and
2 in Europe) between 1 January 2003 and 20 November
2004 were screened for eligibility. The study protocol
had been reviewed and approved by the Food and Drug
Administration (protocol PCT-7; file number #
I010023). Patients 18 years of age and older requiring
mechanical ventilation with the new diagnosis of p neu-
monia within the last 48 hours were included. We
excluded pati ents who were enrolled in a clinical study
prior to baseline PCT sampling, had cardiogenic shock,
had burns greater than 20% of total body surface, or
were likely to die within 48 h, and postoperative patients
following bone marrow transplant (within the last 6
months), coronary artery bypass grafts (within the last
7 days), and solid organ transplants (within the last 14
days). Patients were followed for 28 days after discharge
from the ICU. The study was approved by local Institu-
tional Review Boards/Ethics Committees of each
participating institution and informed consent was
obtained from the patients’ next of kin.
Pneumonia was defined as the presence of new or
progressive inf iltrate(s), consolidation, cavit ation, or
pleural effusion on chest radiographs and the new onset
of at least two of the following signs or symptoms:
1) cough; 2) production of purulent sputum or a change
in the character of sputum; 3)auscultatoryfindingson
pulmonary exam of crackles and/or evidence of pulmon-
ary consolidation (dullness on percussion, bronchial
breath sounds); and/or 4) the presence of acute or pro-
gressive dyspnea, tachypnea, or hypoxemia. In addition,
at least one of the following criteria had to be fulfilled
to establish the diagnosis of pneumonia: 1) fever,
defined as body temperature > 38°C (100.4°F) taken
orally; > 38.5°C (101.2°F) tympanically; or > 39° C (102.2°
F) re ctally or via pulmonary artery (PA) catheter; and/or
2) elevated total white blood count (WBC) > 10,000/
mm
3
, or > 15% immature neutrophils (bands), regardless
of total WBC, or leukopenia w ith total WBC < 4,500/
mm
3
. Microscopic examination of the Gram stained
respiratory secretions had to show the presence of
microorganisms, with ≥25 polymorphonuclear cells and
≤10 squamous epithelial cells per field at 1 00× magnifi-
cation (low-power, 10× objective).
CAP [23] was defined as the occurrence of pneumonia
in patients who had not resided in a long-term care
facility for ≥14 days before the onset of symptoms and
did not fulfill criteria of HAP, HAP [24] as pneumonia
diagnosed in hospit alized patients or those residing in a
long-term care facility (> 48 hours), such as a skilled
nursing home facility or rehabilitation unit, or present <
7 days after a patient was discharged from the hospital
with initial hospitalization of ≥3 days duration, and VAP
[25] as pneumonia that developed more than 48 hours
aft er intubation in mechanically ventilated patien ts who
had no clinical evidence suggesting the presence or
likely development of pneumonia at the time of
intubation.
Within 48 hours of enrolment, we sought to establish
a d iagnosis of pneumonia through culture and suscept-
ibility testing of respi ratory secretions obtained by deep
expectoration, nasotracheal aspiration, intubation with
endotracheal suctioning, broncho scopy with BAL or
protected-brush sampling, or transtracheal aspiration.
The diagnosis could also be supported by culture of
samples obtained by percutaneous lung or pleural fluid
aspiration, and/or single diagnostic antibody titer, (IgM),
or a four-fold increase in paired serum samples (IgG)
for the presumed pathogen. Patients with burns greater
than 20% of total body surface, expected death within
48 h, post bone marrow transplant within the last
6 months, cardiogenic shock, cardiovascular bypass
within the last 7 days, solid organ transplant within the
Bloos et al. Critical Care 2011, 15:R88
/>Page 2 of 9
last 14 days, or patients participating in other studies
were excluded.
Keydatawereverifiedbysourcedocuments(hospital
chart). Monitoring w as conducted according to Good
Clinical Practice (GCP) and standard operating proce-
dures for compliance with applicable governm ent regu-
lations and was performed by an independent clinical
research organization.
We recorded demographic data including date of
birth, gender, ethnic origin, weight, and height, type of
pneumonia, and admission Acute Physiology and
Chronic Health Eval uatio n (APACHE) II score at study
enrolment. Organ dysfunction status was assessed daily
as described elsewhere [26] and worst values of each
calendar day were reported. A modified Sequential
Organ Failure Assessme nt (SOFA) sc ore that ex cluded
the Glasgow Coma Scale (GCS) was utilized.
PCT samples were collected for 14 days or until
patients were discharged from the ICU and/or no longer
required any mechanical ventilatory support. Blood sam-
plesnotexpectedtobeanalyzedwithin24hofcollec-
tion were frozen at -20°C f or later analysis. PCT w as
measur ed using an immunoluminometric assay (LUMIt-
est
®
; BRAHMS GmbH, Hennigsdorf, G ermany). PCT
levels were not available to the investigators until com-
pletion of the study and had no impact upon patient
care during the course of the study.
Statistical methods
Theprimaryobjectivewastodetectacorrelation
between maximum PCT and SOFA-score. A total of
180 subjects were required in order to significantly
demonstrate that the correlation coefficient is above 0.2
with a power of 90%. Means ± standard de viations
(SDs) or medians with interquartile ranges (IQR) are
reported as appropri ate. The t hree types of pneumonia
were compared using tie-corrected exact Kruskal-Wallis
tests. Pair-wise comparisons of HAP and VAP to CAP
were added, based on tie-corrected exact Mann-Whitney
U-tests. Odds ratios and receiver operating characteristic
(ROC) curve methodology w ere used to judge the pre-
dictive power of PCT for outcome.
Results
Study population
Of the 200 enrolled in this study, 25 patients were
excluded from the analysis of the data. Of these, 21
patients had incomplete sampling and four patients met
exclusion criteria. The characteristics on admission of
the 175 patients included in our analysis study group are
presented in Table 1. Mean age was 62 years; roughly
one-third had CAP, one-third had HAP, and one-third
had VAP. The median hospital and ICU lengths of stay
prior to enrolment were six days (range 0 to 368 days)
and nine days (range 0 to 42 days), respectively.
Patients with CAP had higher APACHE II and SOFA
scores at inclusion t han patients with VAP. Such a dif-
ference was not observed between VAP and HAP
patients. The incidence of cardiovascular co-morbid
conditions on admission to the ICU was lower in
patients with VAP than in the other groups (Table 1).
Positive cultures of the microbiological samples taken
within 48 h were reported in 119 patients (67.4%).
Gram-positive organisms were isolated in 75 patients
(42.9%) and Gram-negative organisms in 63 patients
(36.0%). The detected microorganisms are shown in
Table 1 Characteristics of the study population stratified according to the type of pneumonia
CAP N = 57 HAP N = 57 VAP N = 61 Over-all P P (CAP versus VAP)
Age 61.8 ± 18.7 64.6 ± 15.8 60.7 ± 16.2 n.s. n.s.
Male 35 (61.4%) 38 (66.7%) 35 (57.4%) n.s. n.s.
APACHE II score 26.2 ± 7.4 25.2 ± 9.4 20.1 ± 8.5 < 0.001 < 0.001
SOFA score 7.6 ± 3.5 6.9 ± 3.7 6 ± 3.5 0.044 0.005
On antibiotics 57 (100.0%) 55 (96.5%) 58 (95.1%) n.s. n.s.
Coexisting diseases
Diabetes mellitus 14 (24.6%) 11 (19.3%) 12 (19.7%) n.s. n.s.
Cardiovascular disease 28 (49.1%) 24 (42.1%) 16 (26.2%) 0.032 0.010
Hypertension 3 (5.3%) 3 (5.3%) 5 (8.2%) n.s. n.s.
Malignancies 14 (24.6%) 20 (35.1%) 11 (18.0)% n.s. n.s.
COPD 13 (22.8%) 5 (8.8%) 10 (16.4%) n.s. n.s.
Liver cirrhosis 4 (7.0%) 1 (1.8%) 1 (1.6%) n.s. n.s.
Chronic renal failure 2 (3.5%) 4 (7.0%) 3 (4.9%) n.s. n.s.
HIV/AIDS 1 (1.8%) 2 (3.5%) 1 (1.6%) n.s. n.s.
There was no statistical difference between CAP vs. HAP in any of these variables. Continuous data are given as mean ± standard deviation. AIDS, acquired
immunodeficiency syndrome; APACHE, Acute Physiology And Chronic Health Evaluation; CAP, community acquired pneumonia; COPD, chronic obstructive
pulmonary disease; HAP, hospital acquired pneumonia; HIV, human immunodeficiency virus; n.s., not significant; SOFA, sequential organ failure assessment; VAP,
ventilator associated pneumonia.
Bloos et al. Critical Care 2011, 15:R88
/>Page 3 of 9
Table 2. In all patients, except one patient with HAP,
infection was adequately controlled on Day 3 according
to the attending physician.
Time course of PCT levels
PCT levels were elevated at the time of enrolment i n all
groups (Table 3). Initial PCT levels were higher in CAP
than VAP patients. The maximum PCT levels were
higher in patients with CAP than those with HAP or
VAP. Maximum PCT occurred a median of one to two
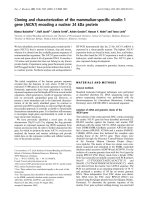
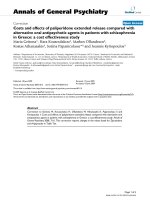
days after inclusion into the s tudy. As shown in Figure
1, PCT levels were persistently higher in patients with
CAP than those with HAP during the first week follow-
ing inclusion. There was no difference of initial PCT
levels in culture positive and culture negative p atients
(1.60 (0.40 to 5.95) vs. 1.65 (0.5 to 6.9) ng/ml). Patients
with positive cultures had higher maximum PCT levels
(2.70 (0.65 to 8.00) vs. 2.25 (0.65 to 9.95) ng/ ml). How -
ever, this difference did not reach statistical significance.
Morbidity and mortality
Theoverall28-daymortalityratewas18.3%(n =32)
and the median ICU length of stay (LOS) was 16 (9 to
28.5) days (range 1 to 142 days). The 28-day mortality
was h igher in patients with severe CAP compared with
those with HAP or VAP (36.8% vs. 10.5% and 8.2%,
respectively, P < 0.01 each). Likewise, the maximum
degree of organ d ysfunction as assessed by the
maximum SOFA score was higher in CAP compared
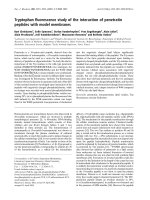
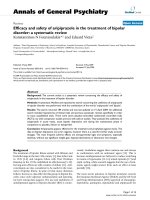
with HAP and VAP patients. PCT levels were consis-
tently higher in non-survivors than survivors throughout
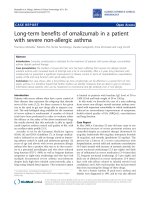
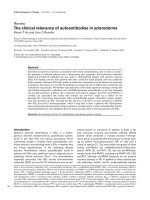
the observation period (Figure 2). Initial PCT values of
VAP patients were significantly higher in non-survivors
than in survivors with a median PCT of 0.6 ng/ml in
the latter group (Figure 3). This difference between sur-
vivors and non-survivors was also observed in HAP but
did not reach statistical significance. In the survivors,
PCT values dropped to a median of 50.0% (27.3 to
100.0%) of the baseline value (P < 0.001) during the first
five study days. A drop of similar magnitude with 53.7%
(27.6 to 148.0%) was observed in the non-survivors
without reaching statistical significance (P = 0.08).
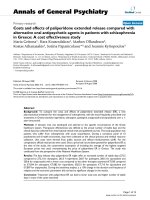
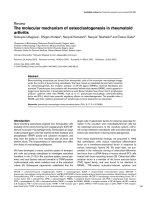
Initial and maximal PCT levels correlated with maxi-
mum SOFA score (r
2
=0.51andr
2
= 0.57, respec-
tively). The association between initial and maximum
PCT levels and SOFA score was independent of the
type of pneumonia (Figure 4). In a ROC analysis on dis-
crimination of 28-day mortality, the area under the
curves (AUC) for maximum PCT, initial PCT, and
admission-day APACHE II score were 0.74, 0.70, and
0.69, respectively (Figure 5). The AUCs were not statisti-
call y different. The best cut-off of initial PCT to predict
28-day m ortality was 1.1 ng/ml (odds r atio 7.0 (95% CI
2.6 to 25.2)) and that of the maximum PCT was 7.8 ng/
ml (odds ratio 5.7 (95% CI 2.5 to 13.1)). The highest
AUC was observed in VAP patients with 0.71 (95% CI
0.92 to 1.01) compared to CAP with 0.41 (95% CI 0.24
to 0.92) and HAP with 0.56 (95% CI 0.58 to 0.96).
Discussion
In this prospective multicenter study on a cohort of
ICU-patients with severe pneumonia, median initial
PCT levels were elevated above a normal value of 0.3
ng/ml in all groups. Those patients with ventilator asso-
ciated pneumonia had the lowest initial PCT values.
The maximum PCT levels were observed a median of
one to t wo days after enrolment. Patients with severe
CAP had highest initial median PCT values (2.4 ng/ml).
These patients also showed greater disease severity,
organ dysfunction, and mortality than HAP and VAP.
This is in concordance with data from Valencia et al.,
who reported a mortality rate of 37% in CAP patients
requiring ICU therapy [27]. Median admission PCTs of
3.4 ng/ml have been observed in patients presenting
with CAP in the emergency department [17].
PCT levels were higher, and remained persistently ele-
vated, in non-survivors. Both, initial and maximum PCT
values correlated with the maximum SOFA sco re and
were a reasonable predictor of the risk of death within 28
days in these patients. In patients with severe pneumonia,
initial PCT measurement allows a risk stratification similar
to the APACHE II-score. The data agree with previous
Table 2 Isolates from the specimen taken for
microbiological proof of infection with 48 hours after
enrolment
CAP
N =57
HAP
N =57
VAP
N =61
Total
N = 175
Negative 21 (36.8%) 21 (36.8%) 15 (24.6%) 57 (32.6%)
Gram positive
bacteria
22 (38.6%) 22 (38.6%) 31 (50.8%) 75 (42.9%)
MSSA 8 (14.0%) 10 (17.5%) 16 (13.9%) 34 (11.6%)
Streptococcus spp. 8 (14.0%) 4 (7.0%) 5 (4.3%) 17 (5.7%)
MRSA 4 (7.0%) 1 (1.8%) 0 (0%) 5 (1.7%)
Enterococcus spp. 0 (0%) 0 (0%) 4 (6.6%) 4 (2.3%)
Other 2 (3.5%) 7 (12.3%) 6 (9.8%) 15 (8.6%)
Gram negative
bacteria
22 (38.6%) 19 (33.3%) 22 (36.1%) 63 (36.0%)
Pseudomonas spp. 5 (8.8%) 5 (8.8%) 6 (9.8%) 16 (5.4%)
E. coli 5 (8.8%) 3 (5.3%) 4 (6.6%) 12 (4.1%)
Haemophilus spp. 3 (5.3%) 3 (5.3%) 4 (6.6%) 10 (3.4%)
Klebsiella spp. 2 (3.5%) 2 (3.5%) 2 (3.3%) 6 (2.0%)
Proteus spp. 0 (0%) 0 (0%) 3 (4.9%) 3 (1.7%)
Other 7 (12.3%) 6 (10.5%) 3 (4.9%) 16 (9.1%)
Yeasts 4 (7.0%) 9 (15.8%) 8 (13.1%) 21 (12.0%)
CAP, community acquired pneumonia; HAP, hospital acquired pneumonia; E.
coli, Escherichia coli; MRSA, methicillin-resistent staphylococcus aureus; MSSA,
methicillin-sensitive staphylococcus aureus; spp., species; VAP, ventilator
associated pneumonia.
Bloos et al. Critical Care 2011, 15:R88
/>Page 4 of 9
observations. In two studies in the emergency department
with more than 1,600 patients each, PCT-values < 0.1 ng/
ml in CAP were associated with a low risk of death inde-
pendent of the clinical risk assessment [17,18]. PCT was
also capable of identifying an unfavorable outcome in
CAP patients staying at the ICU [28].
Impact of PCT-assessment is less well investigated in
VAP and HAP compared to CAP. Patients with HAP
not treated in an ICU have low median PCT va lues of
0.22 ng/ml [29]. In a single center study conducted in
44 patients with VAP, Duflo et al.foundPCTtobesig-
nificantly elevated in non-su rvivors: The best cut-off for
serum PCT in the non-survivors in the VAP group was
2.6 ng/ml with a sensitivity of 74% a nd a specificity of
75% [7]. Likewise, Luyt et al.foundhighmedianPCT
levels of about 3 ng/ml at Day 1 in patients with unfa-
vorable outcomes during the clinical course of microbio-
logically proven VAP (n = 63) [1 9]. Intere stingly,
multivariate analyses further supported that serum PCT
levels on days 1, 3, and 7 were strong predictors of
unfavorable outcome [19].
We found a significant association between PCT levels
and organ dysfunction as assessed by the SOFA score.
Similar observations were reported by Meisner et al.
[30] and by Schroder et al. in surgical critically ill
patients [31]. Hedlund et al. showed that the severity of
disease measured by the APACHE II score was strongly
associated with admission levels of PCT in 96 adult
patients with CAP [32]. In 110 patients with CAP, Bous-
sekey et al. found higher PCT levels in bacteremic
patients and/o r septic shock patients (4.9 ng/ml vs. 1.5
ng/ml) and in patients who deve loped infection-related
complications (septic shock, multiorgan dysfunction,
acute respiratory distress syndrome and disseminated
intravascular coagulation) during their ICU stay [33].
The association of PCT with morbidity and mortality
may be of clinical importance not primarily for outcome
prediction but to monitor success of therapy. Current
data support the hypothesis that a drop in PCT levels
represents an adequate antimicrobial therapy and may
actuallydefineatimepointwhereantibiotictreatment
can be safely withdrawn [20,21]. Recently, this has been
Table 3 Initial and maximum PCT levels, morbidity and mortality according to the type of pneumonia
CAP N = 57 HAP N = 57 VAP N = 61 Overall PP(CAP versus HAP) P (CAP versus VAP)
Initial PCT (ng/ml) 2.4
(1.0, 15.8)
2.2
(0.4, 8.0)
0.7
(0.3, 2.15)
n.s n.s. < 0.001
Max. PCT (ng/ml) 5.3
(1.7, 17.7)
2.8
(0.4, 8.2)
1.0
(0.5, 3.4)
n.s. 0.021 < 0.001
Day of max. PCT 2
(1, 3)
1
(1, 2)
2
(1, 6)
< 0.001 0.012 n.s.
Maximum SOFA 9.5 ± 4.2 7.6 ± 3.8 6.7 ± 3.7 < 0.001 0.007 < 0.001
ICU length of stay (days) 13.0
(8.0, 17.5)
12.0
(7.0, 22.5)
26
(18, 43)
< 0.001 n.s. < 0.001
28 days mortality n (%) 21 (36.8%) 6 (10.5%) 5 (8.2%) < 0.001 0.002 < 0.001
Continuous data are given as median (interquartile range) or mean ± standard deviation. CAP, community acquired pneumonia; HAP, hospital acquired
pneumonia; ICU, intensive care unit; PCT, procalcitonin; n.s., not significant; SOFA, sequential organ failure assessment; VAP, ventilator associated pneumonia.
0.01
0.1
1
10
100
1000
57 57 61 56 55 59 54 54 56 44 36 51 36 29 45 23 14 29 14 10 24
1235 10715
* * * * *
* *
CAP HAP VAP
Da
y
Procalcitonin [ng/ml]
Figure 1 Time course of proc alc itoni n levels in patients with
pneumonia. Box plot representing the time course of PCT over the
two weeks following study inclusion in patients with CAP, HAP, and
VAP. * P < 0.05 compared with CAP.
0.01
0.1
1
10
100
1000
142 32 138 32 135 29 109 22 95 15 56 10 45 3
1235 10715
*
survivors non-survivors
Da
y
* * * * *
Procalcitonin [ng
/
ml]
Figure 2 Time course of proc alc itoni n levels in patients with
pneumonia depending on survival. Box plot representing the
time course of PCT over the two weeks following study enrolment
in survivors and non-survivors. * P < 0.05 compared with survivors.
Bloos et al. Critical Care 2011, 15:R88
/>Page 5 of 9
demonstrated in ICU patients with suspected bacterial
infection at admission or during their ICU stay [22].
More than 70% of these patients had pulmonary i nfec-
tions. Unsuccessful source control and poor outcome is
associated with persistently elevated PCTs which should
negatively affect outcome [14,34]. Thus, increasing PCT
or persistently elevated PCT values should trigger a
change in antimicrobial therapy.
In this study of severe pneumonia in mechanically venti-
lated patients, there was no difference in PCT levels
between culture positive and culture negative pneumonia.
In another study on patients with severe pneumonia as
defined by a high Pneumonia Severity Index (PSI), PCT
correlated with outcome b ut could not differentiate
between bacterial and nonbacterial etiology of pneumonia
[35]. In 72 children with CAP, Moulin et al.foundPCT
levels > 2 ng/ml in all 10 patients with blood culture posi-
tive for S. pneumoniae; PCT concentration was greater
than 1 ng/ml in 86% of patients with bacterial infection,
with the highest percentage being in those with positive
blood culture [36]. This PCT-threshold was more sensitive
and specific than CRP, IL-6, or white blood cell count for
differentiating bacterial and viral causes of pneumonia.
Likewise, Boussekey et al. found higher PCT levels in
microbiologically documented CAP (median 4.9 ng/ml vs
1.5 ng/ml if no bacteria were found), but PCT levels could
not discriminate between specific bacterial agents [33].
Duflo et al. identified VAP based on a positive quantitative
culture of 10
3
colony-forming units/ml or more obtained
via a mini-bronchoalveolar lavage.
0
5
10
15
20
25
30
Procalcitonin
(
ng
/
ml
)
0
5
10
15
20
25
30
C
AP HAP VAP
survivor
nonísurvivor
*
*
#
Figure 3 Initial PCT-values for CAP, HAP, and VAP separated
for survivors and non-survivors.*:P < 0.05 (survivors vs. non-
survivors), #: P < 0.05 (Bonferroni corrected) compared to VAP.
0.01 0.1 1 10 100 100
0
0
5
10
15
20
2
5
CAP HAP VAP
A
Procalcitonin at day 1 [ng/ml]
max.
SO
FA-score
0.01 0.1 1 10 100 100
0
0
5
10
15
20
25
B
max. Procalcitonin [n
g
/ml]
max.
SO
FA-score
Figure 4 Correlation of initial or maximum PCT with maximum
SOFA-score. Scatter plots representing the initial PCT (panel A) and
the maximum PCT (panel B) vs. maximum SOFA score over the two
weeks following inclusion. Square of correlation coefficients were r
2
= 0.50 (95% CI: 0.38 to -0.61) for initial PCT and r
2
= 0.57 (95% CI
0.46 to 0.66) for maximum PCT.
0 20 40 60 80 100
0
20
40
60
80
100
PCT
PCT max
APACHEII
100 - specificity [%]
Sensitivity [%]
Figure 5 Receiver operator characteristic (ROC) curve for 28-
day mortality prediction. Areas under the curve: maximum PCT
0.74 (95% CI: 0.65 to 0.83), initial PCT 0.70 (95% CI: 0.60 to 0.80), and
APACHE II 0.69 (95% CI: 0.59 to 0.78).
Bloos et al. Critical Care 2011, 15:R88
/>Page 6 of 9
Median PCT values of VAP survivors at baseline were
0.6 ng/ml in this study. This low PCT value questio ns
the validity of currently used VAP diagnostic criteria.
Luyt et al. found a similar low PCT of about 0.5 ng/ml
in VAP survivors and doubted the usefulness of this
parameter for diagnosis of VAP [19,37]. The 28-day
mortality of 8.2% in patients with VAP in our study was
very low. The Canadian Critical Care Trials gro up
recorded an overall 28 days mortality rate of 18.7% in a
large cohort of patients where VAP was diagnosed using
similar criteria as in our study [5]. However, mortality
rates between 9.8 and 93.3% have been observed
depending on the presence of risk factors such as coex -
isting diseases, presence of bacteremia, arterial hypoten-
sion, or ARDS [38]. The low mor tality rate of VAP
patients and l ow PCT-values in the VAP survivors in
this study may reflect the uncertainty in correctly diag-
nosing VAP despite the requirement for a positive
Gram stain of respiratory secretion. Although VAP is
the most frequent cause of death in hospital for patients
with respiratory failure [39,40], the diagnosis of VAP is
difficult. The optimal invasive procedure for diagnosing
HAP or VAP remains poorly defined [9,10]. Indeed, one
study demonstrated that 29% of clinically suspected
VAP cases were disproved by autopsy results [41]. In
this study, microbiological proof of infection was possi-
ble in about 67% of the patients. This is in good agree-
ment with findings in large sepsis trials where
microbiological proof was possible in 41 to 51% of the
patients with airway infections [42,43].
It should be noted that the immunoluminometric
assay for PCT measurement applied in this study has
bee n replaced today by more modern techniques with a
higher accuracy especially in the low range of PCT
levels. Such accuracy is a prerequisite w hen using PCT
for antibiotic stewardship [20]. This study was focused
on high PCT concentrations for their association with
mortalit y and organ dysfunction. It is unlikely that such
a relationship is affected by the type of assay.
Measurement of PCT levels in addition to the clinical
judgement may offer a solution for this diagnostic
dilemma since our data suggest that baseline PCT levels
greater than 1.1 ng/ml identify a group of ICU patients
with a high risk to develop multiorgan dysfunction fol-
lowed by death. The quality of mortality prediction was
similar to the APACHE II score. These data confirm the
observation by Luyt et al., who found a PCT threshold
of 1 ng/ml to predict unfavorable outcome [19].
Furthermore, non-survivors showed no decrease in
PCT suggesting that pneumonia remained uncontrolled.
Assessing adequacy of antimicrobial therapy was not
part of the study hypothesis and w ould have been
beyond the scope of this trial. However, PCT measure-
mentoffersthepossibilityofbeingamarkerfor
monitoring therapeutic success or fail ure, since success-
ful t herapy is associated with a decrease in PCT levels.
A PCT guided algorithm has been shown to reduce
duration of antibiotic therapy without affecting patients’
safety [22,44].
Conclusions
In patients with severe pneumonia (CAP, VAP, HAP),
PCT is associated with the severity of illness and is a
good prognostic marker of morbidity and mortality in
patients with pneumonia in demand of mechanical ven-
tilation. The severity of illness as reflected by the degree
of organ dysfunction may be a more important determi-
nant of PCT levels than the type or cause of pneumonia.
Key messages
• Procalcitonin (PCT) concentrations are associated
with the severity o f illness in patients with severe
pneumonia in demand of mechanical ventilation.
• PCT is a good prognostic marker of morbidity and
mortality in these patients.
• The severity of illness as reflected by the degree of
organ dysfunction may be a more important deter-
minant of PCT levels than the type or cause of
pneumonia.
Abbreviations
APACHE II: Acute Physiology and Chronic Health Evaluation II; AUC: area
under the curve; BAL: bronchoalveolar lavage; CAP: community acquired
pneumonia; CI: confidence interval; GCP: Good Clinical Practice; GCS:
Glasgow Coma Scale; HAP: hospital acquired pneumonia; ICU: intensive care
unit; IQR: interquartile range; PCT: procalcitonin; PSI: pneumonia severity
index; SD: standard deviation; SOFA: Sequential Organ Failure Assessment;
ROC: receiver operating characteristic; VAP: ventilator associated pneumonia;
WBC: white blood cell count.
Acknowledgements
This study was financed by BRAHMS GmbH (Hennigsdorf, Germany).
Statistical analysis was done by K. Wegscheider, University Hospital
Hamburg-Eppendorf, Institute of Medical Biometry and Epidemiology.
Author details
1
Department of Anesthesiology and Intensive Care Medicine, Jena University
Hospital, Erlanger Allee 101, 07747 Jena, Germany.
2
Department of Surgery,
Li Ka Shing Knowledge Institute, St Michael’s Hospital, University of Toronto,
30 Bond Street, Toronto, ON M5B 1W8, Canada.
3
Division of Critical Care
Medicine, Department of Medicine, Cooper University Hospital, One Cooper
Plaza D393, Camden, NJ 08103, USA.
4
Department of Intensive Care, Erasme
University Hospital, Route de Lennik 808, 1070 Brussels, Belgium.
5
Division of
Pulmonary and Critical Care Medicine, The George Washington University,
2150 Pennsylvania Ave., Washington, DC 20037, USA.
6
Department of Critical
Care Medicine, Henry Ford Hospital, 2799 West Grand Boulevard, Detroit, MI
48202, USA.
7
Department of Pulmonary Critical Care, Medicine Rush
Presbyterian St. Luke’s Medical Center, 1753 West Congress Parkway,
Chicago, IL 60612-3809, USA.
8
Department of Intensive Care, Cliniques
Universitaires St-Luc Ave., Hippocrate 10, 1200 Brussels, Belgium.
9
Department of Critical Care Medicine, University of Pittsburgh, 3550 Terrace
Street, Pittsburgh, PA 15261, USA.
Authors’ contributions
FB participated in the local conduct of the trial, took part in the
interpretation of the results, and drafted the manuscript. JM, RD, JV, GG, ER,
Bloos et al. Critical Care 2011, 15:R88
/>Page 7 of 9
RB, PL, DA and KR helped to design the study, were responsible for the
conduct of the trial, and helped to draft the manuscript. FMB conceived and
designed the study and helped to draft the manuscript. All authors read and
approved the final manuscript.
Competing interests
FB received a speaker fee from BRAHMS. ER receives research support from
the National Institute of Allergy and Infectious Disease and the Aggennix
Corporation and has served as one-time consultant for Aggennix
Corporation, Eisai Pharmaceuticals, Idaho Technologies and Astra Zeneca. RB
has received research support, consulting fees, and honoraria from BRAHMS
and from bioMerieux. DA has received consultant fees from BRAHMS,
performed PCT assays for the PCT-7 trial, and had access to equipment and
assays by BRAHMS as part of NIH-funded studies. KR has received consultant
fees from BRAHMS. FMB has received consultant and speaker fees and
grant/research support from BRAHMS. JM, RD, JV, GG and PL declare that
they have no competing interests.
Received: 6 October 2010 Revised: 30 January 2011
Accepted: 7 March 2011 Published: 7 March 2011
References
1. Alberti C, Brun-Buisson C, Goodman SV, Guidici D, Granton J, Moreno R,
Smithies M, Thomas O, Artigas A, Le Gall JR: Influence of systemic
inflammatory response syndrome and sepsis on outcome of critically ill
infected patients. Am J Respir Crit Care Med 2003, 168:77-84.
2. Vincent JL, Bihari DJ, Suter PM, Bruining HA, White J, Nicolas-Chanoin MH,
Wolff M, Spencer RC, Hemmer M: The prevalence of nosocomial infection
in intensive care units in Europe. Results of the European Prevalence of
Infection in Intensive Care (EPIC) Study. EPIC International Advisory
Committee. JAMA 1995, 274:639-644.
3. Fagon JY, Chastre J, Vuagnat A, Trouillet JL, Novara A, Gibert C: Nosocomial
pneumonia and mortality among patients in intensive care units. JAMA
1996, 275:866-869.
4. Angus DC, Marrie TJ, Obrosky DS, Clermont G, Dremsizov TT, Coley C,
Fine MJ, Singer DE, Kapoor WN: Severe community-acquired pneumonia:
use of intensive care services and evaluation of American and British
Thoracic Society Diagnostic criteria. Am J Respir Crit Care Med 2002,
166:717-723.
5. The Canadian Critical Care Trials Group: A randomized trial of diagnostic
techniques for ventilator-associated pneumonia. N Engl J Med 2006,
355:2619-2630.
6. Sole Violan J, Fernandez JA, Benitez AB, Cardenosa Cendrero JA, Rodriguez
de Castro F: Impact of quantitative invasive diagnostic techniques in the
management and outcome of mechanically ventilated patients with
suspected pneumonia. Crit Care Med 2000, 28:2737-2741.
7. Duflo F, Debon R, Monneret G, Bienvenu J, Chassard D, Allaouchiche B:
Alveolar and serum procalcitonin: diagnostic and prognostic value in
ventilator-associated pneumonia. Anesthesiology 2002, 96:74-79.
8. Gibot S, Cravoisy A, Levy B, Bene MC, Faure G, Bollaert PE: Soluble
triggering receptor expressed on myeloid cells and the diagnosis of
pneumonia. N Engl J Med 2004, 350:451-458.
9. Shorr AF, Kollef MH: Ventilator-associated pneumonia: insights from
recent clinical trials. Chest 2005, 128:583S-591S.
10. Mehta RM, Niederman MS: Nosocomial pneumonia in the intensive care
unit: controversies and dilemmas. J Intensive Care Med 2003, 18:175-188.
11. Koulenti D, Lisboa T, Brun-Buisson C, Krueger W, Macor A, Sole-Violan J,
Diaz E, Topeli A, Dewaele J, Carneiro A, Martin-Loeches I, Armaganidis A,
Rello J, EU-VAP/CAP Study Group: Spectrum of practice in the diagnosis
of nosocomial pneumonia in patients requiring mechanical ventilation
in European intensive care units. Crit Care Med 2009, 37:2360-2368.
12. Chastre J, Wolff M, Fagon JY, Chevret S, Thomas F, Wermert D, Clementi E,
Gonzalez J, Jusserand D, Asfar P, Perrin D, Fieux F, Aubas S: Comparison of
8 vs 15 days of antibiotic therapy for ventilator-associated pneumonia
in adults: a randomized trial. JAMA 2003, 290:2588-2598.
13. Singh N, Rogers P, Atwood CW, Wagener MM, Yu VL: Short-course empiric
antibiotic therapy for patients with pulmonary infiltrates in the intensive
care unit. A proposed solution for indiscriminate antibiotic prescription.
Am J Respir Crit Care Med 2000, 162:505-511.
14. Harbarth S, Holeckova K, Froidevaux C, Pittet D, Ricou B, Grau GE, Vadas L,
Pugin J:
Diagnostic value of procalcitonin, interleukin-6, and interleukin-8
in
critically ill patients admitted with suspected sepsis. Am J Respir Crit
Care Med 2001, 164:396-402.
15. Müller B, Becker KL, Schächinger H, Rickenbacher PR, Huber PR, Zimmerli W,
Ritz R: Calcitonin precursors are reliable markers of sepsis in a medical
intensive care unit. Crit Care Med 2000, 28:977-983.
16. Brunkhorst FM, Wegscheider K, Forycki ZF, Brunkhorst R: Procalcitonin for
early diagnosis and differentiation of SIRS, sepsis, severe sepsis, and
septic shock. Intensive Care Med 2000, 26:S148-S152.
17. Huang DT, Weissfeld LA, Kellum JA, Yealy DM, Kong L, Martino M,
Angus DC: Risk prediction with procalcitonin and clinical rules in
community-acquired pneumonia. Ann Emerg Med 2008, 52:48-58.
18. Kruger S, Ewig S, Marre R, Papassotiriou J, Richter K, von Baum H, Suttorp N,
Welte T: Procalcitonin predicts patients at low risk of death from
community-acquired pneumonia across all CRB-65 classes. Eur Respir J
2008, 31:349-355.
19. Luyt CE, Guerin V, Combes A, Trouillet JL, Ayed SB, Bernard M, Gibert C,
Chastre J: Procalcitonin kinetics as a prognostic marker of ventilator-
associated pneumonia. Am J Respir Crit Care Med 2005, 171:48-53.
20. Christ-Crain M, Jaccard-Stolz D, Bingisser R, Gencay MM, Huber PR,
Tamm M, Muller B: Effect of procalcitonin-guided treatment on antibiotic
use and outcome in lower respiratory tract infections: cluster-
randomised, single-blinded intervention trial. Lancet 2004, 363:600-607.
21. Schuetz P, Christ-Crain M, Thomann R, Falconnier C, Wolbers M, Widmer I,
Neidert S, Fricker T, Blum C, Schild U, Regez K, Schoenenberger R,
Henzen C, Bregenzer T, Hoess C, Krause M, Bucher HC, Zimmerli W,
Mueller B: Effect of procalcitonin-based guidelines vs standard guidelines
on antibiotic use in lower respiratory tract infections: the ProHOSP
randomized controlled trial. JAMA 2009, 302:1059-1066.
22. Bouadma L, Luyt CE, Tubach F, Cracco C, Alvarez A, Schwebel C,
Schortgen F, Lasocki S, Veber B, Dehoux M, Bernard M, Pasquet B,
Regnier B, Brun-Buisson C, Chastre J, Wolff M: Use of procalcitonin to
reduce patients’ exposure to antibiotics in intensive care units
(PRORATA trial): a multicentre randomised controlled trial. Lancet 2010,
375:463-474.
23. Guidance for industry: Community-acquired pneumonia - developing
antimicrobial drugs for treatment. [ />GuidanceComplianceRegulatoryInformation/Guidances/UCM123686.pdf].
24. Guidance for Industry: Hospital-Acquired Bacterial Pneumonia and
Ventilator-associated bacterial pneumonia: Developing drugs for
treatment. [ />GuidanceComplianceRegulatoryInformation/Guidances/UCM234907.pdf].
25. Pingleton SK, Fagon JY, Leeper KV Jr: Patient selection for clinical
investigation of ventilator-associated pneumonia. Criteria for evaluating
diagnostic techniques. Chest 1992, 102:553S-556S.
26. Vincent JL, Moreno R, Takala J, Willatts S, De Mendonca A, Bruining H,
Reinhart CK, Suter PM, Thijs LG: The SOFA (Sepsis-related Organ Failure
Assessment) score to describe organ dysfunction/failure. On behalf of
the Working Group on Sepsis-Related Problems of the European Society
of Intensive Care Medicine. Intensive Care Med 1996, 22
:707-710.
27.
Valencia M, Badia JR, Cavalcanti M, Ferrer M, Agusti C, Angrill J, Garcia E,
Mensa J, Niederman MS, Torres A: Pneumonia severity index class v
patients with community-acquired pneumonia: characteristics,
outcomes, and value of severity scores. Chest 2007, 132:515-522.
28. Boussekey N, Leroy O, Alfandari S, Devos P, Georges H, Guery B:
Procalcitonin kinetics in the prognosis of severe community-acquired
pneumonia. Intensive Care Med 2006, 32:469-472.
29. Polzin A, Pletz M, Erbes R, Raffenberg M, Mauch H, Wagner S, Arndt G,
Lode H: Procalcitonin as a diagnostic tool in lower respiratory tract
infections and tuberculosis. Eur Respir J 2003, 21:939-943.
30. Meisner M, Tschaikowsky K, Palmaers T, Schmidt J: Comparison of
procalcitonin (PCT) and C-reactive protein (CRP) plasma concentrations
at different SOFA scores during the course of sepsis and MODS. Crit Care
1999, 3:45-50.
31. Schroder J, Staubach KH, Zabel P, Stuber F, Kremer B: Procalcitonin as a
marker of severity in septic shock. Langenbecks Arch Surg 1999,
384:33-38.
32. Hedlund J, Hansson LO: Procalcitonin and C-reactive protein levels in
community-acquired pneumonia: correlation with etiology and
prognosis. Infection 2000, 28:68-73.
33. Boussekey N, Leroy O, Georges H, Devos P, d’Escrivan T, Guery B:
Diagnostic and prognostic values of admission procalcitonin levels in
Bloos et al. Critical Care 2011, 15:R88
/>Page 8 of 9
community-acquired pneumonia in an intensive care unit. Infection 2005,
33:257-263.
34. Jensen JU, Heslet L, Jensen TH, Espersen K, Steffensen P, Tvede M:
Procalcitonin increase in early identification of critically ill patients at
high risk of mortality. Crit Care Med 2006, 34:2596-2602.
35. Masia M, Gutierrez F, Shum C, Padilla S, Navarro JC, Flores E, Hernandez J:
Usefulness of procalcitonin levels in community-acquired pneumonia
according to the patients outcome research team pneumonia severity
index. Chest 2005, 128:2223-2229.
36. Moulin F, Raymond J, Lorrot M, Marc E, Coste J, Iniguez JL, Kalifa G,
Bohuon C, Gendrel D: Procalcitonin in children admitted to hospital with
community acquired pneumonia. Arch Dis Child 2001, 84:332-336.
37. Luyt CE, Combes A, Reynaud C, Hekimian G, Nieszkowska A, Tonnellier M,
Aubry A, Trouillet JL, Bernard M, Chastre J: Usefulness of procalcitonin for
the diagnosis of ventilator-associated pneumonia. Intensive Care Med
2008, 34:1434-1440.
38. Lisboa T, Diaz E, Sa-Borges M, Socias A, Sole-Violan J, Rodriguez A, Rello J:
The ventilator-associated pneumonia PIRO score: a tool for predicting
ICU mortality and health-care resources use in ventilator-associated
pneumonia. Chest 2008, 134:1208-1216.
39. Richards MJ, Edwards JR, Culver DH, Gaynes RP: Nosocomial infections in
medical intensive care units in the United States. National Nosocomial
Infections Surveillance System. Crit Care Med 1999, 27:887-892.
40. Kollef MH: What is ventilator-associated pneumonia and why is it
important? Respir Care 2005, 50:714-721, discussion 721-724.
41. Andrews CP, Coalson JJ, Smith JD, Johanson WG Jr: Diagnosis of
nosocomial bacterial pneumonia in acute, diffuse lung injury. Chest 1981,
80:254-258.
42. Abraham E, Reinhart K, Opal S, Demeyer I, Doig C, Rodriguez AL, Beale R,
Svoboda P, Laterre PF, Simon S, Light B, Spapen H, Stone J, Seibert A,
Peckelsen C, De Deyne C, Postier R, Pettila V, Artigas A, Percell SR, Shu V,
Zwingelstein C, Tobias J, Poole L, Stolzenbach JC, Creasey AA: Efficacy and
safety of tifacogin (recombinant tissue factor pathway inhibitor) in
severe sepsis: a randomized controlled trial. JAMA 2003, 290:238-247.
43. Brunkhorst FM, Engel C, Bloos F, Meier-Hellmann A, Ragaller M, Weiler N,
Moerer O, Gruendling M, Oppert M, Grond S, Olthoff D, Jaschinski U,
John S, Rossaint R, Welte T, Schaefer M, Kern P, Kuhnt E, Kiehntopf M,
Hartog C, Natanson C, Loeffler M, Reinhart K: Intensive insulin therapy and
pentastarch resuscitation in severe sepsis. N Engl J Med 2008,
358:125-139.
44. Nobre V, Harbarth S, Graf JD, Rohner P, Pugin J: Use of procalcitonin to
shorten antibiotic treatment duration in septic patients: a randomized
trial. Am J Respir Crit Care Med 2008, 177:498-505.
doi:10.1186/cc10087
Cite this article as: Bloos et al.: Multinational, observational study of
procalcitonin in ICU patients with pneumonia requiring mechanical
ventilation: a multicenter observational study. Critical Care 2011 15:R88.
Submit your next manuscript to BioMed Central
and take full advantage of:
• Convenient online submission
• Thorough peer review
• No space constraints or color figure charges
• Immediate publication on acceptance
• Inclusion in PubMed, CAS, Scopus and Google Scholar
• Research which is freely available for redistribution
Submit your manuscript at
www.biomedcentral.com/submit
Bloos et al. Critical Care 2011, 15:R88
/>Page 9 of 9