Báo cáo y học: " ngLOC: an n-gram-based Bayesian method for estimating the subcellular proteomes of eukaryote" pps
Bạn đang xem bản rút gọn của tài liệu. Xem và tải ngay bản đầy đủ của tài liệu tại đây (428.47 KB, 17 trang )
Genome Biology 2007, 8:R68
comment reviews reports deposited research refereed research interactions information
Open Access
2007King and GudaVolume 8, Issue 5, Article R68
Method
ngLOC: an n-gram-based Bayesian method for estimating the
subcellular proteomes of eukaryotes
Brian R King
*†
and Chittibabu Guda
†‡
Addresses:
*
Department of Computer Science, State University of New York at Albany, Washington Ave, Albany, New York 12222, USA.
†
Gen*NY*sis Center for Excellence in Cancer Genomics, State University of New York at Albany, Discovery Drive, Rensselaer, New York 12144-
3456, USA.
‡
Department of Epidemiology and Biostatistics, State University of New York at Albany, Discovery Drive, Rensselaer, New York
12144-3456, USA.
Correspondence: Chittibabu Guda. Email:
© 2007 King and Guda; licensee BioMed Central Ltd.
This is an open access article distributed under the terms of the Creative Commons Attribution License ( which
permits unrestricted use, distribution, and reproduction in any medium, provided the original work is properly cited.
Estimating eukaryotic subcellular proteomes<p>ngLOC is an <it>n</it>-gram-based Bayesian classification method that can predict the localization of a protein sequence over ten dis-tinct subcellular organelles.</p>
Abstract
We present a method called ngLOC, an n-gram-based Bayesian classifier that predicts the
localization of a protein sequence over ten distinct subcellular organelles. A tenfold cross-validation
result shows an accuracy of 89% for sequences localized to a single organelle, and 82% for those
localized to multiple organelles. An enhanced version of ngLOC was developed to estimate the
subcellular proteomes of eight eukaryotic organisms: yeast, nematode, fruitfly, mosquito, zebrafish,
chicken, mouse, and human.
Background
Subcellular or organellar proteomics has gained tremendous
attention of late, owing to the role played by organelles in car-
rying out defined cellular processes. Several efforts have been
made to catalog the complete subcellular proteomes of vari-
ous model organisms (for review [1,2]), with the aim being to
improve our understanding of defined cellular processes at
the organellar and cellular levels. Although such efforts have
generated valuable information, cataloging all subcellular
proteomes is far from complete. Experimental methods can
be expensive, often generating conflicting or inconclusive
results because of inherent limitations in the methods [3,4].
To complicate matters, computational methods rely on these
experimental data, and therefore they must be resilient to
noisy or inconsistent data found in these large datasets. These
dilemmas have made the task of obtaining the complete set of
proteins for each subcellular organelle a highly challenging
one.
In this study we address the task of estimating the subcellular
proteome through development of a computational method
that can be used to annotate the subcellular localization of
proteins on a proteomic scale. A fundamental goal of compu-
tational methods in bioinformatics research is to annotate
newly discovered protein sequences with their functional
information more efficiently and accurately. Protein subcel-
lular localization prediction has become a crucial part of
establishing this important goal. In this task, predictive mod-
els are inferred from experimentally annotated datasets con-
taining subcellular localization information, with the
objective being to use these models to predict the subcellular
localization of a protein sequence of unknown localization.
The methods developed for predicting subcellular localiza-
tion have varied significantly, ranging from the seminal work
by Nakai and Kanehisa [5] on PSORT, which is a rule-based
system derived by considering motifs and amino acid compo-
sitions; to the pure statistics based methods of Chou and
Elrod [6], which employed covariant discriminant analysis; to
Published: 1 May 2007
Genome Biology 2007, 8:R68 (doi:10.1186/gb-2007-8-5-r68)
Received: 7 November 2006
Revised: 19 February 2007
Accepted: 1 May 2007
The electronic version of this article is the complete one and can be
found online at />R68.2 Genome Biology 2007, Volume 8, Issue 5, Article R68 King and Guda />Genome Biology 2007, 8:R68
the numerous methods available today, which are based on a
variety of machine learning and data mining algorithms,
including artifical neural networks and support vector
machines (SVMs) [7,8]. All methods must choose a set of fea-
tures to represent a protein in the classification system.
Although the majority of methods use various facets of infor-
mation derived from the sequence, others use phylogenic
information [9], structure information [10], and known func-
tional domains [11]. Some methods scan documents and
annotations related to the proteins in their dataset in search
of discriminative keywords that can be used as predictive
indicators [12,13]. Regardless of the representation, the
sequence of a protein contains virtually all of the information
needed to determine the structure of the protein, which in
turn determines its function. Therefore, it is theoretically pos-
sible to derive much of the information needed to resolve
most protein classification problems directly from the protein
sequence. Furthermore, it has been proposed that a signifi-
cant relationship exists between sequence similarity and sub-
cellular localization [14], and the majority of protein
classification methods have capitalized on this assumption.
In addition to different classification algorithms and protein
representation models, subcellular localization prediction
methods also differ in exactly what they classify. Some con-
sider only one or a few organelles in the cell [15,16]. Others
consider all of the major organelles [5,6,8,11]. Methods often
limit the species being considered, such as the PSORTb clas-
sifier for gram-negative bacteria [17]. Others limit the type of
proteins being considered, such as those related to apoptosis
[18]. We refer the interested reader to a review by Dönnes and
Höglund [19], which provides an overview of the various
methods used in this vast field.
High-throughput proteomic studies continue to generate an
ever-increasing quantity of protein data that must be ana-
lyzed. Hence, computational methods that can accurately and
efficiently elucidate these proteins with respect to their func-
tional annotation, including subcellular localization, at the
level of the proteome are urgently needed [20]. Although a
variety of computational methods are available for this task,
very few of them have been applied on a proteome-wide scale.
The PSLT method [21], a Bayesian method that uses a combi-
nation of InterPro motifs, signaling peptides, and human
transmembrane domains, was used to estimate the subcellu-
lar proteome on portions of the proteome of human, mouse,
and yeast. The method of Huang and Li [22], a fuzzy k-nearest
neighbors algorithm that uses dipeptide compositions
obtained from the protein sequence, was used to estimate the
subcellular proteome for six species over six major organelles.
Despite the availability of an array of methods, most of these
are not suitable for proteome-wide prediction of subcellular
localization for the following reasons. First, most methods
predict only a limited number of locations. Second, the scor-
ing criteria used by most methods are limited to subsets of
proteomes, such as those containing signal/target peptide
sequences or those with prior structural or functional infor-
mation. Third, the majority of methods predict only one sub-
cellular location for a given protein, even though a significant
number of eukaryotic proteins are known to localize in multi-
ple subcellular organelles. Fourth, many methods exhibit a
lack of a balance between sensitivity and specificity. Fifth, the
datasets used to train these programs are not sufficiently
robust to represent the entire proteomes, and in some cases
they are outdated or altered. Finally, many methods require
the use of additional information beyond the primary
sequence of the protein, which is often not available on a pro-
teome-wide scale.
In this report we present ngLOC, a Bayesian classification
method for predicting protein subcellular localization. Our
method uses n-gram peptides derived solely from the primary
structure of a protein to explore the search space of proteins.
It is suitable for proteome-wide predictions, and is also capa-
ble of inferring multi-localized proteins, namely those local-
ized to more than one subcellular location. Using the ngLOC
method, we have estimated the sizes of ten subcellular pro-
teomes from eight eukaryotic species.
Results
We use a naïve Bayesian approach to model the density distri-
butions of fixed-length peptide sequences (n-grams) over ten
different subcellular locations. These distributions are deter-
mined from protein sequence data that contain experimen-
tally determined annotations of subcellular localizations. To
evaluate the performance of the method, we apply a standard
validation technique called tenfold cross-validation, in which
sequences from each class are divided into ten parts; the
model is built using nine parts, and predictions are generated
and evaluated on the data contained in the remaining part.
This process is repeated for all ten possible combinations. We
report standard performance measures over each subcellular
location, including sensitivity (recall), precision, specificity,
false positive rate, Matthews correlation coefficient (MCC),
and receiver operating characteristic (ROC) curves. MCC pro-
vides a measure of performance for a single class being pre-
dicted; it equals 1 for perfect predictions on that class, 0 for
random assignments, and less than 0 if predictions are worse
than random [23]. For a measure of the overall classifier per-
formance, we report overall accuracy as the fraction of the
data tested that were classified correctly. (All of our formulae
used to measure performance are briefly explained in the
Materials and methods section [see below], with details pro-
vided in Additional data file 1.) To demonstrate the usefulness
of our probabilistic confidence measures, we show how these
measures can be used to consider situations in which a
sequence may have multiple localizations, as well as to con-
sider alternative localizations when confidence is low.
Genome Biology 2007, Volume 8, Issue 5, Article R68 King and Guda R68.3
comment reviews reports refereed researchdeposited research interactions information
Genome Biology 2007, 8:R68
Evaluation of different size n-grams
In the context of proteins, an n-gram is defined as a subse-
quence of the primary structure of a protein of a fixed-length
size of n. First, we determined the optimal value of n to use by
evaluating the predictive performance of ngLOC over differ-
ent size n-gram models up to 15-grams. For this test only, we
used only single-localized sequences, and set the minimum
allowable length sequence to be 15 to enable testing of models
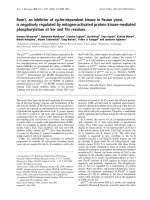
up to 15-grams. Our results show that the 7-gram model had
the highest performance, with an overall accuracy of 88.43%.
However, both the 6-gram and 8-gram models are close to
this level of performance, with accuracies of 88.12% and
87.53%, respectively (Figure 1). The results reported in the
rest of this report use the 7-gram model, unless otherwise
stated.
Prediction performance using a 7-gram model
All of our tests are based on the standard ngLOC dataset
(detailed in the Materials and methods section [see below]),
which was selected with a minimum sequence length of 10
residues allowed. We ran a test using only single localized
sequences, as well as the entire dataset including multi-local-
ized sequences. For a 7-gram model, the overall accuracy of
both models on single-localized sequences only was 88.8%
and 89%, respectively. The results for the model built using
the entire dataset is shown in Table 1, and will be the model of
choice because it will enable prediction of multi-localized
sequences as well.
Referring to Table 1, precision is high across all classes (0.81
to 0.96), whereas sensitivity ranged between 0.75 to 0.96,
with the exception of golgi (GOL; 0.55) and cytoskeleton
(CSK; 0.45), which is probably due to low representation in
the dataset. Although CSK and GOL had the lowest sensitiv-
ity, their precision was very good, which is typical when a
class is under-predicted. Specificity is very high across all
classes (0.95 to 1.0), although the classes with the largest rep-
resentation in the dataset, namely extracellular (EXC),
plasma membrane (PLA), nuclear (NUC), and cytoplasm
(CYT), had the lowest specificity, which is typical for highly
represented classes that are often prone to over-prediction.
Regardless, the MCC values for these four classes were still
Overall accuracy versus n-gram lengthFigure 1
Overall accuracy versus n-gram length. This graph shows how different
values of n affect the overall accuracy of ngLOC on our dataset. We define
percentage overall accuracy as the percentage of data that were predicted
with the correct localization, based on a tenfold cross-validation.
30
40
50
60
70
80
90
100
0246810121416
n -gram length
Percentage overall accuracy
Table 1
Results for 7-gram model using entire dataset
Location Code Precision Sensitivity FPR Specificity MCC
Cytoplasm CYT 0.828 0.775 0.020 0.980 0.777
Cytoskeleton CSK 0.882 0.452 0.001 0.999 0.629
Endoplasmic
Reticulum
END 0.961 0.789 0.001 0.999 0.867
Extracellular EXC 0.949 0.939 0.021 0.979 0.921
Golgi Apparatus GOL 0.891 0.550 0.001 0.999 0.697
Lysosome LYS 0.953 0.855 0.000 1.000 0.902
Mitochrondria MIT 0.964 0.799 0.003 0.997 0.867
Nuclear NUC 0.807 0.906 0.048 0.952 0.821
Plasma Membrane PLA 0.883 0.958 0.043 0.957 0.892
Perixosome POX 0.938 0.748 0.000 1.000 0.836
Single-localized % overall accuracy 89.03
Multi-localized % overall accuracy (at least 1 correct) 81.88
Multi-localized % overall accuracy (both correct) 59.70
The performance results of ngLOC on a tenfold cross-validation are displayed. The overall accuracy is also reported for multi-localized sequences,
comparing at least one localization predicted correctly against both localizations predicted correctly. FPR, false positive rate; MCC, Matthews
correlation coefficient.
R68.4 Genome Biology 2007, Volume 8, Issue 5, Article R68 King and Guda />Genome Biology 2007, 8:R68
between 0.78 and 0.92. On the other end are the classes with
the smallest representations in the dataset, including lyso-
some (LYS), peroxisome (POX), CSK, and GOL, whose MCC
values range between 0.63 and 0.90. Surprisingly, LYS and
POX, the two classes with the smallest representation in the
dataset, had good MCC values (0.902 and 0.836, respec-
tively). We determined the percentage of n-grams that were
unique (occurred in only one organelle) in each of these four
organelles (LYS, POX, CSK, and GOL) and discovered that
LYS and POX had the highest percentage of unique n-grams
with respect to the total number of n-grams in the organelle
(data not shown). This suggests that the proteins in these
locations are highly specific and distinctive compared with
those proteins localized elsewhere, and could explain the
superior performance of these locations despite their having
the smallest representation in the training dataset. We also
observed that n-grams in CSK and GOL had the lowest per-
centage of unique n-grams compared with any other class in
the data, suggesting that n-grams in these organelles are
more likely to be in common with n-grams in other
organelles, and therefore the proteins in these organelles will
be difficult to predict. The remaining classes performed well,
with MCC values of 0.87.
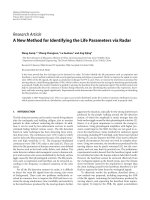
An ROC curve depicts the relationship between specificity
and sensitivity for a single class. The ROC curve for the per-
fect classifier would result in a straight line up to the top left
corner, and then straight to the top right corner, indicating
that a single score threshold can be chosen to separate all of
the positive examples of a class from all of the negative exam-
ples. Figure 2 shows the ROC curve for each class in ngLOC.
Each point in the curve is plotted based on different confi-
dence score (CS) thresholds. For all classes except CYT and
NUC, the ROC curves remain very close to the left side of the
chart, primarily because the majority of classes have very high
specificity at all CS thresholds. This is a desirable characteris-
tic of ROC curves. Although PLA and mitochondria (MIT)
have a high rate of false positives at the lowest score thresh-
olds, the rate of true positives remains high, indicating that a
good discriminating threshold exists for these classes. CYT
has a high rate of false positives for lower score thresholds,
again confirming that CYT is a class that is prone to over-pre-
diction. This is also confirmed by its low precision (0.828).
The other class that is prone to over-prediction is NUC, exhib-
iting the lowest precision of all 10 classes (0.807). NUC has
the lowest specificity as well. This is probably a result of the
characteristics of the short nuclear localization signals (NLSs)
that exist on nuclear proteins. These NLSs can vary signifi-
cantly between species. The ngLOC method, which uses a 7-
gram peptide to explore the protein sample space along the
entire length of the protein, is probably discovering many of
these NLSs in the nuclear sequences. Because the dataset
contains many examples of nuclear proteins among many
species, many candidate NLSs will be discovered, thereby
leading to over-prediction of nuclear proteins.
To obtain the sensitivity for multi-localized sequences, we
consider two types of true positive measures: at least one of
the two localizations had the highest probability, and both
localizations had the top two probabilities. The overall accu-
racy of at least one localization being correctly predicted was
81.88%, and for both localizations being correctly predicted it
was 59.7%. When considering the accuracy of both localiza-
tions being predicted to be within the top three most probable
classes, the accuracy increased to 73.8%, suggesting that this
method is useful in predicting multi-localized sequences.
Evaluation of the confidence score
A probabilistic confidence measure is an important part of
any predictive tool, because it puts a measure of credibility on
the output of the classifier. Table 2 demonstrates the utility of
our CS (range: 0 to 100) in judging the final prediction for
each sequence. We found that a score of 90 or better was
attributed to 37.5% of the dataset, with an overall accuracy of
99.8% in this range. About 86% of the dataset had a CS of 30
or higher. Although the accuracy of sequences scoring in the
30 to 40 range was only 70.1%, the cumulative accuracy of all
sequences scoring 30 or higher was 96.2%. We found that the
overall accuracy of the classifier proportionally scaled very
well across the entire range of CSs.
In Table 2, we present the performance of ngLOC under the
restriction that the correct localization for a given sequence
was predicted as the top most probable class. To understand
how close ngLOC was on misclassifications, we expanded our
true positive measure by considering correct predictions
ROC curve for 7-gram modelFigure 2
ROC curve for 7-gram model. A plot of the receiver operating
characteristic (ROC) curve for each class is shown. A typical ROC would
have the x-axis plotted to 100%. We plot only up to 5%, to reduce the
amount of overlap in the individual class plots along the y-axis and to
improve clarity. Because the minimum specificity is 0.952, plotting up to
5% is a sufficient maximum for the x-axis. CSK, cytoskeleton; CYT,
cytoplasm; END, endoplasmic reticulum; EXC, extracellular; GOL, golgi;
LYS, lysosome; MIT, mitochondria; NUC, nucleus; PLA, plasma membrane;
POX, perixosome.
0
20
40
60
80
100
0 0.5 1 1.5 2 2.5 3 3.5 4 4.5 5
Percentage of false positive
Percentage of true positive
CYT END GOL CSK LYS
MIT NUC PLA EXC POX
Genome Biology 2007, Volume 8, Issue 5, Article R68 King and Guda R68.5
comment reviews reports refereed researchdeposited research interactions information
Genome Biology 2007, 8:R68
within the top four most probable classes. As shown in Table
3, for single-localized sequences, the overall accuracy jumped
from 88.8% to 94.5% when the correct prediction is consid-
ered within the top three most probable classes. Although this
improved accuracy has no meaning for single-localized
sequences, it indicates that the majority of misclassifications
were missed by a narrow margin. For multi-localized
sequences the classifier predicted both correct localizations
as the top two most probable classes 59.7% of the time; how-
ever, the classifier predicted both correct localizations within
the top three or four classes with accuracies of 73.8% and
83.2%, respectively. We also considered the accuracy of only
those sequences localized into both the cytoplasm (CYT) and
nucleus (NUC), because they represent 51.6% of our set of
sequences with two localizations. As expected, the accuracy
increased, with at least one correct localization predicted
within the top three with an accuracy of 99.5%, and both
localizations predicted at an accuracy of 96.3% in the top four
most probable classes. The high performance for sequences
localized to both CYT and NUC is partly attributed to the fact
that this combination of organelles has the largest represen-
tation of all multi-localized sequences in the dataset (1,120
out of 2,169).
Evaluation of the multi-localized confidence score
It is known that a significant number of sequences in eukary-
otic proteomes are localized to multiple subcellular locations;
a predominant fraction of such sequences shuttle between or
localize to both the cytoplasm and nucleus. To differentiate
single-localized sequences from those that are multi-local-
ized, we developed a multi-localized confidence score
(MLCS). We evaluated the MLCS on the entire dataset, and
considered the accuracy on multi-localized sequences over
different MLCS thresholds. For accuracy assessment in this
test, a prediction is considered to be a true positive if both cor-
rect localizations are the top two most probable classes, which
is the most stringent requirement possible. As shown in Table
4, 76% of the multi-localized sequences scored an MLCS of 40
or higher, whereas 81% of the single-localized sequences have
MLCS scores under 40. Over 20% of multi-localized
sequences received a score of 90 or better, as compared with
only 0.2% of single-localized sequences in this range. Multi-
localized sequences in this range had both localizations cor-
rectly predicted 98.7% of the time. These results are very
promising, considering that multi-localized sequences com-
prise less than 10% of our entire dataset. In general, the
higher the MLCS, the more likely the sequence is not only to
be multi-localized but also to have both correct classes as the
top two predictions. Table 5 shows examples of the MLCSs
and CSs output by ngLOC for a few multi-localized sequences.
Comparing ngLOC with other methods
We evaluated the performance of ngLOC by comparing it with
that of existing methods. Comparisons were made in three
ways: by using the ngLOC dataset to train and test other
methods; by testing ngLOC on another dataset; and by train-
ing and testing ngLOC on another dataset.
For our first test, we compared ngLOC against two existing
methods, namely PSORT [24] and pTARGET [11]. Both of
these methods are widely used by the research community,
can predict 10 or more subcellular locations, and are freely
available for offline analysis. For uniformity, we used a
random selection of 80% of our dataset for training and 20%
for testing. The overall accuracies of PSORT, pTARGET, and
ngLOC are 72%, 83%, and 89%, respectively. We chose to
Table 2
Benchmarking the performance of ngLOC (7-gram) against its confidence score
Confidence score
0 10 2030405060708090
% of dataset 0.0 2.4 11.8 6.1 4.4 4.5 5.8 9.3 18.1 37.5
% overall accuracy 0.0 56.2 41.4 70.1 88.3 93.0 97.0 98.1 99.2 99.8
Cumulative % of data: 100.0 100.0 97.685.779.675.270.764.955.637.5
Cumulative % overall accuracy 88.8 88.8 89.6 96.2 98.3 98.8 99.2 99.4 99.6 99.8
This table shows how the confidence score associated with each prediction relates to the overall accuracy. The higher the score, the more likely the
prediction is to be the correct one. For example, all sequences scoring 90 or better had an accuracy of 99.8%. About 80% of the dataset was scored
40 or higher with a cumulative accuracy of 98.3%.
Table 3
Rank of correct class single-localized and multi-localized
sequences using a 7-gram model
Rank of correct class
1234
Single-localized only 88.8
a
92.2 94.5 96.3
CYT-NUC: 1 correct 88.2
a
96.1 99.5 100.0
CYT-NUC: both correct 66.5
a
82.9 96.3
All multi-localized: 1 correct 81.9
a
92.0 96.1 97.4
All multi-localized: both correct 59.7
a
73.8 83.2
This table shows the percent of the data that had the correct
localization predicted within the top r most probable classes, where r is
the rank of the correct class.
a
Items representing the overall accuracy
of ngLOC on those sequences specified. CYT, cytoplasm; NUC,
nuclear.
R68.6 Genome Biology 2007, Volume 8, Issue 5, Article R68 King and Guda />Genome Biology 2007, 8:R68
compare these three methods using the MCC values as the
comparative measure, because it is the most balanced meas-
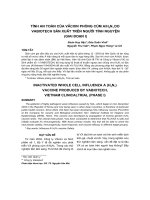
ure of performance for classification. Figure 3 compares the
MCC values on each of the 10 classes for all three methods.
Our method showed a respectable improvement across all
locations over PSORT and pTARGET, with the exception of
pTARGET's accuracy on NUC, which had a slightly higher
MCC than did ngLOC. In particular, ngLOC exhibited a signif-
icant improvement in all of the classes that had the smallest
representation in the dataset (cytoskeleton [CSK], endoplas-
mic reticulum [END], golgi apparatus [GOL], lysosome
[LYS], and perixosome [POX]), which are typically difficult to
predict.
For our next comparative test, we found a similar dataset that
has been used by the research community, namely PLOC
(Protein LOCalization prediction) [8]. The primary
differences between our data and PLOC's are in the version of
the Swiss-Prot repository from which the sequences were
acquired, the level of sequence identity assumed in the data-
set, and the multi-localized annotation in our dataset.
Sequences with up to 80% identity were allowed in the PLOC
dataset, whereas all sequences with less than 100% identity
were allowed in the ngLOC dataset. We disregarded
sequences from the PLOC dataset that are localized into the
chloroplast and vacuole, because we do not consider plant
sequences. We built both a 6-gram and a 7-gram model using
our entire dataset, and used the PLOC dataset for testing pur-
poses. We had overall accuracies of 88.04% and 85.64%,
respectively, both of which compared favorably with the
78.2% overall accuracy reported by PLOC. It is important to
note that the optimal value of n in ngLOC is dependent on the
amount of redundancy in the data being tested. A 6-gram
model performed better than a 7-gram one, which confirms
the lower redundancy in the PLOC dataset than in the ngLOC
dataset. We observed that there were some predictions with a
CS of 90 or greater but were misclassified by ngLOC. We
discovered that all sequences predicted with this level of con-
fidence that were misclassified by ngLOC were due to incor-
rect annotation, probably because of the PLOC dataset being
outdated (see Additional data file 1 [Supplementary Table 1]
for some examples). Each one was verified in the latest Swiss-
Prot entry as matching our prediction. We also found
instances in which some of the predictions misclassified by
ngLOC were actually multi-localized and should have been
considered correct as well (Additional data file 1 [Supplemen-
tary Table 2]. Our performance results are without correcting
Table 4
Evaluation of MLCS against single-localized and multi-localized sequences
MLCS
0 102030405060708090
% of Single-localized data 25.9 21.2 12.6 21.1 13.6 3.1 1.2 0.6 0.4 0.2
Cumulative %, single-localized data 100.0 74.1 52.9 40.3 19.2 5.6 2.4 1.2 0.6 0.2
% of Multi-localized data 1.7 2.1 2.3 17.9 26.2 7.8 6.2 5.3 10.0 20.5
% Overall accuracy, multi-localized sequences only 36.1 45.7 46.9 20.3 34.5 63.3 83.7 86.2 94.4 98.7
Cumulative %, multi-localized data 100.0 98.3 96.2 94.0 76.0 49.8 42.0 35.8 30.5 20.5
Cumulative % accuracy, multi-localized sequences only 59.7 60.1 60.4 60.7 70.3 89.1 93.9 95.6 97.3 98.7
This table shows the percentage of the dataset that resulted in different ranges of the MLCS, as well as the overall accuracy and cumulative accuracy
of multi-localized sequences in that range. MLCS, multi-localized confidence score.
Table 5
Examples of prediction for multi-localized sequences
Name Correct MLCS CYT END GOL CSK LYS MIT NUC PLA EXC POX
TAU_MACMU CYT/PLA 98.2 49.1
a
0.2 0.1 0.1 0.0 0.3 0.6 49.2
a
0.3 0.1
CTNB1_MOUSE CYT/NUC 85.1 49.8
a
0.1 0.0 0.0 0.0 0.1 42.2
a
7.5 0.2 0.0
3BHS2_RAT END/MIT 97.9 0.4 48.9
a
0.2 0.1 0.0 49.1
a
0.3 0.4 0.4 0.1
SIA4A_CHICK GOL/EXC 85.0 2.4 1.8 42.4
a
0.6 0.0 1.8 2.5 4.6 43.7
a
0.2
GGH_HUMAN LYS/EXC 69.1 4.4 3.1 2.1 2.0 33.7
a
3.2 5.9 5.4 39.9
a
0.3
This table presents examples of multi-localized sequences predicted with a high multi-localized confidence score (MLCS) value. The 'name' column
represents Swiss-Prot entry names. The 'correct' column shows both organelles in which the sequence is localized into. The remaining columns
show the confidence score for each possible localization. CSK, cytoskeleton; CYT, cytoplasm; END, endoplasmic reticulum; EXC, extracellular;
GOL, golgi; LYS, lysosome; MIT, mitochondria; NUC, nucleus; PLA, plasma membrane; POX, perixosome.
a
These indicate the two correct
localizations for each sequence.
Genome Biology 2007, Volume 8, Issue 5, Article R68 King and Guda R68.7
comment reviews reports refereed researchdeposited research interactions information
Genome Biology 2007, 8:R68
any annotations in the PLOC dataset. We believe that updated
annotations in the PLOC dataset, as well as updates that label
multi-localized sequences, would further improve the accu-
racy of ngLOC on the PLOC dataset.
For our final comparative test, we modified ngLOC to predict
12 distinct classes, and used the complete PLOC dataset (with
original annotations and all 12 localizations) for both training
and testing on our method, using a 10-fold cross-validation
for performance analysis. On a 6-gram model, the overall
accuracy was 82.6%, which again compared favorably with
PLOC's accuracy of 78.2%. We found numerous misclassifica-
tions that had a correct second-highest prediction (see
Additional data file 1 [Supplementary Table 3] for example
predictions). In fact, out of 12 possible classifications, ngLOC
predicted the correct localization to be within the top two
most probable classes 88.7% of the time. It is interesting to
note that even in this test we discovered some sequences that
were misclassified according to PLOC annotations, but the
prediction by ngLOC was consistent with the latest release of
Swiss-Prot (Swiss-Prot:P40541 and Swiss-Prot:P33287). We
also discovered instances where the sequence is multi-local-
ized, and ngLOC predicted the location that was not anno-
tated in the PLOC dataset (for instance, Swiss-Prot:P40630
and Swiss-Prot:P42859]. Nevertheless, we believe that these
annotations were correct at the time the PLOC dataset was
constructed. These results underscore the robustness of our
method and usefulness of its CS, because we were able to
identify outdated annotations in the PLOC dataset, identify
potential multi-localized proteins in data not annotated
accordingly, and consider alternate localizations beside the
predicted class when the CS is low, suggested by the high
accuracy when considering the top two classifications.
Evaluating ngLOC-X for proteome-wide predictions
We extended the core ngLOC method to allow classification of
proteins from a single species. We call this method ngLOC-X,
which is based on the model depicted in equation 9 (see Mate-
rials and methods, below). Assessing the performance of
ngLOC-X proved challenging, because only a small percent-
age of each proteome has subcellular localizations annotated
by experimental means, and therefore it is impossible to infer
an exact accuracy measurement on proteome-wide predic-
tions. However, subsets of these proteomes are represented
in the ngLOC dataset, and so performance analysis can be
inferred from these subsets. We chose two species for per-
forming extensive analysis: mouse (3,596 represented
sequences out of 23,744) and fruitfly (753 represented
sequences out of 9,997). (Human had the largest set, with
5,945 represented sequences; we did not test this subset
because of the amount of data that would need to be removed
from the core ngLOC dataset.) For each species, we extracted
the represented protein sequences from the ngLOC dataset
and trained ngLOC on the remaining data. After training, we
ran a 10-fold cross-validation on the extracted data, compar-
ing the performance results between the standard ngLOC
model against ngLOC-X. For this test, we examined the pre-
dictions of only single-localized sequences, resulting in 3,214
sequences from mouse and 683 sequences from fruitfly for
analysis.
The standard ngLOC model achieved overall accuracies of
93.5% and 79.5% for mouse and fruitfly, respectively. For
ngLOC-X, the overall accuracy stayed the same for mouse,
Comparison of predictions from three methods on the ngLOC datasetFigure 3
Comparison of predictions from three methods on the ngLOC dataset.
Three methods, PSORT, pTARGET, and ngLOC, were evaluated by
comparing the Matthews Correlation Coefficient (MCC) for each
localization. The MCC was chosen because it provides a balanced measure
between sensitivity and specificity for each class [23]. *The LYS location
was omitted from PSORT predictions because PSORT predicts this class
as part of the vesicular secretory pathway. CSK, cytoskeleton; CYT,
cytoplasm; END, endoplasmic reticulum; EXC, extracellular; GOL, golgi;
LYS, lysosome; MIT, mitochondria; NUC, nucleus; PLA, plasma membrane;
POX, perixosome.
Table 6
Comparison of location-wise prediction percentages for mouse
and fruitfly
Mouse (M. musculus) Fruitfly (D. melanogaster)
Location ngLOC ngLOC-X ngLOC ngLOC-X
% CYT 15.86 16.32 13.35 14.60
% CSK 0.88 2.10 0.37 1.29
% END 2.36 3.37 1.76 3.04
% EXC 11.6 12.26 12.50 13.10
% GOL 1.27 2.09 0.97 1.60
% LYS 0.46 0.98 0.24 0.67
% MIT 3.07 4.77 3.46 5.37
% NUC 33.22 30.13 43.90 39.17
% PLA 30.93 27.42 23.23 20.71
% POX 0.33 0.58 0.21 0.44
CSK, cytoskeleton; CYT, cytoplasm; END, endoplasmic reticulum;
EXC, extracellular; GOL, golgi; LYS, lysosome; MIT, mitochondria;
NUC, nucleus; PLA, plasma membrane; POX, perixosome.
0
0.1
0.2
0.3
0.4
0.5
0.6
0.7
0.8
0.9
1
CYT CSK END EXC GOL LYS* MIT NUC PLA POX
Predicted location
Matthews Correlation Coefficient
PSORT pTARGET ngLOC
R68.8 Genome Biology 2007, Volume 8, Issue 5, Article R68 King and Guda />Genome Biology 2007, 8:R68
and increased to 80.5% for fruitfly. The average sensitivity
(often reported as normalized overall accuracy) improved as
well, increasing from 86.9% to 87.5% in mouse, and from
72.6% to 74.0% in fruitfly. Although the gains in overall accu-
racy and sensitivity are not significant, we noted a significant
increase in the number of sequences predicted with high con-
fidence. For mouse, ngLOC predicted 39.1% of the data with
a CS above 90 at 99.8% accuracy, whereas ngLOC-X pre-
dicted 52.9% of the data in the same range at the same accu-
racy. Fruitfly exhibited the same effect, with ngLOC
predicting 28.1% of the data with a CS above 70 at 99.0%
accuracy, whereas ngLOC-X predicted 38.7% of the data in
the same range at 99.2% accuracy. We are sure that this is an
artifact of adjusting the n-gram probabilities to reflect the
proteome being predicted. Nevertheless, this test showed us
that incorporating the proteome for species X in the model, as
required for ngLOC-X, did not have a negative effect on the
performance compared with the standard ngLOC model,
while improving the coverage of the proteome predicted with
high confidence.
We sought to determine how the predictions would be
affected when ngLOC-X was trained on the proteome of one
species, and tested on a different species. When testing the
mouse sequences on ngLOC-X trained for fruitfly, the overall
accuracy and normalized accuracy again stayed the same.
However, when testing fruitfly on ngLOC-X trained for
mouse, the overall accuracy dropped from 80.5% to 79.2%,
which was slightly worse than the standard ngLOC model.
These tests showed us that a species with high representation
in the training data will not result in any improvement in
overall accuracy by tuning the model for a specific proteome,
but that a species with low representation will yield the
greatest benefit when the model parameters are tuned specif-
ically for that species.
Our next test was to examine the instances in these proteome
subsets in which ngLOC and ngLOC-X generated different
predictions. For the mouse data, we found 62 sequences out
of the 3,214 single-localized sequences predicted that resulted
in different predictions between the two methods. The
standard ngLOC method had 15 of these sequences predicted
correctly, whereas ngLOC-X had 16. For the fruitfly predic-
tions, there were 38 sequences out of the 683 sequences with
different predictions. Of these, ngLOC had 10 instances that
were predicted correctly, whereas ngLOC-X had 17 correct
predictions.
Table 7
Estimation of the subcellular proteomes of eight eukaryotic organisms
Yeast
(S. cerevisiae)
Worm
(C. elegans)
Fruitfly
(D. melano)
Mosquito
(A. gambiae)
Zebrafish
(D. rerio)
Chicken
(G. gallus)
Mouse
(M. musculus)
Human
(H. sapiens)
Range
Proteome 5,799 22,400 13,649 15,145 13,803 5,394 33,043 38,149
GO annotated 5,486 12,357 9,997 8,847 10,106 4,363 23,744 24,638
% ngLOC coverage 97.48 94.92 96.73 97.94 98.64 9,9.82 94.79 94.52 94.79-99.82
Proteome estimated 5,653 21,262 13,203 14,833 13,616 5,384 31,320 36,059
% CYT 15.22 14.80 12.74 14.43 15.01 13.66 13.44 14.14 12.74-15.22
% CSK 1.07 1.19 1.05 1.11 1.31 1.24 1.50 1.48 1.05-1.50
% END 2.71 3.47 2.85 3.25 3.34 2.53 2.99 3.04 2.53-3.47
% EXC 8.88 12.60 12.26 14.28 9.91 12.65 11.52 11.71 8.88-14.28
% GOL 1.48 1.31 1.40 1.07 1.68 1.47 1.52 1.56 1.07-1.68
% LYS 0.11 0.58 0.55 0.53 0.65 0.44 0.59 0.67 0.11-0.67
% MIT 9.55 5.84 4.86 5.52 4.72 4.16 4.24 4.80 4.16-9.55
% NUC 33.53 29.75 37.38 29.50 30.31 28.24 27.35 28.38 27.35-37.38
% PLA 16.19 24.41 20.06 21.36 21.66 22.78 27.18 24.08 16.19-27.18
% POX 0.54 0.66 0.42 0.48 0.51 0.25 0.44 0.46 0.25-0.66
% Single-localized 89.29 94.60 93.59 91.53 89.11 87.42 90.77 90.32
% Multi-localized 10.71 5.40 6.41 8.47 10.89 12.58 9.23 9.68
% CYT-NUC 6.49 2.36 2.76 3.44 5.40 6.27 4.51 4.74
This chart presents the location-wise percentages of the proteome predicted to localize into one organelle. (For example, 9.55% of the yeast
proteome is localized to the mitochrondria only.) These percentages sum to the total size of the proteome estimated to be single-localized. We also
present the estimated percentage of the proteome that is localized to multiple organelles. The percentage of the proteome estimated to localize to
both the cytoplasm and nucleus is also displayed. The coverage is determined with a confidence score (CS) threshold of 15. Multi-localized
sequences are determined with a multi-localized confidence score (MLCS) threshold of 60. CSK, cytoskeleton; CYT, cytoplasm; END, endoplasmic
reticulum; EXC, extracellular; GO, Gene Ontology; GOL, golgi; LYS, lysosome; MIT, mitochondria; NUC, nucleus; PLA, plasma membrane; POX,
perixosome.
Genome Biology 2007, Volume 8, Issue 5, Article R68 King and Guda R68.9
comment reviews reports refereed researchdeposited research interactions information
Genome Biology 2007, 8:R68
Although most of these improvements demonstrated by
ngLOC-X are statistically insignificant, fruitfly exhibited a
relatively greater improvement from the ngLOC-X method
than did mouse. We also discovered in both cases that almost
all sequences with different predictions between the two
methods were instances predicted with a low CS (for example,
a CS value <40.) These results may be explained by
recognizing that low-confidence predictions are more likely
for sequences from a species that does not have a high repre-
sentation of an evolutionarily close species in the training
data. The ngLOC dataset has a higher number of proteins
from species closely related to mouse (the mammalian pro-
teins) than to fruitfly. This is confirmed by the overall accura-
cies reported from ngLOC for mouse and fruitfly, which were
93.5% and 79.5%, respectively; it is also confirmed by the fact
that 90.8% of the mouse data were predicted with a CS of 40
or greater, whereas fruitfly only had 66.6% of the data pre-
dicted in the same CS range. Moreover, we believe that
ngLOC-X will have the most benefit on the predictions from a
species with low representation in the training data. This is
confirmed by the following observations. First, there was a
noticeable increase in the overall and normalized accuracy
between ngLOC and ngLOC-X on fruitfly, whereas mouse did
not benefit from ngLOC-X. Second, our cross-species test
showed that testing mouse predictions on ngLOC-X trained
for fruitfly did not affect the accuracy, whereas fruitfly
showed slightly worse performance than the standard ngLOC
method when tested on ngLOC-X trained for a mouse. Based
on these findings, it is evident that ngLOC-X will show
improvement in the accuracy of low-confidence predictions
over ngLOC. If the sequences from a species being predicted
have a high representation of evolutionarily closer species in
the training data (such as mouse), then ngLOC-X has little
value in final predictive accuracy. In either case, ngLOC-X
never resulted in a decrease in performance compared with
ngLOC, and resulted a significant increase in high confidence
predictions; hence, it is the method of choice for proteome-
wide prediction of subcellular localizations.
Our final test was to compare location-wise predictions
between ngLOC and ngLOC-X on the entire proteome for
mouse and fruitfly. For this test, we trained both methods
using the entire ngLOC dataset, and then applied each
method on the entire Gene Ontology (GO)-annotated pro-
teome data obtained. Table 6 shows the percentage of
sequences localized into each possible class. The prediction
for each sequence is determined by observing the most prob-
able class predicted, and assigning that class as the predic-
tion. In this test, all predictions are considered, meaning that
no CS threshold is assumed, and neither are multi-localized
sequences determined. Mouse had 56.8% of the 23,744 pre-
dictions for ngLOC generated with a CS of 40 or greater, as
compared with 58.1% for ngLOC-X. Fruitfly had 26.3% of the
9,997 predictions for ngLOC generated in the same range, as
compared with 35% for ngLOC-X. Again, we observed a more
substantial increase in coverage for ngLOC-X in the predic-
tions for the fruitfly proteome, a species with low representa-
tion, whereas mouse showed little increase in coverage for the
same range. There were 2,555 out of 23,744 (10.76%) differ-
ent predictions between ngLOC and ngLOC-X for mouse, and
1,126 out of 9,997 (12.02%) different predictions for fruitfly.
This test showed us that when considering predictions on a
proteome level, even a highly represented species such as
mouse will result in many predictions of low confidence, and
thus can potentially benefit from ngLOC-X as well.
We can only offer educated speculation regarding the results,
because accurate annotation is not available. However, the
proteome-wide predictions obtained by ngLOC-X are closer
to what we expect than those obtained by ngLOC. For
example, in our previous work, in which we used a completely
different method [16], we estimated that 6.3% of the pro-
Table 8
A matrix showing estimated fractions of subcellular proteomes on the human proteome
Location CYT CSK END EXC GOL LYS MIT NUC PLA POX
CYT 14.14
a
CSK 0.64 1.48
a
0.01
END 0.10 3.04
a
EXC 0.22 0.01 0.04 11.71
a
GOL 0.29 0.03 0.31 0.17 1.56
a
LYS 0.02 0.03 < 0.01 0.67
a
MIT 0.31 0.07 0.02 < 0.01 4.80
a
NUC 4.74 0.07 0.09 0.12 0.01 0.09 28.38
a
PLA 0.770.020.140.940.090.000.030.1924.08
a
POX 0.05 < 0.01 0.03 0.46
a
This chart shows the percentages of the proteome estimated to localize over 10 different organelles.
a
These cells represent the percentage of
sequences predicted to single-localize; all other cells represent multi-localized sequences. The values are based on a CSthresh of 15 and MLCSthresh of
60. CSK, cytoskeleton; CYT, cytoplasm; END, endoplasmic reticulum; EXC, extracellular; GOL, golgi; LYS, lysosome; MIT, mitochondria; NUC,
nucleus; PLA, plasma membrane; POX, perixosome.
R68.10 Genome Biology 2007, Volume 8, Issue 5, Article R68 King and Guda />Genome Biology 2007, 8:R68
teome of the fruitfly and 4.6% of the proteome of the mouse is
localized in the mitochondria. Our 5.4% and 4.8% predicted
with ngLOC-X for fruitfly and mouse, respectively, compared
favorably with our former results, and showed significant
improvement for mitochondrial estimates over ngLOC in
both cases. All of our comparative tests of ngLOC versus
ngLOC-X showed that ngLOC-X was a valuable addition to
the core ngLOC method.
Estimation of subcellular proteomes of eight
eukaryotic species
We have used ngLOC-X to estimate the subcellular proteomes
of eight different eukaryotic species. With the exception of
yeast, proteomes of eukaryotic model organisms have a
significant portion of hypothetical proteins (about 25% to
40%). To avoid predictions on hypothetical proteins, we gen-
erate predictions on a subset of the proteome containing at
least one annotated GO concept, namely those proteins that
have been experimentally validated or closely related to pro-
teins with experimental validation at some level. We then use
these predictions to generate estimates of the subcellular pro-
teome for each species.
To generate the complete results, we trained ngLOC-X using
the entire ngLOC dataset. Predictions were generated for the
GO-annotated subset of sequences for each proteome. We
selected a CS threshold that allows inclusion of all predictions
except those of very low confidence. One reason why we did
this was that ngLOC predicts only 10 subcellular locations.
However, there are other relatively minor organelles in
eukaryotic cells that proteins may localize into. (For example,
ngLOC does not predict sequences targeted for the vacuole.
Although this organelle is nearly nonexistent in higher
eukaryotic cells, it is significant in yeast cells.) These
sequences will probably result in a very low CS, because they
have no representation in the training data. The other reason
why we selected a CS threshold was that sequences that have
a low homology measure with respect to any other sequence
in the ngLOC training data will be hard to classify, and will
also result in a low CS. For these two reasons, we chose a CS
threshold (CSthresh) of 15 as the cutoff value to aid in
eliminating these sequences from the proteome estimation.
With this threshold, ngLOC covered an impressive range of
94.52% to 99.82% of the tested proteomes (Table 7). The pro-
teome estimations are based on the percentage of sequences
predicted with a CS of greater than or equal to CSthresh. We
chose an MLCS threshold (MLCSthresh) of 60 to estimate the
percentage of the proteome that is multi-localized. According
to Table 4, in a tenfold cross validation test, 42% of the multi-
localized sequences in ngLOC were predicted with an MLCS
of greater than or equal to 60 at an accuracy of 93.9%,
whereas only 2.4% of single-localized sequences were incor-
rectly predicted as multi-localized at this threshold. This is a
conservative threshold chosen to emphasize higher accuracy
on multi-localized sequences without over-prediction. We
also report the percentage of the proteome multi-localized
into both the cytoplasm (CYT) and nucleus (NUC), because
more than half of the multi-localized sequences in the ngLOC
training dataset are localized between these two organelles.
Table 7 shows the complete results. (See Additional data file 1
[Supplementary Table 4] for the corresponding chart con-
taining numeric estimates of the fractions in Table 7.)
Overall, the fractions of subcellular proteomes scaled consist-
ently across the different species, as shown in the last column
of Table 7. We observed that the percentage of sequences
localized into the endoplasmic reticulum (END), golgi
apparatus (GOL), and perixosome (POX) tend to remain rel-
atively consistent across species, with average percentages of
3.0%, 1.44%, and 0.5%, respectively. In contrast, the fractions
of the subcellular proteomes with relatively large percentages
(cytoplasm [CYT], mitochondria [MIT], nuclear [NUC],
plasma membrane [PLA], and extracellular [EXC]) varied
widely across different species. This variation is expected,
because as multicellular eukaryotes evolved with higher com-
plexity, consolidation of specific cellular functions to defined
organelles took place, resulting in the sequestering of corre-
sponding proteins to these organelles. As a result, more
variation is observed in the proteome sizes of larger
organelles. Nevertheless, the fraction of subcellular pro-
teomes reported for mouse and human are very similar,
which is expected because of their close evolutionary dis-
tance. The size of the yeast mitochondrial proteome estimate
in this study (9.55%) agrees with those previously reported
(about 10%) by computational methods [9,16], and closely
matches the experimental estimates reported (13%) [25].
Similarly, about 1,500 nucleus-encoded mitochondrial pro-
teins have been estimated in the human mitochondria [4,26]
and our estimate of 4.8% corresponds to 1,730 proteins
(Table 7 and Additional data file 1 [Supplementary Table 4]
contain numeric proteome estimates), suggesting that
ngLOC-X estimates are on par with those obtained by other
computational and experimental approaches.
Some of the organelles indicate a trend related to the evolu-
tionary complexity of the species being predicted. The frac-
tion of proteomes localized to the cytoskeleton (CSK) and
golgi (GOL) appear to exhibit an increasing trend with the
evolutionary complexity of the species, whereas mitochron-
dria (MIT) and nucleus (NUC) indicate a slight decreasing
trend. For the other organelles, such trends are not noticea-
ble. Nevertheless, we should like to point out that the pro-
teomes compared in this study are not evolutionarily
equidistant, which makes it difficult to infer trends in the evo-
lution of organellar proteomes.
Table 8 shows the prediction percentages for all single-local-
ized and multi-localized sequences in the human proteome.
The boxed areas in the table represent the percentages of sin-
gle-localized data, as presented in Table 7. The remaining
areas in the table represent multi-localized percentages. The
sum of the nonboxed cells in Table 8 will result in the percent-
Genome Biology 2007, Volume 8, Issue 5, Article R68 King and Guda R68.11
comment reviews reports refereed researchdeposited research interactions information
Genome Biology 2007, 8:R68
age multi-localized value in Table 7. Although sequences
localized to both the cytoplasm and nucleus occupy a signifi-
cant portion of the multi-localized subcellular proteome, we
found that approximately one-third of the sequences local-
ized into the cytoplasm were predicted to localize into other
organelles as well. This is probably because the cytoplasm is
the default location for protein synthesis as well as the hub of
cellular core metabolism. Similarly, almost 1% of the pro-
teome consisted of secreted proteins that were also localized
to the plasma membrane.
We compared our estimates with those generated using the
PSLT method [21]. Our estimates of the human subcellular
proteome largely agree with those reported by PSLT, with the
exception of a difference in the number of multi-localized
sequences (16.0% versus 9.7% reported by ngLOC-X), which
is probably due to our conservative choice for MLCSthresh
(≥60). (For comparison, an MLCSthresh ≥50 resulted in
13.4% of the predictions being multi-localized.) We also show
a significant difference for those proteins targeted for the
plasma membrane (17.1% versus 24.1% reported by ngLOC-
X). This may be significant, because our predictions are based
on 24,638 sequences from the human proteome, as compared
with PSLT's predictions on 9,793 sequences. Moreover, pro-
teins localized to the plasma membrane have large coverage
in the ngLOC dataset. These reasons suggest that our esti-
mates are certainly plausible. Additional data file 1
(Supplementary Tables 6 to 21) provides the complete predic-
tion matrices generated for all eight eukaryotic species.
Biological significance of discriminatory n-grams
It is well known that functional domain regions of proteins
are highly conserved because they define a vital part of the
overall functionality of the protein. From our previous stud-
ies, we observed that about 74% of the functional domains are
localized exclusively to only one of the 10 subcellular loca-
tions [11]. Hence, we wondered whether we could observe any
relationship between discriminatory n-grams and their
occurrence in the domain regions in a protein. To perform
this test, we downloaded domain definitions from the Inter-
Pro database [27]. Only domains definitions that were at least
as long as the n-gram length used in the ngLOC model were
considered. We mapped these domain definitions onto the
single-localized proteins in the ngLOC dataset. This resulted
in 15,109 protein sequences that had some portion of its
sequence mapped to a functional domain. Overall, 75.5% of
the n-grams in these sequences were mapped to a domain.
(We say that an n-gram is mapped to a domain only if the
entire n-gram falls within the bounds of a domain.) Different
localization classes had different coverage of n-grams in
domain regions, ranging from 53.7% (nuclear [NUC]) to
86.8% (lysosome [LYS]). Additional data file 1 (Supplemen-
tary Table 5) provides the complete results of this analysis.
In this study, an n-gram is said to be highly discriminatory if
its occurrence in a protein sequence is highly correlated with
a specific localization. We consider a very conservative, strict
definition of a discriminatory n-gram as an n-gram that
occurs at least five times over all sequences but in only one
localization class in the ngLOC dataset. Based on this defini-
tion, we found that only 15.0% of all n-grams were highly-dis-
criminatory. However, 91.4% of all discriminatory n-grams
occurred entirely within a domain region, suggesting that the
discriminatory n-grams indeed originate from the domain
regions. It should be noted that the number of discriminatory
n-grams found in domain regions vary among different sub-
cellular classes (ranging from 80.2% to 97.5%). Nevertheless,
all of these occurrences are statistically significant compared
with their expected values, as shown in Additional data file 1
(Supplementary Table 5).
Discussion
ngLOC method development
A multinomial naïve Bayes model is a simplistic yet effective
model when used in conjunction with the n-gram model for
representing proteins. The n-gram model is able to capture
sequence homology while allowing for differences due to
insertion, deletion, or mutation. This model effectively
shrinks the protein sequence space, thereby allowing a higher
degree of redundancy between proteins of different classes
that could not be achieved by considering the entire protein
sequence. It should be noted that the optimal value of n cho-
sen is highly dependent on two factors: the number of
sequences in the training data and the measure of sequence
similarity in the training data. Generally, both large datasets
and datasets with high sequence similarity will need longer n-
grams for effective classification, although larger values of n
will result in a model that overfits the training data. Addition-
ally, this has an affect on the CS. If the dataset is large and
highly similar, we found that short n-grams lead to
probabilities that are all relatively close in value, which
results in CSs that all fall within a very tight range. The reason
for this is that the total number of n-grams in equation 4 is
proportionally large with respect to the size of the dataset. For
example, when using a 2-gram model on our dataset, the
scores for the entire dataset all ranged between 8.41 and
11.72, but when we use a 7-gram model the range is 0.0 to
99.21. Although the scores were in a tight range for the 2-
gram, we observed the same relationship between relative
score value and overall accuracy. It would be easy to re-scale
the scores for performance analysis to fall within similar
ranges across all models.
From the protein feature space point of view, a different sized
n-gram will map protein surface features differently. We
believe that the high performance exhibited by 6- to 8-gram
models (Figure 1) is due to the fact that these n-gram peptides
are ideal for mapping the secondary structure space of pro-
teins. Secondary structure elements are vital for attaining a
proper fold of a protein, and consequently are vital for its
function. Hence, these secondary structures are distinctly
R68.12 Genome Biology 2007, Volume 8, Issue 5, Article R68 King and Guda />Genome Biology 2007, 8:R68
conserved across proteins with different functions and from
different subcellular locations.
Comparison with other methods
Many recent methods, including PLOC, were based on SVMs
[8,28,29]. As successful as some of these models have been,
we determined that SVMs were not suitable for our needs.
First, we plan to explore the most discriminatory n-grams in
proteins between different subcellular organelles. With
ngLOC, it will be easy to extract n-grams of interest from the
model, because the relation between each n-gram and the
integer identifier generated for use by the classifier is sym-
metric. However, with SVM-based methods, the kernel in the
SVM projects the features of the data to a higher dimensional
space to increase the likelihood of making the data linearly
separable. Although one might discover excellent SVM
parameters for a particular classification problem, it will be
difficult to understand how the translated feature space is dis-
criminating between classes. Second, as we have illustrated, a
probabilistic measure ought to be considered a crucial part of
any predictive model. Therefore, we determined that a pure
probabilistic model was desired. Deriving this measure is a
difficult feat for SVMs because of their nonprobabilistic out-
put. Any attempt to derive such a measure with SVMs can be
done only by creating another layer of classification to simu-
late a probability measure from the output of the SVMs. The
risk of the simulated probability distribution overfitting the
data used to generate the distribution is a known artifact with
these methods [30]. The pure probabilistic confidence meas-
ure derived directly from the probabilities calculated from a
method such as ngLOC will have a more consistent, scalable
probability measure.
Estimation of subcellular proteomes
Our model, ngLOC, was enhanced to allow dynamic adjust-
ment of the model parameters specific to a proteome being
estimated. This model, termed ngLOC-X, is useful for pre-
dicting the subcellular localization of the proteome of any
species. Our proteome prediction results showed that
although a single model can be used on a variety of species,
better results can be had if the model is tuned for a specific
species being considered (Table 6). If a single model is being
used across numerous species, it is very important to include
a broad spectrum of data across all species. Unfortunately,
this is not possible because of the imbalanced nature of pro-
tein sequence data in the public domain. Our model, ngLOC-
X, essentially extends the core ngLOC model by introducing a
bias toward a single species being predicted. The accuracy
and coverage of our model across species will continue to bur-
geon as the proteomes of new eukaryotic species become
available. The eukaryotic species selected in this study
represent a broad spectrum in the eukaryotic superkingdom
(not including plants). Despite this, corresponding fractions
of each subcellular proteome fall within a reasonable range
across species (Table 7). This suggests that the proteome size
corresponding to the core functionality of an organelle
remains unchanged across species, whereas the observed var-
iation in size allows for functionalities required by specific
species for their adaptation. This hypothesis can be tested by
studying the organellar proteomes at the domain level, and
we aim to continue this work in the future.
Discriminatory n-grams and functional domains
It is known that targeting signals such as KDEL/HDEL (for
endoplasmic reticulum) and SKL (for peroxisomes) play a
distinct role in transporting a protein to its destination in the
cell. Nevertheless, ngLOC does not require prior knowledge
regarding such signal peptides, and neither does it explicitly
consider such information in the prediction process. Despite
this, ngLOC is able to perform better than methods that
explicitly use such information because each discriminatory
n-gram is analogous to such signals. To support this argu-
ment, we demonstrated that 91.4% of all discriminatory n-
grams originate from the domain regions of proteins (Addi-
tional data file 1 [Supplementary Table 5], which define the
core function of a protein. The observations suggest that
ngLOC predictions are based on functionally significant
regions (domains) of the protein sequences, which are repre-
sented by n-grams covering the entire sequence space. In con-
trast, methods that rely on target signals generally scan only
the amino-terminal or carboxyl-terminal regions of protein
sequences, where such signals are located. It is likely that if
the targeting signals are shorter than the n-gram, then the
discriminatory n-grams represent both the signal as well as
its neighborhood (which is often very important for trans-
port). Similarly, if protein transport requires motifs that are
longer than the n-gram, such motifs would be represented by
multiple and mostly contiguous n-grams. Therefore, ngLOC
need not have prior knowledge of specific targeting signals,
because it is likely that analogous signals (discriminatory n-
grams) are inherently identified de novo and used in estab-
lishing the localization prediction of the protein. Because of
this plasticity, the ngLOC method has the ability to perform
well on a number of locations, and hence it is highly suitable
for proteome-wide prediction of subcellular localization.
Conclusion
In this new age of proteomics there is great need for compu-
tational methods that can classify newly discovered proteins
using information derived only from the primary sequence.
Methods that predict the subcellular localization of a protein
are an important part of meeting this need. In our study we
have developed the ngLOC method, a Bayesian classifier that
can predict the subcellular localization of a protein with supe-
rior performance against other methods of similar scope.
Because ngLOC is a probabilistic method, we were able to
generate an extremely useful probabilistic confidence score
(CS) that places a measure of credibility on each prediction.
We have shown how this measure was used to determine the
most likely localization for new proteins and possible annota-
Genome Biology 2007, Volume 8, Issue 5, Article R68 King and Guda R68.13
comment reviews reports refereed researchdeposited research interactions information
Genome Biology 2007, 8:R68
tion errors on known proteins. From this score, we also were
able to develop a confidence measure to aid in determining
multi-localized proteins as well, which is an important need
in this area, because a significant part of the proteome is
known to localize into multiple compartments. These scores
developed in this study are sound and useful for predicting
sequences localized to both single or multiple locations with
high accuracy.
We extended the core ngLOC method, called ngLOC-X, and
showed how it improved coverage for proteome-wide predic-
tions over a single species by performing a comparative anal-
ysis of the results from both methods. We applied ngLOC-X to
estimate ten distinct subcellular proteomes for eight eukary-
otic model organisms. To our knowledge, this study presents
the first estimate of ten distinct organelles on eight eukaryotic
species with our coverage.
As with most computational models, the accuracy of ngLOC is
completely dependent on the quality and coverage of the
dataset used to train the model. Although many methods are
unable to use large datasets because of computational limita-
tions, ngLOC does not have these limitations. Clearly, mod-
ern day proteomics will continue to produce increasing
amounts of experimentally determined data. The simplicity
of the ngLOC model will enable it to easily incorporate these
new data as they become available, thereby increasing the
accuracy and coverage of ngLOC in the future. ngLOC can
play a significant role in this field, when used in conjunction
with experimental methods, to help meet the needs of the
research community.
Materials and methods
ngLOC dataset
The dataset used for this task is a set of protein sequences
taken from the Swiss-Prot database, release 50.0 [31], which
contains experimentally determined annotations on subcel-
lular localization. We applied the following filters to obtain
high-quality data for testing and training our program: only
eukaryotic, nonplant sequences were considered; sequences
with predicted or ambiguous localizations were removed;
sequences shorter than 10 residues in length were removed;
all redundant sequences were removed; and sequences
known to localize in multiple locations were manually
checked and sorted to avoid errors caused by automated key-
word-based sorting. The final set of training data consisted of
a set of 28,056 sequences. Of these, 2,169 sequences were
annotated with two distinct subcellular localizations, of which
1,120 were localized to both cytoplasm and nucleus. Location-
wise distribution of this dataset is shown in Table 9.
Proteome datasets
We downloaded the proteomes of eight eukaryotic model
organisms from the Integr8 database [32], which include
Saccharomyces cerevisiae (yeast), Caenorhibditis elegans
(worm), Drosophila melanogaster (fruitfly), Anopheles gam-
biae (mosquito), Danio rerio (zebrafish), Gallus gallus
(chicken), Mus musculus (mouse), and Homo sapiens
(human). Because 25% to 40% of these proteomes are
hypothetical proteins (with the exception of yeast), we sepa-
rated the curated proteome subsets containing annotation for
at least one of the three GO concepts, but not including those
with GO evidence codes: ND (no biologic data available), RCA
(reviewed computational analysis), and NAS (nontraceable
author statement).
Performance measurements
We report standard performance measures over each subcel-
lular location class, denoted as c
j
, including the following:
sensitivity (recall), which is the fraction of data in class c
j
that
were correctly predicted; precision, which is the fraction of
data predicted to be in class c
j
that were actually correct; spe-
cificity, which is the fraction of data not in class c
j
that were
correctly predicted; false positive rate, which is the fraction of
data not in class c
j
that were incorrectly predicted to be in
class c
j
; and MCC. The latter provides a measure of perform-
ance for a single class being predicted, where it equals 1 for
perfect predictions on that class, 0 for random assignments,
and less than 0 if predictions are worse than random [23].
We also report overall accuracy, defined as the fraction of
data that were classified correctly, as a comparative measure
of the overall performance of the classifier. Finally, we show a
ROC curve as a graphical means of measuring the perform-
ance for each class. (All of our formulas used to measure per-
formance are detailed in Additional data file 1.) All
performance measurements are based on a standard 10-fold
cross validation unless otherwise stated.
Table 9
Distribution of proteins over subcellular localizations
Organelle Code Number of
sequences
Cytoplasm CYT 2,884
Cytoskeleton CSK 248
Endoplasmic
Reticulum
END 939
Extracellular EXC 7,536
Golgi apparatus GOL 282
Lysosome LYS 166
Mitochrondria MIT 2,442
Nuclear NUC 4,658
Plasma membrane PLA 6,530
Perixosome POX 202
2 localizations
annotated
2,169
Total 28,056
R68.14 Genome Biology 2007, Volume 8, Issue 5, Article R68 King and Guda />Genome Biology 2007, 8:R68
The n-gram model for protein representation
Letting S denote the feature space used to represent all pro-
teins, we develop S and our predictive model in light of the
significant work that has been accomplished in the field of
document classification. Cheng and coworkers [33] showed
that using document classification techniques on the primary
sequence can achieve good results on classifying protein fam-
ilies. In a typical document classification model, S is
constructed by considering all possible words that may
appear throughout the entire set of documents. Here, we con-
sider subsequences of a protein of fixed length n as the equiv-
alent of words in a document. In literature, these protein
subsequences have been commonly called n-grams, n-mers,
n-peptides, or simply words or subsequences of length n
[34,35]. We adopt the term n-gram. In protein classification
tasks using the n-gram model, S is constructed by considering
all possible n-grams.
Formally, we let Σ represent the set of all possible amino
acids, and |Σ| = 20. Given a dataset of protein sequences D,
let d
i
be a sequence in D having k residues in length, where d
i
= (s
1
s
2
s
k
) and each s
i
∈ Σ. In an n-gram model, the size of
the feature space grows exponentially with n, because |S| =
|Σ|
n
. To illustrate, an integer variable typically requires four
bytes of memory. If such a variable was used to keep track of
the frequency of each of the possible 5-grams, the model
would require 4 bytes × 20
5
features = 12.8 MB of memory, a
6-gram model would require 256 MB, and a 7-gram requires
5.1 GB of memory. Fortunately, for large values of n, relatively
few n-grams actually occur in nature because of the evolu-
tionary selection process, which requires a delicate mixture of
various amino acid combinations in a peptide to sustain a
fold. A simple analysis on the entire National Center for Bio-
technology Information nonredundant dataset (2.7 million
protein sequences at the time of this analysis) showed that an
n-gram length as small as n = 5 had examples that never
occurred. Therefore, to allow n-gram models for n > 5, we
take advantage of the sparse nature of higher order n-grams
by developing a one-to-one mapping between unique n-
grams and the set of integers to be used as indices, as needed.
This requires memory allocation only for n-grams that occur
in the training data, thereby allowing exploration of large val-
ues of n.
Naïve Bayes classifiers and subcellular localization
Bayesian predictive models have been effectively used in a
variety of classification problems, including both document
and protein classification tasks [33,36-38]. We give a brief
derivation of the model in the context of protein subcellular
localization prediction, using similar notation as depicted by
McCallum and Nigam [36].
Given a protein sequence d
i
, a probabilistic approach to sub-
cellular localization prediction is to develop a model to esti-
mate the probability that d
i
is localized into each c
j
∈ C, where
C represents the set of all possible localization classes. The
classifier h predicts the localization of d
i
to the class that has
the greatest posterior probability. Equation 1 shows this in
probabilistic terms, and shows how the well known Bayes rule
is used to derive an estimate for this probability.
An accurate Bayesian classifier is dependent on accurate esti-
mates for the probabilities on the right-hand side of equation
1. The denominator P(d
i
) is dropped because it is constant.
The prior probability of each subcellular localization c
j
,
denoted P(c
j
), is estimated from D by counting the number of
sequences assigned to class c
j
, divided by the total number of
sequences in D:
P(d
i
| c
j
), the posterior probability of protein sequence d
i
given
location c
j
, is the difficult parameter to estimate. As
discussed, we use the n-gram model to represent proteins. We
make the naïve Bayes assumption, in which the occurrence of
the t
th
n-gram in S, denoted w
t
, is identically and independ-
ently distributed (IID) with respect to every other n-gram in
S, where each w
t
follows a Bernoulli distribution. In reality,
this is not a correct assumption, because n-grams are clearly
not independent of each other. An accurate probabilistic
model based on n-grams would need to consider a joint dis-
tribution over all possible combinations of n-grams, which is
The n-gram model for representing proteins in ngLOCFigure 4
The n-gram model for representing proteins in ngLOC. This figure depicts
the process of extracting n-grams from an example protein sequence for
cytoplasm (CYT), and shows how the table of frequencies of n-grams
maintained by the model is updated accordingly. For this example, n = 4.
The n-grams in bold indicate updated table entries as a result of processing
the sequence. POX, perixosome.
MLSFQYPDVYRDETAVQDYHGHKICDPYAW LEDP
AAAA 5
AAAC 2
AAAD 1
. . .
LSFQ 5
. . .
MLSE 0
MLSF 3
MLSG 1
. . .
SFQW 0
SFQY 2
SFRA 3
. . .
YYYY 0
MLSF
SFQY
LSFQ
w
i
w
i+1
w
i+2
.
.
Collection of k-n+1
n-grams
CYT
Protein sequence for cytoplasm (CYT) o f length k
AAAA 2
AAAC 0
AAAD 1
. . .
LSFQ 2
. . .
MLSE 1
MLSF 0
MLSG 0
. . .
SFQW 2
SFQY 1
SFRA 4
. . .
YYYY 0
POX
Update n-gram counts
Extract n-grams
hd Pc d
Pd c Pc
Pd
i
c
ji
c
ij j
i
jj
( ) argmax ( | ) arg max
(|)()
()
==
(1)
Pc
j
c
j
()=
(2)
Genome Biology 2007, Volume 8, Issue 5, Article R68 King and Guda R68.15
comment reviews reports refereed researchdeposited research interactions information
Genome Biology 2007, 8:R68
an impossible task because of the exponential amount of
memory required and because sequences vary in length.
Fortunately, the IID assumption has worked well in practice.
With these assumptions, each sequence d
i
is viewed as a col-
lection of unordered n-grams generated by a random process
following a multinomial distribution [36]. Estimating the
posterior probabilities for each class simply involves counting
n-gram occurrences in the dataset for each class separately
(Figure 4). If a sequence in the dataset is multi-localized, then
it will have multiple class labels. In this case, the count of n-
grams for each class that sequence is localized to will be
updated equally. We let N
it
be the count of the number of
occurrences of n-gram w
t
in sequence d
i
. Under these distri-
bution assumptions, we can derive an estimate for the proba-
bility of a sequence, given a class, as follows:
The first term is disregarded because of equation 1. The prob-
ability of sequence d
i
given class c
j
is then estimated as the
product of the probabilities of all n-grams that occurred in d
i
for that particular class. To estimate P(w
t
| c
j
), the posterior
probability of n-gram w
t
given class c
j
, we use the LaPlace cor-
rection to prevent zero probabilities from being calculated
and count the number of occurrences of w
t
in all sequences
belonging to that class:
To prevent loss of precision, we convert the probability in
equation 3 to a log-probability, which allows us to take the
sum of the log of the probabilities calculated in equation 4.
Probabilistic confidence score
An advantage in using a probabilistic model, such as a naïve
Bayes classifier or a Hidden Markov Model, over nonprobabi-
listic approaches is that the probability of the model generat-
ing a given sequence is inherently reported for every class.
Although the prediction is based on the model with the high-
est probability, the probability can also be used as a compar-
ative measure against other classes. If the predicted class had
a low probability, it might suggest that the second or third
highest predictions should also be considered. If the top two
classes predicted were relatively high compared to the rest of
the classes, it might suggest the possibility that the sequence
is localized into both locations. We develop a probabilistic CS
for sequence d
i
for each possible class c
j
, denoted CS(d
i
| c
j
),
and show how this is used to address each of the above issues.
We also derive a multi-localized confidence score, denoted
MLCS(d
i
), that gives a probabilistic measure of sequence d
i
being multi-localized.
For a given sequence d
i
, we define d
null
to be a sequence of null
symbols of a length that is equal to the length of d
i
. (A null
symbol can be any symbol s such that s ∉ Σ. Each n-gram in
d
null
is guaranteed never to occur in the model. To calculate
the probability that each class generated d
null
, we can use this
fact to simplify the calculations of equations 3 and 4, giving
us:
We then set minNullProb to be the minimum joint probabil-
ity of d
null
and class c
j
across all classes:
A log-odds ratio that sequence d
i
is targeted for location c
j
against minNullProb is calculated and then normalized by
dividing by the sum over all log-odds scores, to create a sepa-
rate score for each subcellular location c
j
for a given sequence
d
i
as follows:
The range for each score will always be between 0 and 100,
with the sum of the scores over all classes totaling 100. This
CS can also be interpreted as an estimate of the conditional
probability of class c
j
, given sequence d
i
and the n-gram
model used.
The multi-localized confidence score for sequence d
i
(equa-
tion 8) is derived from the CSs of the two most probable
classes for that sequence, denoted as CS
1
and CS
2
, respec-
tively. This score is designed to give a relative measure of the
likelihood that sequence d
i
is multi-localized into two
organelles.
Application of ngLOC to proteome-wide predictions
Most protein classification models, including ngLOC, are
built using datasets from sequences over many species across
the eukaryotic superkingdom. In fact, the ngLOC dataset
exhibited in Table 9 contains proteins from 1,923 different
species. This introduces another variable that can be
observed. Although some methods indirectly observe the
relationship between the species and the dependent variable
by incorporating phylogenic information in their model, it is
usually not directly observed. However, it is known that in the
case of subcellular localization the distribution between
Pd c
N
N
Pw c
ij
it
t
it
t
tj
N
t
it
(|)
!
(!)
(|)=
()
∑
∏
∏
(3)
Pw c
Count w in class c
Tota gram class
tj
tj
|
()
(
()
=
+
+−
1
ln sin
cc
j
)
(4)
Pd c P
Tota gram class c
null j
j
kn
|
(
()
=
+−
⎛
⎝
⎜
⎜
⎞
⎠
⎟
⎟
−+
()
1
1
ln sin
(5)
min PrNull ob Pc Pd c
c
jnullj
j
=
()( )
()
∈
min |
(6)
CS c d
Pc Pd c Null ob
Pc Pd c
ji
jij
ki
|
|
|
()
=
()( )
()
−
()
()
log log
log
min Pr
kk
k
Null ob
()
()
−
()
()
∗
∑
log min Pr
100
(7)
MLCS d CS CS
CS CS
i
()
=+
()
−
−
()
12
1
2
2
2
100 0.
(8)
R68.16 Genome Biology 2007, Volume 8, Issue 5, Article R68 King and Guda />Genome Biology 2007, 8:R68
classes varies among species. For example, one study of mito-
chondrial proteins estimates that 9.9% of the yeast proteome
is localized in the mitochondria, as compared with an esti-
mated 4.8% of the human proteome [16]. Another study esti-
mated that as much as 13% of the yeast proteome is localized
in the mitochondria [25]. It is clear that the predictions for
the proteome of a specific species can be improved if the prior
probability P(c
j
) is known for the species being predicted.
Unfortunately, this information is not available before
classification.
We extend equation 1 by introducing another random varia-
ble X that will represent the species being predicted. We will
refer to the model that incorporates the proteome in this
manner as ngLOC-X:
We only need to consider the two terms in the denominator
for reasons stated previously. We solve for P(d
i
| c
j
, X), the
probability of a protein sequence, given subcellular localiza-
tion c
j
and species X, by assuming a mixture model of two
independent conditional probability distributions over the
space of protein sequences. One distribution is over proteins
with known subcellular localization but unknown species,
and the other distribution is over proteins of a known species
but unknown subcellular localization. This forms a mixture
model of two distributions, formally stated as follows:
P(d
i
| c
j
, X) = α
j
P(d
i
| c
j
) + (1 - α
j
) P(d
i
| X)(10)
The component P(d
i
| c
j
) is estimated as given in equation 3.
The component P(d
i
| X) is estimated in the same way; how-
ever, we let N
it
be the count of the number of occurrences of
n-gram w
t
in the proteome for species X, and P(w
t
| c
j
) is
replaced by P(w
t
| X), which is the probability of n-gram w
t
,
given species X. To estimate α, the mixture proportion for
P(d
i
| c
j
), we use the following:
The mixture model allows us to consider the distribution of n-
grams over an entire proteome by adjusting the probabilities
of each n-gram in the training data to represent more accu-
rately the distributions of n-grams in the proteome being
classified. The result is that the distribution of P(w
t
| c
j
) over
all n-grams will be more similar to that of the proteome, while
retaining the relative probabilities of each class within indi-
vidual n-grams learned from the labeled data.
Solving for P(c
j
| X) is difficult because we do not know the
distribution of subcellular localizations in a given species, and
neither can it be observed before classification. However, we
incorporate the proteome for species X using a LaPlacean-
type of estimate, adding the proteome data to each class. The
result is shown in equation 12, where D
x
represents the data-
set consisting of sequences from the proteome of species X:
This method can cause the probability estimates for P(c
j
| X)
to become more uniform in proportion to the size of the data-
set of the proteome (D
x
) being considered. We accept this ten-
dency, because it implicitly factors in a measure of
uncertainty proportional to the size of the proteome being
considered, meaning the larger the proteome, the more
uncertainty there is in regard to the exact prior probabilities
of each subcellular localization. In this case, the priors should
not be based solely on the exact percentages of the ngLOC
training data.
Additional data files
The following additional data files are available with the
online version of the paper. Additional data file 1 contains all
of the formulas used for performance measurements and
Supplementary Tables 1-21. Additional data file 2 contains
the actual ngLOC dataset.
Additional data file 1Formulas used for performance measurements and supplementary materialProvided are all of the formulas used for performance measure-ments and Supplementary Tables 1-21.Click here for fileAdditional data file 2ngLOC datasetProvided is the actual ngLOC dataset. It is a FASTA formatted file. The header format for each sequence is > SP_name loc [/loc2], where SP_name is the Swiss-Prot name of the protein sequence, from release 50.0, loc is a single letter representing subcellular localization for this sequence, and/loc2 is an optional field that exists only if the sequence is multi-localized. The letter codes for subcellular localization are as follows: C (CYT), cytoplasm; K (CSK), cytoskeleton[E (END), endoplasmic reticulum; S (EXC), extracellular/secreted; G (GOL), Golgi; L (LYS), lysosome; M (MIT), mitochondria; N (NUC), nucleus; P (PLA), plasma mem-brane; X (POX), perixosome.Click here for file
Acknowledgements
This work has been supported by the startup funds to CG from the State
University of New York (SUNY) at Albany and the graduate student fellow-
ship provided by the Gen*NY*sis Center for Excellence in Cancer Genom-
ics, SUNY at Albany.
References
1. Yates JR 3rd, Gilchrist A, Howell KE, Bergeron JJ: Proteomics of
organelles and large cellular structures. Nat Rev Mol Cell Biol
2005, 6:702-714.
2. Andersen JS, Mann M: Organellar proteomics: turning invento-
ries into insights. EMBO reports 2006, 7:874-879.
3. Simpson JC, Pepperkok R: The subcellular localization of the
mammalian proteome comes a fraction closer. Genome Biol
2006, 7:222.
4. Taylor SW, Fahy E, Ghosh SS: Global organellar proteomics.
Trends Biotechnol 2003, 21:82-88.
5. Nakai K, Kanehisa M: A knowledge base for predicting protein
localization sites in eukaryotic cells. Genomics 1992,
14:897-911.
6. Chou KC, Elrod DW: Protein subcellular location prediction.
Protein Eng 1999, 12:107-118.
7. Reinhardt A, Hubbard T: Using neural networks for prediction
of the subcellular location of proteins. Nucleic Acids Res 1998,
26:2230-2236.
8. Park KJ, Kanehisa M: Prediction of protein subcellular locations
by support vector machines using compositions of amino
acids and amino acid pairs. Bioinformatics 2003, 19:1656-1663.
9. Marcotte EM, Xenarios I, van der Bliek AM, Eisenberg D: Localizing
proteins in the cell from their phylogenetic profiles. Proc Natl
Acad Sci USA 2000, 97:12115-12120.
10. Nair R, Rost B: Better prediction of sub-cellular localization by
combining evolutionary and structural information. Proteins
2003, 53:917-930.
11. Guda C, Subramaniam S: pTARGET: a new method for
Pc dX
Pd c XPc X
Pd X
ji
ij j
i
|,
|, |
|
()
=
()()
()
(9)
α
j
j
j
Tota gram class c
Tota gram class c
=
−
()
−
()
+
ln sin
ln sin
TTota gram species Xln sin −
()
(11)
Pc X
j
cX
X
j
|
()
=
+
+
()
(12)
Genome Biology 2007, Volume 8, Issue 5, Article R68 King and Guda R68.17
comment reviews reports refereed researchdeposited research interactions information
Genome Biology 2007, 8:R68
predicting protein subcellular localization in eukaryotes. Bio-
informatics 2005, 21:3963-3969.
12. Höglund A, Blum T, Brady S, Dönnes P, Miguel JS, Rocheford M, Kohl-
bacher O, Shatkay H: Significantly improved prediction of sub-
cellular localization by integrating text and protein sequence
data. Pac Symp Biocomput 2006, :16-27.
13. Eskin E, Agichtein E: Combining text mining and sequence anal-
ysis to discover protein functional regions. Pac Symp Biocomput
2004, :288-299.
14. Nair R, Rost B: Sequence conserved for subcellular
localization. Protein Sci 2002, 11:2836-2847.
15. Emanuelsson O, Nielsen H, Brunak S, von Heijne G: Predicting sub-
cellular localization of proteins based on their N-terminal
amino acid sequence. J Mol Biol 2000, 300:1005-1016.
16. Guda C, Fahy E, Subramaniam S: MITOPRED: a genome-scale
method for prediction of nucleus-encoded mitochondrial
proteins. Bioinformatics 2004, 20:1785-1794.
17. Gardy JL, Spencer C, Wang K, Ester M, Tusnady GE, Simon I, Hua S,
deFays K, Lambert C, Nakai K, Brinkman F: PSORT-B: improving
protein subcellular localization prediction for Gram-nega-
tive bacteria. Nucleic Acids Res 2003, 31:3613-3617.
18. Zhou GP, Doctor K: Subcellular location prediction of apopto-
sis proteins. Proteins 2003, 50:44-48.
19. Dönnes P, Höglund A: Predicting protein subcellular localiza-
tion: past, present, and future. Genomics Proteomics Bioinformatics
2004, 2:209-215.
20. Hamady M, Cheung TH, Resing K, Cios KJ, Knight R: Key challenges
in proteomics and proteoinformatics. Progress in proteins.
IEEE Eng Med Biol Mag 2005, 24:34-40.
21. Scott MS, Thomas DY, Hallett MT: Predicting the subcellular
localization via protein motif co-occurrence. Genome Res
2004, 14:1957-1966.
22. Huang Y, Li Y: Prediction of protein subcellular locations using
fuzzy k-NN method. Bioinformatics 2004, 20:21-28.
23. Matthews BW: Comparison of the predicted and observed sec-
ondary structure of T4 phage lysozyme. Biochim Biophys Acta
1975, 405:442-451.
24. Nakai K, Horton P: PSORT: a program for detecting the sort-
ing signals of proteins and predicting their subcellular
localization. Trends Biochem Sci 1999, 24:34-35.
25. Kumar A, Agarwal S, Heyman JA, Matson S, Heidtman M, Piccirillo S,
Umansky L, Drawid A, Jansen R, Lui Y, et al.: Subcellular localiza-
tion of the yeast proteome. Genes Dev 2002, 16:707-719.
26. Lopez MF, Kristal BS, Chernokalskaya E, Lazarev A, Shestopalov AI,
Bogdanova A, Robinson M: High-throughput profiling of the
mitochondrial proteome using affinity fractionation and
automation. Electrophoresis 2000, 21:3427-3440.
27. The InterPro Database [ />28. Höglund A, Dönnes P, Blum T, Adolph HW, Kohlbacher O: Multi-
Loc: prediction of protein subcellular localization using N-
terminal targeting sequences, sequence motifs and amino
acid composition. Bioinformatics 2006, 22:1158-1165.
29. Yu CS, Chen YC, Lu CH, Hwang JK: Prediction of protein subcel-
lular localization. Proteins 2006, 64:643-651.
30. Drish J: Obtaining Calibrated Probability Estimates from Support Vector
Machines: Technical Report San Diego, CA: University of Califorina at
San Deigo; 2001.
31. The UniProtKB/Swiss-Prot Protein Knowledgebase [http://
www.ebi.ac.uk/swissprot]
32. Integr8: Complete genome and proteome database [http://
www.ebi.ac.uk/integr8]
33. Cheng BY, Carbonell JG, Klein-Seetharaman J: Protein classifica-
tion based on text document classification techniques.
Pro-
teins 2005, 58:955-970.
34. Ganapathiraju M, Weisser D, Rosenfeld R, Carbonell J, Reddy R,
Klein-Seetharaman J: Comparative n-gram analysis of whole-
genome protein sequences. Proceedings of the Human Language
Technolgy Conference (HLT 2002): 24-27 March; San Diego 2002.
35. Fofanov Y, Luo Y, Katili C, Wang J, Belosludtsev Y, Powdrill T,
Belapurkar C, Fofanov V, Li TB, et al.: How independent are the
appearances of n-mers in different genomes? Bioinformatics
2004, 20:2421-2428.
36. McCallum A, Nigam K: A comparison of event models for naïve
Bayes text classification. In AAAI-98 Workshop on Learning for Text
Classification: 26-30 July; Madison AAAI Press; 1998.
37. Mitchell T: Machine Learning Boston, MA: WCB/McGraw-Hill; 1997.
38. Duda R, Hart P, Stork D: Pattern Classification New York, NY: John
Wiley & Sons, Inc; 2001.