Báo cáo y học: "Threshold-free high-power methods for the ontological analysis of genome-wide gene-expression studies." pptx
Bạn đang xem bản rút gọn của tài liệu. Xem và tải ngay bản đầy đủ của tài liệu tại đây (1.34 MB, 12 trang )
Genome Biology 2007, 8:R74
comment reviews reports deposited research refereed research interactions information
Open Access
2007Nilssonet al.Volume 8, Issue 5, Article R74
Method
Threshold-free high-power methods for the ontological analysis of
genome-wide gene-expression studies
Björn Nilsson
*
, Petra Håkansson
*†
, Mikael Johansson
†
, Sven Nelander
‡
and
Thoas Fioretos
*
Addresses:
*
Department of Clinical Genetics, Lund University Hospital, SE-221 85 Lund, Sweden.
†
Department of Automatic Control, Royal
Institute of Technology, SE-100 44 Stockholm, Sweden.
‡
Computational Biology Center, Memorial Sloan-Kettering Cancer Center, New York,
NY 10021, USA.
Correspondence: Björn Nilsson. Email:
© 2007 Nilsson et al.; licensee BioMed Central Ltd.
This is an open access article distributed under the terms of the Creative Commons Attribution License ( which
permits unrestricted use, distribution, and reproduction in any medium, provided the original work is properly cited.
Ontological gene-expression analysis<p>New ontological analysis methods are described for microarray data interpretation that, unlike existing approaches, are threshold-free and statistically powerful.</p>
Abstract
Ontological analysis facilitates the interpretation of microarray data. Here we describe new
ontological analysis methods which, unlike existing approaches, are threshold-free and statistically
powerful. We perform extensive evaluations and introduce a new concept, detection spectra, to
characterize methods. We show that different ontological analysis methods exhibit distinct
detection spectra, and that it is critical to account for this diversity. Our results argue strongly
against the continued use of existing methods, and provide directions towards an enhanced
approach.
Background
A fundamental challenge in genome-wide gene-expression
studies is to translate complex microarray data into an under-
standing of the biological conditions being studied. A widely
used approach to this problem is ontological analysis - or
functional gene-category analysis - the aim of which is to ena-
ble data interpretation in the light of known functional rela-
tionships between genes. In essence, the methodology seeks
to identify categories of functionally associated genes - prede-
fined in external ontologies such as the Gene Ontology Con-
sortium taxonomy [1] - that show deviating expression
patterns compared to the general gene population. The
underlying motivation is that such categories are presumably
likelier to be biologically relevant than gene categories whose
expression patterns do not exhibit distinctive features.
Most ontological analysis approaches published so far rely on
discrete statistical procedures (binomial, hypergeometric,
chi-square or Fisher's exact test) to test for relative enrich-
ments of gene categories within lists of significant genes [2].
These methods are widely used and numerous software pack-
ages exist. Nevertheless, discrete methods suffer from a draw-
back in that the results fundamentally depend on an
(essentially arbitrary) threshold for calling genes differen-
tially or non-differentially expressed [3,4].
To overcome this problem, threshold-free methods for iden-
tifying potentially relevant gene categories were recently pro-
posed. Most of these are based on the Kolmogorov-Smirnov
(KS) goodness-of-fit test [3-6], although rank-based
approaches have also been suggested [7,8]. The important
conceptual advantage of threshold freedom is that the expres-
Published: 8 May 2007
Genome Biology 2007, 8:R74 (doi:10.1186/gb-2007-8-5-r74)
Received: 6 January 2007
Revised: 2 April 2007
Accepted: 8 May 2007
The electronic version of this article is the complete one and can be
found online at />R74.2 Genome Biology 2007, Volume 8, Issue 5, Article R74 Nilsson et al. />Genome Biology 2007, 8:R74
sion data for all genes are considered simultaneously, without
the uncertainty associated with previous gene list extraction.
In the study reported here, we enhance the ontological analy-
sis methodology in several important respects. Particularly,
we first consider enhanced methods for detecting potentially
relevant gene categories. These methods are based on classi-
cal and recent examples of a particular class of goodness-of-
fit techniques - empirical distribution function (EDF) statis-
tics - that are threshold-free and can be expected to have high
statistical power: that is, the chance of detecting a relevant
gene category, given it is there, is increased. We carefully
assess each method using extensive simulations and by appli-
cation to multiple real microarray datasets. Second, we
develop a new concept, 'detection spectra', which serves to
map the prototypic gene categories that are preferentially
detected by a given method. We show that different ontologi-
cal analysis methods exhibit distinct detection spectra, and
that it is critical to be aware of this diversity. We also show
that, in terms of detection spectrum, the methods represent a
continuum ranging from KS on the one extreme to the dis-
crete methods on the other, whereas the remaining methods
exhibit intermediate properties. In particular, one method
based on the Zhang C (ZC) statistic qualifies as an effective,
threshold-free replacement for discrete methods, something
that has been previously lacking. Third, to simplify the char-
acterization of detected categories in terms of underlying
enrichments of over- or underexpressed genes, we equip each
method with an indicator function. These functions indicate
the direction of transcriptional deviation, and support the
biological interpretation of the ontological analysis results.
Finally, we develop a fast significance computation scheme
that allows EDF-based analyses to be performed in acceptable
time. In conclusion, we introduce attractive alternatives to
existing methods for the ontological analysis of microarray
experiments, and give directions for the choice of method in
practice.
Results
Evaluation by simulation
We first performed an extensive series of simulations, care-
fully designed to systematically assess the ability of each
method to detect gene categories with varying expression pat-
tern deviations (details in Materials and methods). In short,
we simulated the global gene population by drawing 10,000
gene scores from a standard normal distribution. To simulate
gene categories with known deviations, we used a mixture
model [4] in which a proportion of the genes are given scores
from a modulated normal distribution whereas the remaining
genes scores follow a standard normal distribution like the
population (Figure 1). Four parameters control the types of
categories modeled: the number of genes in the category (N);
the proportion of modulated genes (
π
); and the mean and
standard deviation of the modulated gene scores (
μ
and
σ
). By
varying these parameters, we could artificially recreate gene
categories with a broad range of score-distribution
dissimilarities.
Detection spectra
To achieve near-exhaustive testing, we selected 1,800 param-
eter configurations from wide and relevant intervals, and
determined the method powers for each one (see Materials
and methods). Hence, for each method, we obtain an 1,800-
dimensional performance profile, or detection spectrum,
indicating the category types that can be detected.
We determined the detection spectra for the EDF-based
methods and, for completeness, a discrete method with six
thresholds for calling genes differentially expressed (D1 to
D6; see Materials and methods). As evident in Figure 2 and
Additional data file 1, the detection power varied considerably
between methods and between category types: First, all meth-
ods worked well for detecting high-proportion-high-effects
categories (Figure 2, upper right pie charts), but failed for
low-proportion-low-effects categories (Figure 2, lower left pie
charts). Second, all methods performed uniformly better in
large than in small categories, owing to the fact that larger
categories allow for detection of subtler deviations. Third,
much more interestingly, substantial performance differ-
ences were observed for low to intermediate modulation
effect sizes or proportions. In particular, some methods were
better suited for detecting low-proportion-high-effects cate-
gories (Figure 2, lower right pie charts) whereas others were
more apt for detecting high-proportion-low-effects categories
(Figure 2, upper left pie charts). For low-proportion-high-
effects categories, ZC and Zhang K (ZK) yielded the best
results, followed by Zhang A (ZA) and Anderson-Darling
(AD) (see Materials and methods). The discrete method also
worked well, but exhibited strong threshold dependency. For
high-proportion-low-effects categories, KS, the Cramér-von
Mises (CM) statistic, and AD yielded the best results for nar-
row (
σ
= 0.1), intermediate (
σ
= 0.5) and diffuse (
σ
= 1.0)
effect spreads, respectively. This is consistent with the fact
that narrow effects spreads cause discrepancies near the
center of the category gene score distribution (KS optimal),
whereas intermediate and diffuse spreads lead to dissimilari-
ties which, to greater extents, engage the tails (AD better
suited). Fourth, we estimated the coverages of the detection
spectra by computing overall (average) powers. The highest
values were observed for AD, ZA, ZC, and ZK, implying that
these methods are able to detect a broader range of categories
than discrete and previous threshold-free (KS-based) meth-
ods (Additional data file 2). Taken together, these simulations
clearly show that different ontological analysis methods focus
on different types of categories, and provide an exact map of
the method performances under varying circumstances.
Method-method relationships
To gain an overview of the mutual method relationships, we
next quantified the method-method agreements, that is, the
expected concordances between results, by computing the
Genome Biology 2007, Volume 8, Issue 5, Article R74 Nilsson et al. R74.3
comment reviews reports refereed researchdeposited research interactions information
Genome Biology 2007, 8:R74
Spearman and Jaccard metrics (see Materials and methods)
for all pairs of category-detection statistics. Interestingly,
multidimensional scaling (MDS) of the resulting similarity
matrices (Additional data file 3) showed that, property-wise,
the methods represent a continuum ranging from the high-
proportion-low-effects-focused (that is, center oriented) KS
and CM at the one extreme to the low-proportion-high-
effects-focused (that is, tail oriented) discrete method on the
other with the remaining methods in between (Figure 3). In
particular, we observe that ZC is the closest threshold-free
approximation to the discrete method, and, hence, should be
regarded as an appealing replacement for that method. Fur-
thermore, we note that ZK is only slightly less tail oriented
than ZC, and that the pairs ZA versus AD, and KS versus CM
yield similar results. Moreover, because MDS captures the
largest variability in the data, Figure 3 shows that a major
determining factor of detection spectrum diversity lies in the
methods' preferences for detecting high-proportion-low-
effects or low-proportion-high-effects categories. In conclu-
sion, the agreement data summarize the method relation-
ships, and provide directions for the choice of method in
practice.
Application to real data
We proceeded to apply all methods to real microarray data,
starting with a dataset from a recent study of ours (P.H., B.N.,
A Andersson, C Lassen, U Gullberg, and T.F., unpublished
work). The aim of this study was to map the transcriptional
response of cells to the activity of the fusion oncogene BCR/
ABL1, associated with chronic myeloid leukemia (CML), in a
reverse way by blocking the activity of the fusion protein
using the tyrosine-kinase inhibitory drug imatinib mesylate
[9]. Essentially, expression profiles of imatinib-treated and
non-treated CML cell lines were acquired, and gene scores
quantifying the imatinib response were computed (see Mate-
rials and methods).
As shown in Table 1, ontological analysis of the gene scores
computed from the data from the imatinib experiment con-
firmed that the choice of method strongly influences the
results when applied to real data. The overlaps between sets
of detected categories approximately followed the simula-
tions (Table 1), as did the category rankings (data not shown).
Consistent with the overall power simulations, the threshold-
free methods detected more categories than the discrete
method, whereas the difference between the threshold-free
methods were less pronounced (Figure 4). Investigating the
putative biological relevance of the detected categories (Table
1), we noted several gene categories previously implicated in
BCR/ABL1-mediated leukemogenesis or in the effects of
imatinib. For example, consistent with data in the literature,
significant enrichments of overexpression were observed in
the categories 'heme biosynthesis', and enrichments of
underexpression in the 'interferon-gamma signaling path-
way', the 'MAPKKK cascade', and in categories related to
apoptosis regulation. Also identified was the 'EGF receptor
pathway', individual members of which are known to become
phosphorylated/activated by BCR/ABL1. Taken together,
these findings support the validity of the ontological analysis
methodology. Finally, to point at important connections
between gene score distributions and detection spectra, and
to exemplify the utility of the indicator functions, we selected
four illustrative categories, which are discussed in Figure 5.
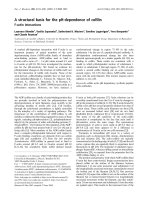
Simulation model used for artificially recreating gene categories with known expression pattern deviationsFigure 1
Simulation model used for artificially recreating gene categories with known expression pattern deviations. (a) Density distribution for the reference
population (dashed black line), the modulated genes (dotted black line), and the resulting mixture (solid blue line). (b) Corresponding cumulative
distributions. The parameter values used in this example were
π
= 0.2,
μ
= 1.0, and
σ
= 1.0, modeling a low-proportion admixture of moderately
overexpressed genes.
−5 05
0
0.1
0.2
0.3
0.4
0.5
Gene score
Density distribution
Population genes
Modulated genes
Category genes
−5 05
0
0.2
0.4
0.6
0.8
1
Gene score
Cumulative distribution
Population genes
Modulated genes
Category genes
(a)
(b)
R74.4 Genome Biology 2007, Volume 8, Issue 5, Article R74 Nilsson et al. />Genome Biology 2007, 8:R74
Detection spectraFigure 2
Detection spectra. (a) Partial detection spectra (N = 30,
σ
= 0.5; complete spectra in Additional data file 1; raw data in Additional data file 5) for the EDF-
based methods. (b) Corresponding results for the discrete method with six different thresholds for calling genes differentially expressed (t). The sector
radiuses are proportional to the parameter-specific powers. The mappings between sectors and methods are given in the in-figure legends. Key
observations: (1) Different ontological analysis methods exhibit distinct detection spectra. (2) The threshold-free methods exhibit higher coverages than
the discrete method, that is, they detect more diverse category types. (3) The discrete method, which is currently the most commonly used method,
exhibits strong threshold-dependency, that is, it needs tweaking to yield good results. (4) Important differences are seen between the threshold-free
methods (commented under Results).
Proportion of modulated genes (π)
Proportion of modulated genes (π)
1.00
0.90
0.80
0.70
0.60
0.50
0.40
0.30
0.20
0.10
1.00
0.90
0.80
0.70
0.60
0.50
0.40
0.30
0.20
0.10
0.2 0.4 0.6 0. 8 1.0 1.2 1.4 1.6 1.8 2.0 2.2 2.4 2.6 2.8 3.0 3.2 3.4 3.6 3.8 4.0
Mean effect size for modulated genes (μ)
0.2 0.4 0.6 0. 8 1.0 1.2 1.4 1.6 1.8 2.0 2.2 2.4 2.6 2.8 3.0 3.2 3.4 3.6 3.8 4.0
Mean effect size for modulated genes (μ)
AD - Anderson-Darling
CM - Cramervon Mises
ZA - Zhang A
ZC - Zhang C
ZK - Zhang K
D1 - Discrete, t=1.5
D2 - Discrete, t=1.8
D6 - Discrete, t=3.0
D5 - Discrete, t=2.7
D4 - Discrete, t=2.4
D3 - Discrete, t=2.1
(a)
(b)
KS - Kolmogorov-Smirnov
Genome Biology 2007, Volume 8, Issue 5, Article R74 Nilsson et al. R74.5
comment reviews reports refereed researchdeposited research interactions information
Genome Biology 2007, 8:R74
Application to other studies
To verify the generality of our results, we applied all methods
to 25 other differential expression comparisons (Additional
data file 4) based on seven publicly available microarray data-
sets (see Materials and methods). While a detailed descrip-
tion of the vast amount of resulting data is beyond the scope
of this paper, we point out the following recurrent observa-
tions. First, as in Table 1, the choice of method strongly
impacted on the results in accordance with the simulated
method-method agreements. Second, the numbers of
detected categories also approximately followed the simu-
lated method relationships. In broad outline, the threshold-
free methods detected many more categories than the
discrete methods, because of the noticeable difference in
overall power between these two groups. In contrast, the dif-
ferences within the threshold-free group were less pro-
nounced and more variable, which is explained by the fact
that these methods have more similar overall powers, imply-
ing that the number of detected categories will, to a greater
extent, be determined by the match between the detection
spectrum and the set of deviating categories that are actually
present in the data. Taken together, these findings further
underscore the fact that different methods focus on different
category types, and, hence, that it is important to be aware of
this in practice.
Computational efficiency
The total time required for analyzing the 25 studies (all meth-
ods and ontologies) was 32 seconds (C++ implementation; 2
GHz Core2Duo PC), illustrating the benefit of the fast signifi-
cance computation scheme (see Materials and methods).
Discussion
The ontological analysis of genome-wide studies relies funda-
mentally on the validity and continued growth of ontologies
providing annotations of gene function. However, efficient
computational methods are needed to integrate these annota-
tions with data in an optimal way. We have addressed the lat-
ter problem by considering gene-category identification
methods based on high-power EDF statistics.
We have shown that the value of these methods lies in their
higher overall powers - implying an ability to detect a broader
range of potentially biologically relevant gene categories - and
in their detection spectra, which are distinct from those of
existing methods. Previously, KS-based and discrete
approaches have focused on high-proportion-low-effects and
low-proportion-high-effects deviations, respectively [4],
whereas methods with intermediate detection spectra and
threshold-free methods for detecting low-proportion-high-
effects deviations have been lacking. The methods described
fill these gaps. In particular, our data suggest ZC to be a new
method of choice for low-proportion-high-effects-oriented
analysis. Offering excellent low-proportion-high-effects cov-
erage, high overall power and the obvious advantages of
threshold freedom, ZC virtually removes the need for discrete
methods. Regarding the remaining methods, ZK is slightly
Method relationshipsFigure 3
Method relationships. These are visualized using multidimensional scaling of the (a) Spearman and (b) Jaccard similarities (Additional data file 3).
Proximate methods can be expected to yield similar category rankings (Spearman case) and sets of significant categories (Jaccard case). The figure shows
that, property-wise, the methods range from KS and CM at the one extreme to the discrete method on the other (D1 to D6), whereas the other methods
exhibit intermediate behaviors. Notably, ZC, with its strong ability to detect low-proportion-high-effects deviations, constitutes a threshold-free
replacement for the discrete method. Method abbreviations are defined in Figure 2.
−0.3 −0.2 −0.1 0 0.1 0.2 0.3
−0.3
−0.2
−0.1
0
0.1
0.2
0.3
AD
CM
KS
ZA
ZC
ZK
D1
D2
D3
D4
D5
D6
First MDS com
p
onent
Second MDS component
−0.2 −0.1 0 0.1 0.2
−0.2
−0.1
0
0.1
0.2
AD
CM
KS
ZA
ZC
ZK
D1
D2
D3
D4
D5
D6
First MDS com
p
onent
Second MDS component
(a) (b)
Method relationships (Spearman metric)
Method relationships (Jaccard metric)
R74.6 Genome Biology 2007, Volume 8, Issue 5, Article R74 Nilsson et al. />Genome Biology 2007, 8:R74
Table 1
Functional profile of the imatinib-induced transcriptional response
KS CM AD ZA ZK ZC D1 D2 D3 D4 D5 D6 Δ
ZC
Δ
ZK
Size* Biological process (GO)
+ + -1.00 -1 3 'de novo' IMP biosynthesis
++ +++++++++ +1.00+15 Heme biosynthesis
+ -1.00 -1 3 Inactivation of MAPK activity
+ + -1.00 -1 5 Intracellular transport
+ -1.00 -1 5 Negative regulation of apoptosis
+ -0.87 -1 22 Regulation of transcription
+ + -0.97 -1 7 Regulation of translational initiation
+ + -1.00 -1 7 Translational initiation
KS CM AD ZA ZK ZC D1 D2 D3 D4 D5 D6 Δ
ZC
Δ
ZK
Size* Biological process (ABI)
+ + + +1.00 +1 17 Hematopoiesis
+ + + + -1.00 -1 25 Inhibition of apoptosis
++ +++ -0.89-19 Macrophage-mediated immunity
++ +++ -0.99-137 MAPKKK cascade
+ + + + -1.00 -1 21 Protein complex assembly
+ -1.00 -1 4 rRNA metabolism
KS CM AD ZA ZK ZC D1 D2 D3 D4 D5 D6 Δ
ZC
Δ
ZK
Size* Molecular function (GO)
+ + + + -0.90 -1 257 ATP binding
+ -0.61 -1 17 ATP-dependent helicase activity
+ + + + + -0.91 -1 57 GTPase activity
+ + + + + -1.00 -1 3 Protein kinase C activity
+ -1.00 -1 6 Protein tyrosine phosphatase activity
+ + + + + + -0.93 -1 95 RNA binding
+ + + + + -0.91 -1 14 Translation initiation factor activity
KS CM AD ZA ZK ZC D1 D2 D3 D4 D5 D6 Δ
ZC
Δ
ZK
Size* Molecular function (ABI)
+ -0.87 -1 18 Protein kinase
KS CM AD ZA ZK ZC D1 D2 D3 D4 D5 D6 Δ
ZC
Δ
ZK
Size* Molecular pathway (ABI)
+ -1.00 -1 23 EGR receptor signaling pathway
+ + + + + + + + -1.00 -1 8 Interferon-gamma signaling pathway
+ + + + -1.00 -1 3 Metabotropic glutamate receptor group I pathway
KS CM AD ZA ZK ZC D1 D2 D3 D4 D5 D6 Δ
ZC
Δ
ZK
Size* Cellular component (GO)
+ + + + -1.00 -1 147 Cytoplasm
+ + + + +1.00 +1 4 Kinesin complex
+ + + + + + + +0.73 +1 9 Microtubule associated complex
+ + + + -0.93 -1 23 Nuclear pore
+ + + -1.00 -1 24 Nucleolus
+ + -1.93 -1 21 Ribonucleoprotein complex
Gene categories in the imatinib data (P.H., B.N., A Andersson, C Lassen, U Gullberg, and T.F., unpublished work) called significant by at least one of
the category-detection methods (25% false-discovery rate; significance indicated by +). Key observations: (1) The choice of method strongly
influences the results. (2) The method-method agreements observed on real data approximately follow those observed in the simulations (see Figure
3). (3) Several detected categories are consistent with literature data on BCR/ABL1-mediated leukemogenesis, supporting the validity of the
methodology (see main text). (4) The table illustrates the use of indicator functions to determine the direction of transcriptional deviation in
detected categories. In this case, ZC and ZK exemplify soft indicators (available for AD, CM, ZA, and ZC) and the less informative hard indicators
(available for KS and ZK), respectively (see also Figure 5). *By size, we mean the number of unique genes (Entrez Gene IDs) within the category.
Genome Biology 2007, Volume 8, Issue 5, Article R74 Nilsson et al. R74.7
comment reviews reports refereed researchdeposited research interactions information
Genome Biology 2007, 8:R74
less tail oriented than ZC; ZA and AD focus on intermediate-
proportion- moderate-effects categories; Finally, CM resem-
bles KS.
As shown, the choice of category-detection method has a pro-
found impact on the results of the ontological analysis. How-
ever, the question of what prototypic categories are most
biologically relevant, and hence should be the primary target
in ontological analyses, is an open problem. In the absence of
solid evidence supporting that one category type is generally
more biologically relevant than others, the choice of method
must be partly guided by the investigator's preferences and
project-specific considerations. For example, in data contain-
ing strongly differentially expressed genes (for example, the
imatinib study presented here), it may be natural to optimize
the analysis for low-proportion-high-effects categories, mak-
ing the tail-sensitive methods (ZC, ZK and discrete) the meth-
ods of choice. On the other hand, in datasets where
differentially expressed genes display predominantly low-to-
moderate effect sizes, it seems more reasonable to focus on
intermediate-proportion-moderate-effects and high-propor-
tion-low-effects categories, motivating the choice of methods
with more center-oriented detection spectra in this case.
Alternatively, multiple methods can be used in concert, pro-
vided that appropriate statistical corrections are made. Such
an approach would yield results tables similar to Table 1, and
offers the benefit of allowing the user to make indirect conclu-
sions about the characteristics of the distributional deviations
of the detected categories. For example, if a category is
detected as significant by all methods (for example, the heme
biosynthesis category in the imatinib experiment), then, quite
clearly, its gene-score distribution must be highly aberrant,
most probably because of a high-proportion-high-effects size
enrichment. In contrast, if a category is called significant by
one method (for example, AD with the EGF receptor signaling
pathway in the imatinib data), and not by the others, then the
distributional deviations must fall within the detection spec-
tra of that method but outside the detection spectra of the
other methods. In the EGF receptor signaling pathway exam-
ple, a reasonable conclusion - given the detection spectra
established in Additional data file 1 - would be that underlying
deviation is likely to be of intermediate-proportion-moder-
ate-effects-size type, as such categories represent the detec-
tion optimum of AD.
Regardless of category-detection statistic, the reference gene
population, null model, gene score, and ontology also influ-
ence the results and must be chosen judiciously [2,3,7]. We
recognize that a shared limitation of many ontological analy-
sis methods, ours included, is that dependencies between
genes are not taken into account when computing significan-
ces, something that may lead to underestimated p values.
First steps have been taken to develop dependency-modeling
schemes, for example SAFE [3] or CatMap [7]. While the
methods described can be adopted into those frameworks if
desired, additional efforts are needed to address the problem
of modeling dependencies in detail.
Other features introduced are indicator functions and a fast
significance computation scheme. The indicator functions
facilitate the interpretation of the results of the ontological
Application of the various methods to real dataFigure 4
Application of the various methods to real data. (a) EDF methods;(b) discrete methods. The plots show the total numbers of categories detected (all six
ontologies) in the imatinib data (P.H., B.N., A Andersson, C Lassen, U Gullberg, and T.F., unpublished work) at various false-discovery rates. Method
abbreviations are defined in Figure 2.
0 10 20 30 40 50
0
20
40
60
80
100
False discover
y
rate
(
%
)
Number of identified categories
KS
CM
AD
ZA
ZK
ZC
0 10 20 30 40 50
0
20
40
60
80
100
False discover
y
rate
(
%
)
Number of identified categories
D1
D2
D3
D4
D5
D6
(b)(a)
Imatinib data: EDF-based analysis Imatinib data: Discrete analysis
R74.8 Genome Biology 2007, Volume 8, Issue 5, Article R74 Nilsson et al. />Genome Biology 2007, 8:R74
analysis. Their advantage compared to existing approaches is
that the need for two separate tests per category, one to detect
enrichment of overexpression and one to detect enrichment
of underexpression, is removed. A limitation is that
enrichments cannot be distinguished from (contralateral)
depletions. Such ambiguities can be resolved graphically
(Figure 5), or through the development of improved versions
in future studies. The fast significance computations are not
crucial to the ontological analysis as such, but are valuable in
that they allow the procedure to be performed within an
acceptable time-frame.
Finally, we recognize the limitations of the gene-category
model used for computing the detection spectra. First, as
already discussed, the model assumes independence between
genes. Second, for tractability, we have limited our treatment
to gene categories with only one group of the modulated
genes. While the model could be extended to multiple modu-
lated groups, this would obviously increase the complexity of
the study at the expense of presentational clarity and under-
standability. Third, we have only considered gene scores with
approximately normal distributions, which is a minor limita-
tion as the most frequently used gene scores are based on t-
statistics. Nevertheless, the properties of the described meth-
ods for scores with distinctly different distributions (for
example, scores based on the F-statistic) remain to be
established.
Conclusion
We have presented novel ontological analysis methods con-
stituting attractive alternatives to existing approaches.
Hence, this work contributes to the repertoire of useful meth-
ods aiding the interpretation of genome-wide gene expression
studies.
Materials and methods
Threshold-free category-detection methods
Let F
N
(x) and F(x) denote the empirical (cumulative) distri-
bution functions for the gene-specific differential expression
scores x
1
, ,x
N
for an N-gene category and the scores x'
1
, ,x'
M
for an M-gene reference gene population, respectively. We
consider six EDF statistics to measure discrepancy between
F
N
(x) and F(x), that is, to detect gene categories with deviat-
ing gene-score distributions. A technicality that arises is that,
normally when using EDF statistics, F(x) is specified by a con-
tinuous function. This is obviously not the case here as F(x) is
an EDF, jumping by 1/M at each x'
i
. However, we note that, in
this application, this issue can be ignored because M is large
(on the order of 5,000 to 40,000), making F(x) sufficiently
smooth to be regarded as continuous.
First, we consider the Kolmogorov-Smirnov (KS) statistic
[10,11], which is, without doubt, the best-known EDF statistic
and, as stated above, has been used previously for ontological
analysis. The KS statistic is the largest distance between F(x)
and F
N
(x)
where y
i
= F(x
i
). While intuitively straightforward and capa-
ble of detecting discrepancies near the center of the distribu-
tion, KS fails to notice subtle discrepancies in the tails as well
as small but consistent deviations. Second and third, we use
two members of the Cramér-von Mises family of quadratic
EDF statistics, defined by
where
ψ
(x) is a suitable weight function. We consider
ψ
(x) =
1, which generates the Cramér-von Mises (CM) statistic itself
[12]
which is able to integrate small consistent deviations,
regarded as more powerful than KS, but is still not optimal for
detecting discrepancies in the tails. Therefore, we also con-
sider
ψ
(x) = F(x)
-1
(1-F(x))
-1
which gives more weight to the
tails and generates the Anderson-Darling (AD) statistic [13]
Fourth, fifth, and sixth, we include three EDF statistics
recently derived by Zhang [14]. These are denoted Zhang A
(ZA), Zhang C (ZC) and Zhang K (ZK) to reflect theoretical
relationships with AD, CM, and KS. However, simulations
have shown that the Zhang statistics are sometimes substan-
tially more powerful [14]. The derivations of the Zhang statis-
tics are beyond the scope of this paper, but can be found in the
original work. The computing formulas are:
DFxFx
i
N
yy
i
N
xR
N
iN ii
=−
=−−
−
∈
=
sup
max
|()()|
max{ , },
1
1
NFxFx xdFx
N
( () ()) () (),−
∫
2
−
∞
∞
ψ
WN FxFxdFx
N
y
i
N
N
i
i
N
22
1
2
1
12
21
2
=−
=+ −
−
−∞
∞
=
∫
∑
(() ()) ()
(),
AN
Fx Fx
Fx Fx
dF
N
N
iy
N
i
2
2
1
1
21 1
=
−
−
=− − − + −
−∞
∞
∫
(() ())
()( ())
( )(ln ln( yy
Ni
i
N
+−
=
∑
1
1
)).
Z
y
Ni
y
i
Z
y
N
A
ii
i
N
C
i
=−
−+
+
−
−
=
−
−
=
−
∑
(
/
()
/
),
(
(/)/
ln ln
ln
12
1
12
1
12
1
2
1
((/)
),
(( ) (
/
)( )
max
i
Zi
i
Ny
Ni
i
N
Ki N
i
−−
=−
−
+−+
=
=
∑
34 1
1
2
12 1
2
1
1
ln lln(
/
()
)).
Ni
Ny
i
−+
−
12
1
Genome Biology 2007, Volume 8, Issue 5, Article R74 Nilsson et al. R74.9
comment reviews reports refereed researchdeposited research interactions information
Genome Biology 2007, 8:R74
Discrete category detection methods
For comparison, we also included a discrete category-detec-
tion method in the study. As a representative of this class of
methods, we used the binomial test, which is routinely used
as an approximation to hypergeometric procedures, such as
Fisher's exact test, when the population is large. The technical
details can be found in standard statistics textbooks or in
work on ontological analysis (see [2] and references therein).
Throughout, we used six thresholds for calling genes differen-
tially expressed (1.5, 1.8 to 3.0; denoted D1 to D6) and used
gene scores that would always be compatible with these val-
ues (see Microarray datasets).
Category characterization methods
While the EDF statistics effectively detect deviating - and thus
presumably biologically relevant - gene categories, they do
not, in their basic form, indicate whether the deviations are
caused by enrichments of overexpressed genes, under-
Links between distributions, detection spectra and indicator functionsFigure 5
Links between distributions, detection spectra and indicator functions. To illustrate important connections between gene score distributions, detection
spectra, and indicator functions, we selected four categories from the imatinib data. (a) The category 'MAPKKK cascade' exhibits a heavy lower tail,
exemplifying a low-proportion-high-effects enrichment of underexpressed genes. As expected, this category was detected by ZK and ZC. (b) The
category 'EGF receptor signaling pathway' has normal tails but is left-shifted midway between the center and the tails, consistent with an intermediate-
proportion-moderate-effects enrichment of underexpressed genes. This category was detected by AD. Whereas these two examples receive indicator
values near -1 because they are enriched in underexpressed genes, category 'hematopoiesis' (c) exhibits a right-shifted distribution, implying indicator
values near 1. (d) Category 'development', identified at a slightly higher false-discovery rate, has a heavy lower tail as well as a right-shifted center, and
exemplifies mixed enrichments (intermediate AD, CM, ZA, and ZC indicator values).
−5 0 5
0
0.2
0.4
0.6
0.8
1
Gene score
Cumulative distribution
MAPKKK cascade (ABI)
Population
Category
−5 0 5
0
0.2
0.4
0.6
0.8
1
Gene score
Cumulative distribution
EGF receptor signaling pathway (ABI)
Population
Category
−5 0 5
0
0.2
0.4
0.6
0.8
1
Gene score
Cumulative distribution
Hematopoiesis (ABI)
Population
Category
−5 0 5
0
0.2
0.4
0.6
0.8
1
Gene score
Cumulative distribution
Development (GO)
Population
Category
(a) (b)
(c) (d)
R74.10 Genome Biology 2007, Volume 8, Issue 5, Article R74 Nilsson et al. />Genome Biology 2007, 8:R74
expressed genes, or a mixture of both. In previous
approaches, this problem has been addressed by performing
two separate tests for each category, one to detect enrich-
ments of overexpression and one to detect enrichments of
underexpression. Here, we proceed differently and instead
derive an indicator for each detection method. The advantage
of these functions is that the direction of transcriptional devi-
ation is determined in a continuous manner, removing the
need for double testing.
In the case of CM, AD, ZA, and ZC, these statistics can be
readily rewritten as , where
δ
i
are defined separately
for each statistic and depend on x
i
and y
i
(calculations not
shown). We let the indicators Δ be the raw correlation
between and ,
that is,
When the denominator is zero, we let Δ = 0. For KS and ZK,
which are based on max operators instead of sums, we let
Δ = sign(F
N
(x
i
) - F(x
i
)),
where i is the index used when computing the KS or ZK statis-
tic. The Δ indicators characterize gene categories by consider-
ing the distributional dissimilarities that led to their
detection. In categories with unexpectedly many over-
expressed genes, we have F
N
(x
i
) ≤ F(x
i
) for all i, implying Δ =
1. Conversely, categories with unexpectedly many under-
expressed genes, will receive Δ = -1. Moreover, for CM, AD, ZA
and ZC, Δ will attain intermediate values depending on the
balance between the two types of genes. The KS and ZK
indicators are less informative, evaluating to either -1 or 1
depending on the predominant direction of deviation.
Significance computations
The null distributions for the EDF statistics are unknown,
and, in some cases (ZA, ZC and ZK), asymptotic theory is
lacking. To compute significances, we therefore used a proce-
dure based on Monte Carlo simulation by gene permutations,
which is currently a standard scheme in ontological analysis
although it does not account for dependencies between genes.
More elaborate schemes seeking to model dependencies
using sample label permutations have been suggested [3,7],
and the methods above can be adopted into those frameworks
if needed.
In principle, the null distributions could be simulated from
scratch for every category. However, that approach turned
out to be exceedingly time-consuming. We instead note that
the assumed continuity of F(x) implies that the EDF statistics
are distribution-free. Hence, their null distributions can be
pre-computed by drawing y
i
's from a uniform distribution, a
procedure that is essentially equivalent to permuting genes
when the population is large (assumed). This strategy com-
pletely avoids simulations at runtime, allowing entire onto-
logical analyses to be performed in instants. Throughout, the
distributions were pre-simulated using 10
8
Monte Carlo rep-
licates (per category size and statistic), and were compressed
to tractable sizes using a recent algorithm (B.N. unpublished
work).
Simulation model
To simulate the reference gene score population, we drew
10,000 scores from a standard normal distribution (zero
mean, unit variance). This choice is motivated by the fact that
differential expression is frequently assessed using the t-sta-
tistic or variance-moderated versions thereof [15-17], in
which cases the population scores will be approximately nor-
mally distributed as most genes are non-differentially
expressed. Furthermore, to simulate deviating gene catego-
ries, we used the mixture model previously proposed in [4], in
which a proportion of the category genes are given scores
from a modulated normal distribution (non-zero mean, non-
unit variance) whereas the remaining genes are given scores
from a standard normal like the reference population (Figure
1). The model parameters are: the number of category genes
(N), the proportion of modulated genes (
π
), the mean (effect
size) of the modulated gene scores (
μ
), and the standard error
(effects spread) of the modulated gene scores (
σ
). The param-
eter values were: N = 10, 30 and 100 genes, which are typical
category sizes;
π
= 0.1, 0.2 to 1.0, which is essentially exhaus-
tive;
μ
= 0.2, 0.4 to 4.0, covering very weak to very strong
effects. Because the EDF statistics are distribution-symmet-
ric, negative and positive
μ
values will yield identical results.
Hence, the evaluation can be restricted to positive values
without loss of generality. Finally,
σ
= 0.1, 0.5 and 1.0, corre-
sponding to narrow, intermediate and diffuse effects spreads,
respectively. Thus, the total number of four-parameter com-
binations was 3 × 10 × 20 × 3 = 1,800. For each combination,
100,000 random categories were generated and tested for
conformity with the population distribution. The parameter-
configuration-specific statistical powers were estimated as
the proportions of categories called significant at the p <
0.001 level (the full set of raw data is in Additional data file 5).
To verify robustness, the experiments were repeated with
numerous other cutoff levels, yielding results in broad agree-
ment with those presented.
To quantify the diversity of category types detected, we com-
puted overall (average) powers across all parameter configu-
rations and across
π
and
μ
for fixed N and
σ
. To quantify
method-method agreements, we computed the Spearman
rank correlation and the Jaccard similarity coefficient (or
Jaccard index) for all pairs of methods. The Spearman metric,
the correlation between the rank-transformed p values,
measures similarity between category rankings. The Jaccard
δ
i
i
N
=
∑
1
δδ
= {}
i
N
1
′
=−⋅
δδ
{ ( () ()) }sign Fx Fx
Ni i i
N
1
+=
<
′
>
′
=
⋅−
=
=
∑
∑
δδ
δδ
δ
δ
,
(() ())
22
2
1
2
1
iNii
i
N
i
i
N
Fx Fxsign
Genome Biology 2007, Volume 8, Issue 5, Article R74 Nilsson et al. R74.11
comment reviews reports refereed researchdeposited research interactions information
Genome Biology 2007, 8:R74
similarity coefficient, the proportion of categories called sig-
nificant by both methods, reflects similarity between sets of
detected categories.
Microarray datasets
The imatinib data (P.H., B.N., A Andersson, C Lassen, U Gull-
berg, and T.F. unpublished work) were generated at our lab
by culturing five CML cell lines in the presence or absence of
imatinib mesylate. Expression profiles were obtained at 3 and
12 h after drug exposure using 27 K cDNA arrays. For each
time point and treatment group, two technical replicates were
obtained, yielding 2 × 2 × 2 = 8 arrays per cell line. After fil-
tering and probe merging, 5,532 unique Entrez Gene entries
remained. The full set of microarray data will be made availa-
ble upon acceptance of the original work.
In addition to the dataset from the imatinib experiment, we
included seven publicly available expression array datasets.
The Valk dataset [18] and the Radich dataset [19] were
obtained from the NCBI Gene Expression Omnibus reposi-
tory [20], accessions GSE1159 and GSE4170, respectively.
The Zheng dataset [21] was obtained from the ArrayExpress
repository [22]. The Bhattacharjee dataset [23] was obtained
from the Broad Institute website [24]. The Ross dataset [25]
was obtained from the St Jude Children's Research Hospital
website [26]. The Andersson dataset [27] was obtained by
personal communication with the corresponding author. The
West dataset [28] was obtained from the Duke University
website [29].
As a score of differential expression, we used Smyth's moder-
ated t-statistic [15], which follows an approximate t-distribu-
tion under the null hypothesis whenever the data are
reasonably normal. Hence, in any given study, the variance of
the population scores will be near one, guaranteeing that the
thresholds used with the discrete method are meaningful.
Ontologies
A total of six ontologies from the Gene Ontology (GO) Consor-
tium [30] and the Applied Biosystems Panther Gene Classifi-
cation System (ABI) [31] were used: Biological Process
(GO+ABI), Molecular Function (GO+ABI), Cellular Compo-
nent (GO), and Molecular Pathway (ABI). The ontology ver-
sions used in the analyses were those available in December
2006.
Software availability
To allow readers to readily apply the described methods to
their own data, we provide a software package called Render-
Cat (stand-alone Windows executable). This software is pub-
licly and freely available on request from B.N. The source
code is open and can be downloaded from the SourceForge
repository [32]. The package includes implementations of all
the category-detection methods described, including the indi-
cator functions and the fast significance computations. For
the convenience of the user, we have also included
functionality for creating tables similar to Table 1 (tab-delim-
ited text or LaTeX format) and capability for rendering gene-
category score-distribution plots similar to Figure 5 (bitmap
format). To correct for multiple testing, the program uses the
false-discovery rate [33,34].
Additional data files
Additional data are available online with this paper. Addi-
tional data file 1 is a figure representing the complete results
of the simulation study. Additional data file 2 is a table listing
overall powers. Additional data file 3 is a table containing the
complete data from the method-method agreement assess-
ment study. Additional data file 4 contains a list of additional
differential expression studies. Additional data file 5 contains
the raw data used for generating the detection spectra.
Additional data file 1A figure representing the complete results of the simulation studyA figure representing the complete results of the simulation study.Click here for fileAdditional data file 2A table listing overall powersA table listing overall powers.Click here for fileAdditional data file 3A table containing the complete data from the method-method agreement assessment studyA table containing the complete data from the method-method agreement assessment study.Click here for fileAdditional data file 4A list of additional differential expression studiesA list of additional differential expression studies.Click here for fileAdditional data file 5The raw data used for generating the detection spectraThe raw data used for generating the detection spectra.Click here for file
Acknowledgements
This work was supported by research grants from the Swedish Cancer
Society, the Swedish Children's Cancer Foundation, and the Medical Faculty
of Lund University. We thank Jill Storry for superb proofreading of the
manuscript.
References
1. Ashburner M, Ball C, Blake J, Botstein D, Butler H, Cherry J, Davis A,
Dolinski K, Dwight S, Eppig J, et al.: Gene ontology: tool for the
unification of biology. The Gene Ontology Consortium. Nat
Genet 2000, 25:25-29.
2. Khatri P, Draghici S: Ontological analysis of gene expression
data: current tools, limitations, and open problems. Bioinfor-
matics 2005, 21:3587-3595.
3. Barry W, Nobel A, Wright F: Significance analysis of functional
categories in gene expression studies: a structured permuta-
tion approach. Bioinformatics 2005, 21:1943-1949.
4. Ben-Shaul Y, Bergman H, Soreq H: Identifying subtle interrelated
changes in functional gene categories using continuous
measures of gene expression. Bioinformatics 2005, 21:1129-1137.
5. Mootha V, Lindgren C, Eriksson K, Subramanian A, Sihag S, Lehar J,
Puigserver P, Carlsson E, Ridderstrale M, Laurila E, et al.: PGC-
1alpha-responsive genes involved in oxidative phosphoryla-
tion are coordinately downregulated in human diabetes. Nat
Genet 2003, 34:267-273.
6. Lamb J, Ramaswamy S, Ford H, Contreras B, Martinez R, Kittrell F,
Zahnow C, Patterson N, Golub T, Ewen M: A mechanism of cyclin
D1 action encoded in the patterns of gene expression in
human cancer. Cell 2003, 114:323-334.
7. Breslin T, Eden P, Krogh M: Comparing functional annotation
analyses with Catmap. BMC Bioinformatics 2004, 5:193.
8. Lee H, Braynen W, Keshav K, Pavlidis P: ErmineJ: tool for func-
tional analysis of gene expression data sets. BMC Bioinformatics
2005, 9:269.
9. Deininger M, Buchdunger E, Druker B: The development of imat-
inib as a therapeutic agent for chronic myeloid leukemia.
Blood 2005, 105:2640-2653.
10. Kolmogorov A: Sulla determinazione empirica di una legge di
distibuziane. Giorna Ist Attuari 1933, 4:83-91.
11. Smirnov N:
Estimate of deviation between empirical distribu-
tion functions in two independent samples. Bull Mosk Univ
1939, 2:3-16.
12. Cramér H: On the composition of elementary errors: II, Sta-
tistical applications. Skand Akt 1928, 11:141-180.
13. Anderson T, Darling D: A test of goodness of fit. J Am Stat Ass
1954, 49:765-769.
14. Zhang J: Powerful goodness-of-fit tests based on the likelihood
ratio. J R Stat Soc B 2002, 64:281-294.
15. Smyth G: Linear models and empirical Bayes methods for
assessing differential expression in microarray experiments.
R74.12 Genome Biology 2007, Volume 8, Issue 5, Article R74 Nilsson et al. />Genome Biology 2007, 8:R74
Stat Appl Genet Mol Biol 2004, 3:Article 3.
16. Cui X, Hwang JG, Qiu J, Blades N, Churchhill G: Improved statisti-
cal tests for differential gene expression by shrinking vari-
ance components estimates. Biostatistics 2005, 6:59-75.
17. Storey J, Tibshirani R: Statistical significance for genomewide
studies. Proc Natl Acad Sci USA 2003, 100:9440-9445.
18. Valk P, Verhaak R, Beijen M, Erpelinck C, van Waalwijk , van Doorn-
Khosrovani SB, Boer J, Beverloo H, Moorhouse M, van der Spek P,
Lowenberg B, Delwel R: Prognostically useful gene-expression
profiles in acute myeloid leukemia. N Engl J Med 2004,
350:1617-1628.
19. Radich J, Dai H, Mao M, Oehler V, Schelter J, Druker B, Sawyers C,
Shah N, Stock W, Willman C, Friend S, Lindsey P: Gene expression
changes associated with progression and response in chronic
myeloid leukemia. Proc Natl Acad Sci USA 2006, 103:2794-2799.
20. Gene Expression Omnibus repository [http://
www.ncbi.nlm.nih.gov/geo/]
21. Zheng C, Li L, Haak M, Brors B, Frank O, Giehl M, Fabarius A, Schatz
M, Weisser A, Lorentz C, Gretz N, Hehlmann R, Hochhaus A, Sei-
farth W: Gene expression profiling of CD34
+
cells identifies a
molecular signature of chronic myeloid leukemia blast crisis.
Leukemia 2006, 20:1028-1034.
22. ArrayExpress repository [ />23. Bhattacharjee A, Richards W, Staunton J, Li C, Monti S, Vasa P, Ladd
C, Beheshti J, Bueno R, Gillette M, et al.: Classification of human
lung carcinomas by mRNA expression profiling reveals dis-
tinct adenocarcinoma subclasses. Proc Natl Acad Sci USA 2001,
98:13790-13795.
24. Broad Institute: cancer genomics publications [http://
www.broad.mit.edu/mpr/lung]
25. Ross M, Zhou X, Song G, Shurtleff S, Girtman K, Williams W, Liu H,
Mahfouz R, Raimondi S, Lenny N, Patel A, Downing J: Classification
of pediatric acute lymphoblastic leukemia by gene expres-
sion profiling. Blood 2003, 102:2951-2959.
26. St Jude Research []
27. Andersson A, Olofsson T, Lindgren D, Nilsson B, Ritz C, Eden P, Las-
sen C, Rade J, Fontes M, Morse H, et al.: Molecular signatures in
childhood acute leukemia and their correlations to expres-
sion patterns in normal hematopoietic subpopulations. Proc
Natl Acad Sci USA 2005, 102:19069-19074.
28. West M, Blanchette C, Dressman H, Huang E, Ishida S, Spang R, Zuzan
H, Olson J, Marks J, Nevins J: Predicting the clinical status of
human breast cancer by using gene expression profiles. Proc
Natl Acad Sci USA 2001, 98:11462-11467.
29. Duke University IGSP - supplemental data [http://
data.cgt.duke.edu/west.php]
30. The Gene Ontology []
31. PANTHER - classification of genes and proteins [http://
www.pantherdb.org]
32. SourceForge.net: RenderCat [ />rendercat]
33. Bejamini Y, Hochberg Y: Controlling the false discovery rate: a
practical and powerful approach to multiple testing. J R Stat
Soc B 1995, 57:289-300.
34. Bejamini Y, Yekutieli D: The control of the false discovery rate
in multiple testing under dependency. Ann Stat 2001,
29:1165-1188.