Báo cáo y học: "Genome-wide identification of novel expression signatures reveal distinct patterns and prevalence of binding motifs for p53, nuclear factor-κB and other signal transcription factors in head and neck squamous cell carcinoma" docx
Bạn đang xem bản rút gọn của tài liệu. Xem và tải ngay bản đầy đủ của tài liệu tại đây (1.34 MB, 25 trang )
Genome Biology 2007, 8:R78
comment reviews reports deposited research refereed research interactions information
Open Access
2007Yanet al.Volume 8, Issue 5, Article R78
Research
Genome-wide identification of novel expression signatures reveal
distinct patterns and prevalence of binding motifs for p53, nuclear
factor-κB and other signal transcription factors in head and neck
squamous cell carcinoma
Bin Yan
*
, Xinping Yang
*
, Tin-Lap Lee
†
, Jay Friedman
*
, Jun Tang
‡
,
Carter Van Waes
*
and Zhong Chen
*
Addresses:
*
Head and Neck Surgery Branch, National Institute on Deafness and Other Communication Disorders, National Institutes of Health,
Center Drive, Bethesda, Maryland 20892, USA.
†
Laboratory of Clinical Genomics, National Institute of Child Health and Human Development,
National Institutes of Health, Convent Drive, Bethesda, MD 20892, USA.
‡
Department of Preventive Medicine, University of Tennessee, Health
Science Center, N Pauline St., Memphis, TN 38163, USA.
Correspondence: Zhong Chen. Email:
© 2007 Yan et al.; licensee BioMed Central Ltd.
This is an open access article distributed under the terms of the Creative Commons Attribution License ( which
permits unrestricted use, distribution, and reproduction in any medium, provided the original work is properly cited.
Transcriptional signatures in squamous cell carcinoma<p>Microarray profiling of ten head and neck cancer lines revealed novel p53 and NF-κB transcriptional gene expression signatures which distinguished tumor cell subsets in association with their p53 status.</p>
Abstract
Background: Differentially expressed gene profiles have previously been observed among
pathologically defined cancers by microarray technologies, including head and neck squamous cell
carcinomas (HNSCCs). However, the molecular expression signatures and transcriptional
regulatory controls that underlie the heterogeneity in HNSCCs are not well defined.
Results: Genome-wide cDNA microarray profiling of ten HNSCC cell lines revealed novel gene
expression signatures that distinguished cancer cell subsets associated with p53 status. Three major
clusters of over-expressed genes (A to C) were defined through hierarchical clustering, Gene
Ontology, and statistical modeling. The promoters of genes in these clusters exhibited different
patterns and prevalence of transcription factor binding sites for p53, nuclear factor-κB (NF-κB),
activator protein (AP)-1, signal transducer and activator of transcription (STAT)3 and early growth
response (EGR)1, as compared with the frequency in vertebrate promoters. Cluster A genes
involved in chromatin structure and function exhibited enrichment for p53 and decreased AP-1
binding sites, whereas clusters B and C, containing cytokine and antiapoptotic genes, exhibited a
significant increase in prevalence of NF-κB binding sites. An increase in STAT3 and EGR1 binding
sites was distributed among the over-expressed clusters. Novel regulatory modules containing p53
or NF-κB concomitant with other transcription factor binding motifs were identified, and
experimental data supported the predicted transcriptional regulation and binding activity.
Conclusion: The transcription factors p53, NF-κB, and AP-1 may be important determinants of
the heterogeneous pattern of gene expression, whereas STAT3 and EGR1 may broadly enhance
gene expression in HNSCCs. Defining these novel gene signatures and regulatory mechanisms will
be important for establishing new molecular classifications and subtyping, which in turn will
promote development of targeted therapeutics for HNSCC.
Published: 11 May 2007
Genome Biology 2007, 8:R78 (doi:10.1186/gb-2007-8-5-r78)
Received: 17 October 2006
Revised: 7 February 2007
Accepted: 11 May 2007
The electronic version of this article is the complete one and can be
found online at />R78.2 Genome Biology 2007, Volume 8, Issue 5, Article R78 Yan et al. />Genome Biology 2007, 8:R78
Background
Numerous basic and clinical studies suggest that develop-
ment and malignant progression of cancer is rarely due to a
defect in a single gene or pathway. Multiple genetic altera-
tions accumulate during carcinogenesis, potentially leading
to aberrant activation or suppression of multiple pathways
and downstream genes that have important functions in
determining the malignant phenotypes of cancer. Microarray
technology has enabled us to study global gene expression
profiles of cancers and identify gene programs or 'signatures'
that are critical to the heterogeneous characteristics and
malignant phenotypes of cancers, even of the same pathologic
type [1-3]. In head and neck squamous cell carcinomas
(HNSCCs), gene expression profiling has been used in
attempts to identify biomarkers for diagnosis [4], differential
sensitivity to chemotherapy [5], risk for recurrence [6], sur-
vival [7], malignant phenotype [8], and metastasis [9].
Although considerable variability in the composition of gene
signatures was observed in these studies, they provided evi-
dence for subsets within HNSCCs, which are possibly due to
differences in molecular pathogenesis that affect malignant
potential. However, the transcriptional regulatory mecha-
nisms that control the heterogeneous and shared patterns of
gene expression profiles observed, and their relationship to
malignant phenotypes, are not well defined.
The transcriptional regulation of gene expression is mainly
dependent on the composition of transcription factor binding
site (TFBSs), and complex interactions among transcription
factors and regulatory proteins that bind to gene promoters
[10]. In murine and human squamous cell carcinoma (SCC),
we and others have identified transcription factors that are
inactivated or mutated (for instance, the tumor suppressor
p53), or are constitutively activated (such as nuclear factor-
κB [NF-κB], activator protein [AP]-1, signal transducer and
activator of transcription [STAT]-3, and early growth
response [EGR]1). These transcription factors have been
independently implicated as tumor suppressor or oncogenic
transcription factors that regulate the expression of individ-
ual genes related to phenotypic characteristics that are
important in cancer development.
Among these transcription factors, p53 has been implicated
as a master regulator of genomic stability, cell cycle, apopto-
sis, and DNA repair [11,12]. Mutation or silencing of the p53
gene is an important molecular event in tumorigenesis, which
has been associated with nearly 50% incidence among all can-
cers [13-15], including HNSCC [16-20]. NF-κB is a nuclear
transcription factor that is activated in HNSCCs and other
cancers. We and others have shown that constitutive activa-
tion of NF-κB1/RelA is among the important factors that con-
trol expression of genes that regulate cellular proliferation,
apoptosis, angiogenesis, immune and proinflammatory
responses, and therapeutic resistance in HNSCCs [21-26] and
other cancers [27-29]. AP-1, STAT3, and EGR1 are considered
important transcription factors that are involved in regulat-
ing gene expression in human cancers, including HNSCCs.
Constitutive activation of AP-1 and STAT3 appear to be
important factors for tumor cell proliferation, survival, and
angiogenesis in vitro or in vivo [21,24,29-34]. EGR1 is a zinc-
finger transcription factor that is rapidly and transiently
induced in response to a number of stimuli, including growth
factors, cytokines, and mechanical stresses [35,36].
The study of regulatory controls involving multiple transcrip-
tion factors for clustered gene expression obtained from
microarray data meets with many experimental challenges.
In a previous study of step-wise progression of murine SCCs,
we combined gene expression profiling data with a bioinfor-
matic analysis of promoter TFBSs and ontology limited to
NF-κB regulated genes, and provided evidence that this tran-
scription factor is one of the critical regulatory determinants
of expression of multiple genes and malignant phenotype
[37,38]. However, this approach involving analysis of a single
pathway and this TFBS appears far from providing a complete
explanation for the heterogeneity and multiplicity of genes
expressed in clusters in HNSCCs and other cancers, or asso-
ciated differences in phenotypic and biologic behavior
observed. Identification of common TFBSs in gene clusters
through in silico analysis can provide a framework for further
elucidating the network and complex interactions of regula-
tory mechanisms that are involved in gene expression in can-
cer [39,40].
In the present study, microarray combined with computa-
tional prediction was utilized to define gene expression pat-
terns and putative TFBSs for genes that are differentially
expressed among ten HNSCC cell lines and nonmalignant
keratinocytes. The differentially expressed microarray pro-
files classified subsets of HNSCC cells related to differences in
p53 genotype, protein expression, and unique gene signa-
tures. The potential relationship of novel gene expression sig-
natures and prevalence of TFBSs for p53, NF-κB, AP-1,
STAT3, and EGR1 were identified, and novel transcription
regulatory modules for specific gene clusters were predicted.
The predicted results were then validated by real-time reverse
transcription (RT)-polymerase chain reaction (PCR) and
chromatin immunoprecipitation (ChIP) assay. Our study sug-
gests that integration of genome-wide microarray profiling
and computational analyses is a powerful way to identify gene
signatures as determinants for cancer heterogenicity and
malignant phenotypes, and their underlying regulatory con-
trol mechanisms.
Results
Identification of novel gene clusters in University of
Michigan SCC cells with different p53 status by cDNA
microarray expression profiling
cDNA microarray analysis was performed using a panel of ten
HNSCC cell line series from the University of Michigan (UM-
SCC), derived from eight patients with aggressive HNSCC
Genome Biology 2007, Volume 8, Issue 5, Article R78 Yan et al. R78.3
comment reviews reports refereed researchdeposited research interactions information
Genome Biology 2007, 8:R78
(survival <2 years), and representing a distribution of differ-
ent anatomic sites (Table 1). Many of the molecular altera-
tions and biologic characteristics of these UM-SCC cell lines
have been confirmed to reflect those identified in HNSCC
tumors from patients in laboratory and clinical studies. These
include the roles of activation of epidermal growth factor
receptor, IL-1, and IL-6 signal transduction pathways; altered
activation of transcription factors p53, NF-κB, AP-1, and
STAT3; expression of cytokines and other genes; and varia-
tion in radiation and chemosensitivity [5,21-26,30-33,41-43].
The p53 mutation and expression status of UM-SCC cells
lines were evaluated using bidirectional genomic sequencing
of exons 4 to 9 (Figure 1a), and confirmed with immunocyto-
chemistry using monoclonal antibody to p53 (DO-1 clone)
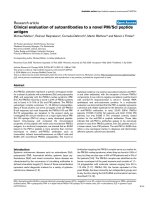
(Figure 1b). No mutation was detected in those exons in four
cell lines, namely UM-SCC 1, 6, 9, and 11A. Mutation of p53
was detected in five cell lines, namely UM-SCC 5, 22A, 22B,
38, and 46 (Figure 1a). A mutation was also detected in UM-
SCC 11B cells, but immunocytochemistry of p53 protein sug-
gested there might be a mixed population of UM-SCC 11B
cells with a heterogeneous expression pattern for nuclear p53
protein (Figure 1b). The findings regarding p53 mutation in
UM-SCC 1, 5, 6, 11B, and 46 cells are consistent with a previ-
ous report by Bradford and coworkers [41].
Gene expression profiles were determined using a 24,000 ele-
ment cDNA microarray by comparing 10 UM-SCC cell lines
with four cultured primary human keratinocyte (HKC) lines
as normal controls. The expression of 9,273 of 12,270 evalua-
ble known genes was submitted for principal components
analysis and hierarchical clustering [44]. Both methods
grouped UM-SCC 11B together with its parental cell line UM-
SCC 11A, as well as the other UM-SCC cells with wild-type
p53, and these findings were statistically significant (P <
0.001, class prediction analysis; BRB-Array Tools [45]).
Based on mixed p53 protein staining and wild-type p53 asso-
ciated gene expression pattern, we classified UM-SCC 11B
cells with the wild-type p53 group as having a 'wild-type p53-
like' expression pattern.
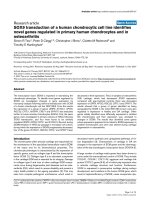
Next, we studied a total of 1,011 genes that exhibited twofold
or greater differences in gene expression when comparing
HKCs with all UM-SCC, or comparing UM-SCC cells with
either wild-type p53-like (UM-SCC cell lines 1, 6, 9, 11A, and
11B) or mutant p53 expression patterns (UM-SCC cell lines 5,
22A, 22B, 38, and 46; Figure 2a). The 1,011 genes, including
371 over-expressed and 640 under-expressed genes, were
subjected to hierarchical clustering, as shown in Figure 2a.
The expression profile of 1,011 genes clustered all samples
into three groups, namely HKCs, UM-SCC wild-type p53-like,
and UM-SCC with mutant p53 (Figure 2a). Six major clusters
(A to F) of differentially expressed genes were identified, with
most over-expressed genes included in two distinct clusters,
A and B, and three subclusters within cluster C (subclusters
C1, C2, and C3) on the top portion of the expression tree (Fig-
ure 2a).
The unique gene signatures of clusters A and B consisted of 34
and 37 genes (Figure 2b,c and Table 2), respectively. We used
the mixed model based F-test to examine the statistical differ-
ence of gene expression within clusters among HKCs and
UM-SCC cell lines with different expression patterns. Within
both cluster A and cluster B genes, a significant difference in
gene expression (probability, Pr [F] < 0.001) was observed
when comparing the two groups of UM-SCC cells. A signifi-
cant difference was also observed when comparing HKCs
Table 1
Tumor, treatment, and outcome characteristics of patients providing human SCC cell lines
Cell line Age
(years at diagnosis)
Sex Stage TNM Primary site Specimen site Prior therapy Status Survival
(months)
UM-SCC 1 72 M I T1N0M0 FOM Local recur R DWOD 15
UM-SCC 5 59 M III T2N1M0 Supraglottic larynx Pri bx S DOD 8
UM-SCC 6 37 M II T2N0M0 Tongue Pri bx N LTF
UM-SCC 9 72 F II T2N0M0 Tonsil/BOT Local recur R DOD 15
UM-SCC 11A 65 M V T2N2aM0 Hypopharynx Pri bx N DOD 14
UM-SCC 11B Pri resect C
UM-SCC 22A 59 F III T2N1M0 Hypopharynx Pri bx N DOD 10
UM-SCC 22B LN met N
UM-SCC 38 60 M IV T2N2aM0 Tonsil/BOT Pri N DOD 11
UM-SCC 46 57 F III No TMN Given Suprglottic larynx Local recur R, S DOD 6
The clinical information was kindly provided by Drs Thomas E Carey and Carol R Bradford, and some information was previously presented in the
literature. 'Primary sites' refers to the origin of the primary tumor. 'Specimen site' refers to origin of tissue used to establish cultures. 'Prior therapy'
refers to therapy given before the specimen used for culture was obtained. 'Survival' represents time in months from diagnosis to last follow up.
BOT, base of tongue; bx, biopsy; C, chemotherapy; DOD, died with disease; DWOD, died without disease; F, female; FOM, floor of mouth; LN,
lymph nodes; LTF, lost to follow-up; M, male; met, metastasis; N, none; NED, no evidence of disease; Pri, primary tumor site; R, radiation; recur,
recurrence; resect, surgical resection specimen; SCC, squamous cell carcinoma; S, surgery; TNM, tumor-node-metastasis (staging system); UM-SCC,
University of Michigan series head and neck squamous cell carcinoma.
R78.4 Genome Biology 2007, Volume 8, Issue 5, Article R78 Yan et al. />Genome Biology 2007, 8:R78
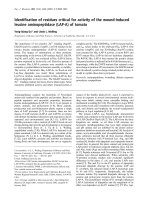
p53 genotype and protein expression in UM-SCC cell linesFigure 1
p53 genotype and protein expression in UM-SCC cell lines. (a) The p53 genotype of ten University of Michigan series head and neck squamous cell
carcinoma (UM-SCC) cell lines was analyzed by two-directional sequencing of four to nine exons. (b) Immunohistochemistry for p53 was performed on
the UM-SCC cell lines using anti-p53 monoclonal antibody (DO-1, clone), and the panels were segregated according to minimal or weaker staining pattern
typical for wild-type p53 (upper panels, except UM-SCC 11B) and strong nuclear staining typical for mutant p53 status of cells (lower panels). The cells
stained with the isotype control primary antibody as negative control are presented in the small pictures located at the lower right corner of each image.
The pictures were taken at a magnification of 100×.
(a)
Cell line p53 mutation Type
UM-SCC 1 wt
UM-SCC5 Exon 5, 157 GTC > TTC Missense mutation by transversion
(Valine > Phenylalanine)
UM-SCC6 wt
UM-SCC9 wt
UM-SCC11A wt
UM-SCC11B Exon 7, 242 TGC > TCC Missense mutation by transversion
(Cysteine > Serine)
UM-SCC22A Exon 6, 220 TAT > TGT Missense mutation by transition
(Tyrosine > Cysteine)
UM-SCC22B Exon 6, 220 TAT > TGT Missense mutation by transition
(Tyrosine > Cysteine)
UM-SCC38 Exon 5, 132 AAG > AAT Missense mutation by transversion
(Lysine > Asparagine)
UM-SCC46 Exon 8, 278 CCT > GCT Missense mutation by transversion
(Proline > Alanine)
(b)
1
1
9 11A 11B6
5
UM-SCC cells
463822B22A
Genome Biology 2007, Volume 8, Issue 5, Article R78 Yan et al. R78.5
comment reviews reports refereed researchdeposited research interactions information
Genome Biology 2007, 8:R78
with UM-SCC cells with mutant p53 in cluster A, and compar-
ing UM-SCC with the wild-type p53-like expression pattern in
cluster B. Thus, cluster A genes were over-expressed in UM-
SCC cells with mutant p53 (Figure 2b), whereas cluster B
genes were over-expressed in UM-SCC cells with wild-type
p53-like expression pattern (Figure 2c).
In addition to genes of clusters A and B, we defined another
group of over-expressed genes, namely cluster C, including
three subclusters C1, C2, and C3 (Figure 2a and Additional
data file 1). Overall, cluster C contained 240 genes that were
over-expressed by 10 cancer cell lines when compared with
HKCs (Pr [F] < 0.001). However, two of the subclusters (C1
and C2) identified exhibited a degree of differential expres-
sion in UM-SCC cells similar to the various p53-associated
expression patterns (Additional data file 1).
Gene Ontology annotation revealed the unique nature
of clustered genes
To determine the functional classification of the various gene
clusters, we conducted Gene Ontology (GO) annotation using
Onto-Express, which constructs statistically significant func-
tional profiles from a set of genes [46]. Additional data file 2
shows functional categories that are significantly enriched in
the six clusters. The top categories of GO biologic processes in
cluster A were nucleosome assembly, chromosome organiza-
tion, and biogenesis. These included genes involved in regu-
lation of chromosome structure or function (such as H2B
histone family B, C, D, R, L and Q, and H2A histone family L
and N), transport (such as MYST3, ABCC5, ATP1B3, and
HBE1), and DNA repair (such as XPA). The main GO molec-
ular function was DNA binding, including eight genes in his-
tones H2A and H2B, and MYST3, THAP11 and ARID1A
(Table 2 and Additional data file 2).
In contrast to cluster A, the top ranked GO biologic processes
in cluster B belonged to signal transduction (such as cell-cell
signaling, cell surface receptor linked signal transduction),
including AKAP12, CAP2, IL6, IL8, RAB17, SHANK2, STC1,
PTPRJ, TXNRD1, and YAP1 (Table 2 and Additional data file
2). Other enriched functional categories included cell cycle
(AIF1, BCAT1, RAD54L, and STK6), regulation of transcrip-
tion (ARID3A, DMAP1, and ZNF239), cell proliferation and
apoptosis (CROC4, BIRC2, PLK1, and PORMIN), adhesion
(ICAM1), and structural proteins related to tumor progres-
sion (KRT8 and KRT18; Table 2 and Additional data file 2).
Interestingly, several genes in this cluster or their homologs
involved in angiogenesis and inhibition of apoptosis have pre-
viously been associated with metastatic tumor progression in
murine SCC or human HNSCC (IL6, IL8, YAP1, and BIRC2)
[9,22-24,30,33,37,38,47-49], and shown to be regulated by
NF-κ
B [22-25,37,49].
Genes in cluster C exhibited annotations for DNA replication,
ubiquitin cycle, cell division, and oxidoreductase and catalytic
activities. The gene list and ontology of the subclusters in C
are presented in the Additional data files 1 and 2, respectively.
Several genes in subclusters C1 and C2 exhibited weaker clus-
tering but similar functions as those in cluster A or B. In sub-
cluster C1, in which over-expressed genes were mainly found
in UM-SCC cells with mutant p53 as in cluster A, there are
two additional genes identified that encode proteins involved
in chromosome structure and functions (HIST1H2AL and
HDAC5). Other genes previously associated with cancer
included a member of epidermal growth factor receptor fam-
ily (ERBB3); a target gene of p53/p63 (IGFBP3); and a gene
whose product is involved in calcium storage and signaling
(CALR). In subcluster C2, in which over-expressed genes
were found in UM-SCC cells with wild-type p53-like expres-
sion pattern as in cluster B, another apoptosis related gene
(BAG2), genes encoding signal-related molecules (MYBL2
and UBE2C) and a cell cycle related molecule (CCNB2) were
identified (Additional data file 1). The rest of the cluster C
genes were over-expressed by more than half of ten UM-SCC
cells when compared with HKCs. Several genes encoding
protein products that are important in cancer and have func-
tions related to cell cycle, growth, DNA replication and pro-
tein translation (such as CCND1, TOP2A, TOPBP1, TFRC;
three members of H4 histone family [HIST1H4C, HIST1H4B,
and HIST1H4E]; and EIF4G1). Some genes encode proteins
with functions related to signal transduction (PIK3R3,
MAPK8IP1, and GATA2), and one gene encodes a protein that
regulates tumor invasion and metastasis (TIMP2).
Genes downregulated in UM-SCC cells were included in clus-
ter D, which represents functional categories that are
involved in epidermis development, cell adhesion, and cell-
cell signaling (Additional data file 2). Downregulated cluster
E genes included those encoding molecules with functions in
other signal pathways, cell cycle, calcium ion regulation, and
actin binding activities (Additional data file 2). The categories
over-represented among the downregulated genes in cluster
F included cell adhesion, differentiation, and morphogenesis
(Additional data file 2). A more detailed analysis of the down-
regulated genes will be presented elsewhere (Yan, unpub-
lished data).
Over-representation of binding sites of five
transcription factors associated with the unique gene
clusters in UM-SCC cells
Based on the gene expression profiling data, we hypothesized
that transcriptional regulation by multiple transcription fac-
tors may be key elements that contribute to the expression of
unique gene clusters. To test this hypothesis, in silico compu-
tational analyses were performed to determine whether dom-
inant cis-regulatory elements are present in the proximal
promoter region of over-expressed genes. We evaluated five
transcription factors that were previously found to be altered
and functionally important in HNSCCs and other cancers,
including p53, NF-κB, AP-1, STAT3, and EGR1. We compared
the frequencies of their binding sites with those from verte-
brate promoters from the Genomatix promoter database
R78.6 Genome Biology 2007, Volume 8, Issue 5, Article R78 Yan et al. />Genome Biology 2007, 8:R78
Figure 2 (see legend on next page)
(a) (b)
(c)
wt p53-like
mt p53
Clusters
-2 0 2
Genome Biology 2007, Volume 8, Issue 5, Article R78 Yan et al. R78.7
comment reviews reports refereed researchdeposited research interactions information
Genome Biology 2007, 8:R78
(GPD), which consists of information from human, mouse,
and rat. The five transcription factors examined have been
shown by our laboratory and others to contribute to regula-
tion of individual gene expression with functional importance
in cancer, such as cell proliferation, cell cycle, apoptosis, DNA
repair, and angiogenesis [21,22,24,36-38,50-53].
Table 2 shows a list of genes included in clusters A and B and
corresponding binding sites for the five transcription factors
in proximal promoter regions that are predicted with high
probability. The detailed location and sequences of the puta-
tive TFBSs are shown in Additional data file 3. Significant dif-
ferences in the prevalence of predicted TFBSs were observed
for genes from different clusters when compared with verte-
brate promoters (Figure 3). In cluster A, putative p53 binding
sites were detected in 50% of the 34 gene promoters, which is
significantly higher than observed in vertebrate promoters (P
< 0.05; Figure 3). Conversely, predicted NF-κB binding sites
were observed in about 66% to 70% of the promoters in clus-
ters B and C, which was significantly more than in vertebrate
promoters. There was no significant difference in the preva-
lence of NF-κB binding sites between the promoters of cluster
A and vertebrates. There were also differences in the preva-
lence of TFBSs predicted between different clusters. For
example, the p53 binding motif was significantly greater in
cluster A than cluster B (χ
2
analysis; P < 0.05), and the great-
est frequency of NF-κB binding sites was observed in cluster
B (26/37 [70%]; Figure 3). There were significantly fewer
genes with AP-1 binding sites in cluster A and subcluster C1
(12% and 13%, respectively) compared with vertebrate
promoters (Figure 3). A relatively higher frequency of AP-1
binding sites was observed in cluster B genes when compared
with frequencies in cluster A and subcluster C1 genes (χ
2
anal-
ysis; P < 0.01). In contrast, a relative increase in prevalence of
STAT3 and EGR1 binding sites was observed and distributed
among all of the upregulated clusters relative to vertebrate
promoters (Figure 3), with increasingly higher frequencies of
EGR1 motifs detected in clusters B and C (60% to 76%; using
Genomatix matrix EGR1.02).
The orthologous promoters and conserved
transcription factor binding sites predict increased
likelihood of functional co-regulation of clustered
genes
The likelihood of functionality of a predicted TFBS can be
examined by determining its conservation at the sequence
level. To determine the potential conservation of the pre-
dicted TFBSs, the orthologous promoter regions of genes in
clusters A and B were examined by searching their conserva-
tion at the sequence level among vertebrates (human, mouse,
and rat) using the comparative genomics analysis feature of
Genomatix Suite 3.4.1. Orthologous promoter sets were
found in 19 and 24 genes of clusters A and B, respectively
(Table 2; Ortholog). Among 17 genes containing predicted
p53 binding sites in cluster A, 10 out of 17 (59%) were identi-
fied in the orthologous promoter regions. In this cluster, the
predicted prevalence of binding sites falling in the ortholo-
gous promoter regions were 63% for NF-κB, 60% for AP-1,
100% for STAT3, and 76% for EGR1. Similarly, in cluster B,
the prevalence of binding sites falling in orthologous promot-
ers were 65% for NF-κB, 67% for p53 and AP-1, 73% for
STAT3, and 64% for EGR1. These levels of conservation indi-
cated that the majority of predicted TFBSs falling in the
orthologous promoter regions were likely selected favorable
for growth or survival during evolution. Interestingly,
although expression of histone H2A and H2B gene members
were predominant in cluster A, only a rat orthologous pro-
moter was found in HIST1H2BD among the eight histone
genes (Table 2).
The conserved TFBSs among the orthologous promoter sets
were further investigated by multiple sequence alignment
using DiAlignTF [54]. Conserved p53 binding sites were
found in three genes of cluster A (ARID1A, CPS1, and
UBADC1) and two genes of cluster B (IL6 and ARID3A; Table
2). The conservation of NF-κB binding sites was observed in
more genes, including LGALS3BP, MYST3 and TDRD7 in
cluster A, and ACSL5, CA9, DMAP1, ICAM1, IL6, KCNN4,
and TOMM34 in cluster B. Additionally, the binding sites of
AP-1, STAT3, and EGR1 were conserved in 6, 4, and 14 gene
promoters, respectively (Table 2). Next, we identified five
representative gene promoters from either cluster A or B
genes, which contained conserved p53 or NF-κB binding
motifs among human, chimpanzee, mouse, and rat (Figure 4).
The core sequence (underlined) of a transcription factor
matrix represents the most highly conserved and consecutive
positions of this matrix. In promoters of both CPS1 and
ARID1A from cluster A genes, the predicted p53 binding sites
were similar to Genomatix and TRANSFAC p53 matrix
consensus sequence GGACATGCCGGGCATGTCY (Figure
4a). The p53 binding site of ARID1A promoter was located 55
to 74 base pairs (bp) downstream from the transcriptional
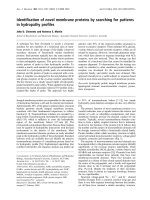
Hierarchical clustering analysis of differentially expressed genes in UM-SCC cellsFigure 2 (see previous page)
Hierarchical clustering analysis of differentially expressed genes in UM-SCC cells. A total of 1,011 differentially expressed genes was extracted from 24,000
cDNA microarray database, based on twofold and greater difference among human normal kerintinocytes (HKCs), UM-SCC cells with wild-type p53-like
expression pattern, mutant p53 or wild-type + mutant p53 status (t-test score at P < 0.05, two-tailed). The hierarchical clustering tree was generated using
Java Treeview [107]. Four HKCs were grouped on the left, and five UM-SCC cell lines with wild-type p53-like expression pattern were grouped together
in the middle, and five UM-SCC cell lines with mutant p53 were grouped to the right, respectively. Over-expressed genes are indicated by red and under-
expressed genes by green; and the expression level is proportional to the brightness of the color (see color bar). (a) Entire hierarchical clustering tree
included three upregulated clusters (A, B and C [including subclusters C1 to C3]) and three downregulated clusters (D, E and F). (b) Cluster A consisted
of 34 genes. (c) Cluster B consisted of 37 genes. mt, mutant; wt, wild-type.
R78.8 Genome Biology 2007, Volume 8, Issue 5, Article R78 Yan et al. />Genome Biology 2007, 8:R78
Table 2
Putative transcription factor binding sites of clusters A and B over-expressed in HNSCC
Gene name Gene description RefSeq Orthlog
a
Number of TFBSs predicted
b
Functional
annotation
c
p53 NF-κB AP-1 STAT3 EGR1
Cluster A
ABCC5 ATP-binding cassette, subfamily
C (CFTR/MRP), member 5
NM_005688 hmr
a
1 (hmr) Transport
ARID1A AT rich interactive domain 1a
(SWI-like)
NM_006015 hmr 1 (hmr) 5 (hmr) Regulation of
metabolism
ARTS-1 Type 1 TNF receptor shedding
aminopeptidase regulator
NM_016442 hmr 1 1 1 1 Catabolism
ATP1B3 ATPase, Na
+
/K
+
transporting,
beta 3 polypeptide
NM_001679 hmr 3 7 Transport
BLK B lymphoid tyrosine kinase NM_001715 hmr 1 Signal transduction
CDC42EP4 cdc42 effector protein 4; binder
of Rho GTPases 4
NM_012121 h 1 2 2 Regulation of cell
shape
CDH18 Cadherin 18, type 2 NM_004934 h Cell adhesion
CDKN2C Cyclin-dependent kinase
inhibitor 2C (p18)
NM_078626 hmr 3 1 Cell proliferation;
cell cycle
CKB Creatine kinase, brain NM_001823 hmr 3 8 Creatine kinase
activity
CPS1 Carbamoyl-phosphate
synthetase 1, mitochondrial
NM_001875 hmr 2 (hmr) 1 1 (hmr) Amino acid
metabolism
FZD1 Frizzled homolog 1 (Drosophila) NM_003505 h 1 4 Signal transduction
HARSL Histidyl-tRNA synthetase-like NM_012208 hm 2 1 1 Amino acid
metabolism
HBE1 Hemoglobin, epsilon 1 NM_005330 hr 1 1 Transport
HIST1H2AC H2A histone family, member L NM_003512 h 1 Chromosome
organization and
biogenesis
HIST1H2AM H2A histone family, member N NM_003514 h 3 Chromosome
organization and
biogenesis
HIST1H2BC H2B histone family, member L NM_003526 h 1 Chromosome
organization and
biogenesis
HIST1H2BD H2B histone family, member B NM_138720 hr 1 1 Chromosome
organization and
biogenesis
HIST1H2BJ H2B histone family, member R NM_021058 h 1 1 Chromosome
organization and
biogenesis
HIST1H2BL H2B histone family, member C NM_003519 h 1 Chromosome
organization and
biogenesis
HIST1H2BN H2B histone family, member D NM_003520 h 2 2 Chromosome
organization and
biogenesis
HIST2H2BE H2B histone family, member Q NM_003528 h 3 1 1 1 Chromosome
organization and
biogenesis
IGFBP2 Insulin-like growth factor binding
protein 2 (36 kDa)
NM_000597 hmr 1 (hr) 4 (hmr) Regulation of cell
growth
LGALS3BP Lectin, galactoside-binding,
soluble, 3 binding protein
NM_005567 hmr 1 2 (hmr) Cell adhesion
MATN2 Matrilin 2 NM_002380 h 1 Extracellular matrix
assembly
Genome Biology 2007, Volume 8, Issue 5, Article R78 Yan et al. R78.9
comment reviews reports refereed researchdeposited research interactions information
Genome Biology 2007, 8:R78
MYST3 MYST histone acetyltransferase
(monocytic leukemia) 3
NM_006766 hmr 5 (hmr) 6 (hmr) DNA packaging
OLFM1 Olfactomedin 1 NM_014279 hmr 1 1 2 4 (hmr) Morphogenesis
PRODH Proline oxidase homolog NM_016335 h Amino acid
metabolism
SLC9A3R1 Solute carrier family 9, isoform 3
regulatory factor 1
NM_004252 hmr 1 3 (hr) Signal transduction
TDRD7 Tudor domain containing 7 NM_014290 hmr 1 1 (hmr) 5 (hmr) Protein amino-
terminus binding
TGM1 Transglutaminase 1 NM_000359 hmr 2 1 1 Morphogenesis; cell
proliferation
THAP11 THAP domain containing 11 NM_020457 h 3 DNA binding, ion
binding
UBADC1 Ubiquitin associated domain
containing 1
NM_016172 hmr 2 (hmr) 7 (hmr) Protein
ubiquitination
XCL1 Chemokine (C motif) ligand 2 NM_002995 h 2 Signal transduction
XPA Xeroderma pigmentosum,
complementation group A
NM_000380 hmr 2 1 2 (hmr) DNA repair
Cluster B
ABCG2 ATP-binding cassette, subfamily
G (WHITE), member 2
NM_004827 h 3 1 2 Transport
ACSL5 Fatty-acid-coenzyme a ligase,
long-chain 5
NM_016234 hmr 1 (hmr) 1 Fatty acid
metabolism
AIF1 Allograft inflammatory factor 1 NM_001623 hmr Inflammatory
response; cell cycle
AKAP12 A kinase (PRKA) anchor protein
(gravin) 12
NM_005100 hmr 1 2 2 Signal transduction
ARID3A AT rich interactive domain 3A
(BRIGHT-like)
NM_005224 hmr 2 (hmr) 1 3 Regulation of
transcription
BCAT1 Branched chain
aminotransferase 1, cytosolic
NM_005504 h 1 1 2 Cell cycle; amino
acid metabolism
BIRC2 Baculoviral IAP repeat-
containing 2
NM_001166 h 2 2 1 2 Antiapoptosis; signal
transduction
CA9 Carbonic anhydrase IX NM_001216 hmr 1 (hmr) 1 (hmr) One-carbon
compound
metabolism
CAP2 Adenylyl cyclase-associated
protein 2
NM_006366 hm 1 Signal transduction
CROC4 Transcriptional activator of the
c-fos promoter
NM_006365 h 1 Cell proliferation
DMAP1 DNA methyltransferase 1-
associated protein 1
NM_019100 hmr 3 (hr) 1 Regulation of
transcription
DNAH11 Dynein, axonemal, heavy
polypeptide 11
NM_003777 h 4 Transport
FADS3 Fatty acid desaturase 3 NM_021727 hmr 3 5 (hr) Fatty acid
metabolism
ICAM1 Intercellular adhesion molecule
1 (CD54)
NM_000201 hmr 2 (hmr) 1 1 (hmr) 3 Cell adhesion
IL6 Interleukin 6 (interferon, beta 2) NM_000600 hmr 1 (hm) 1 (hmr) 1 (hmr) 1 Signal transduction;
inflammatory
response
IL8 Interleukin 8 NM_000584 h 1 1 1 Signal transduction;
inflammatory
response
KCNN4 Intermediate conductance Ca-
activated K channel protein 1
NM_002250 hmr 1 3 (hmr) 1 (hmr) Transport
Table 2 (Continued)
Putative transcription factor binding sites of clusters A and B over-expressed in HNSCC
R78.10 Genome Biology 2007, Volume 8, Issue 5, Article R78 Yan et al. />Genome Biology 2007, 8:R78
start site and overlapped with a EGR1 binding site. Known
NF-κB sites in IL6 and ICAM1 promoters are conserved with
about 90% matrix similarity to the five matrices for the NF-
κB family, including p65 and cRel (Figure 4b and Additional
data file 3). Another conserved NF-κB site in the promoter of
gene CA9 exhibited 85% to about 90% similarity to two NF-
κB matrices of the family including p50, indicating that these
sites are more likely to be functional in a biologic context.
Novel transcription factor regulatory modules
associated with p53 or nuclear factor-κB in promoters
of clustered genes
Because we observed that several transcription factors are
often co-activated in HNSCCs, we hypothesized that the clus-
tered gene expression could be co-regulated by multiple tran-
scription factors [55]. These transcription factors are
expected to be structured and coordinated tightly together,
form a functional unit or so-called transcription factors
module, and play roles in regulating gene expression. To
obtain evidence for this hypothesis, we used FrameWorker of
Genomatix Suite 3.4.1 to define promoter models. Based on
the promoter modeling, we identified the putative regulatory
modules of TFBSs in the clustered genes that were over-
expressed by UM-SCC cells. Two co-regulated gene groups
were selected for this analysis, which included 17 genes with
p53 binding sites in cluster A and 26 genes with NF-κB bind-
ing sites in cluster B. In cluster A genes with p53 binding sites,
putative models containing three and four transcription fac-
KRT18 Keratin 18 NM_199187 h 1 1 Structural molecule
activity
KRT8 Keratin 8 NM_002273 hr 2 2 1 (hr) 2 Structural molecule
activity
MLPH Melanophilin NM_024101 h 1 2 Transport
Pfs2 DNA replication complex GINS
protein PSF2
NM_016095 h 1 5 DNA metabolism
PLK1 Polo-like kinase (Drosophila) NM_005030 hmr 1 1 1 (hm) Metabolism; cell
proliferation
PORIMIN Pro-oncosis receptor inducing
membrane injury gene
NM_052932 h 1 5 Oncosis-like cell
death
PPP1R12A Protein phosphatase 1,
regulatory (inhibitor) subunit
12A
NM_002480 hmr 1 5 (hmr) Regulation of
organismal
physiological
process
PTPRJ Protein tyrosine phosphatase,
receptor type, J
NM_002843 h 1 8 Signal transduction
RAB17 RAB17, member RaS oncogene
family
NM_022449 h 1 2 Signal transduction
RAD54L RAD54-like (S. cerevisiae) NM_003579 hmr 1 7 DNA repair; cell
cycle
RPN2 Ribophorin II NM_002951 hmr 1 1 1 1 Protein metabolism
SHANK2 Cortactin binding protein 1 NM_012309 hmr 2 2 4 Signal transduction
SNCG Synuclein, gamma (breast
cancer-specific protein 1)
NM_003087 hmr 1 Pathogenesis
SRPX2 Sushi-repeat protein NM_014467 hmr 2 (hmr) Electron transport
STC1 Stanniocalcin 1 NM_003155 hmr 1 3 (hmr) Signal transduction
STK6 Serine/threonine kinase 15 NM_198433 hmr 1 Cell cycle
TOMM34 Translocase of outer
mitochondrial membrane 34
NM_006809 hmr 3 (hmr) 2 (hmr) Protein metabolism
TXNRD1 Thioredoxin reductase 1 NM_003330 hmr 1 2 1 (hmr) Signal transduction
YAP1 Yes-associated protein 1, 65 kD NM_006106 hmr 1 11(hmr) Signal transduction
ZNF239 Zinc finger protein 239 NM_005674 h 1 Regulation of
transcription
Shown are numbers of transcription factor binding sites (TFBSs) from p53, nuclear factor-κB (NF-κB), activator protein (AP)-1, signal transducer and
activator protein (STAT)3, and early growth response (EGR)1 in clusters A and B over-expressed in head and neck squamous cell carcinoma
(HNSCC). TFBSs were predicted using Genomatix Suite 3.4.1 [108].
a
Orthologous promoter sets are indicated by single-letter abbreviations (h,
human; m, mouse; r, rat).
b
Values are presented as number of TFBSs in proximal region of promoters. The average length of these promoters was
adjusted to approximately 600 base pairs (bp): about 500 bp upstream and about 100 bp downstream. Letters in the parentheses refer to conserved
TFBSs identified among human, mouse, or rat using multiple sequence alignment of DiAlign TF of Genomatix Suite 3.4.1.
c
From Gene Ontology
Annotation using Onto-Express [46], AmiGo [106], and National Center for Biotechnology Information [107]. TNF, tumor necrosis factor.
Table 2 (Continued)
Putative transcription factor binding sites of clusters A and B over-expressed in HNSCC
Genome Biology 2007, Volume 8, Issue 5, Article R78 Yan et al. R78.11
comment reviews reports refereed researchdeposited research interactions information
Genome Biology 2007, 8:R78
tors were present with scores of high selectivity (Table 3),
indicating that such models are enriched to a greater extent in
cluster A genes than in genes randomly selected from the
whole human genome. All eight transcription factor models
contained p53-TBPF (TATA-binding protein factors) associ-
ated with either CREB (cAMP-responsive element binding
proteins; 4/8) or PCAT (promoter of CCAAT-binding factors;
2/8), suggesting the possible functional relationships or co-
regulatory mechanisms mediated by these transcription fac-
tors. These transcription factor modules were over-repre-
sented in the proximal promoter regions of several genes,
including CPS1 in all eight models, and HIST1H2AM,
HIST1H2BE, and HIST1H2BL in six to seven models. In addi-
tion to genes with p53 binding motifs, we also identified a
putative module of TBPF-ECAT (enhancer of CCAAT binding
factors)-PCAT that was present on 100% promoter regions
within eight histone H2A or H2B genes (Figure 5), which is in
contrast to the low frequency (0.47%) observed in the entire
human promoter database. The putative p53 binding sites
found in the promoters of four histone genes, namely
HIST1H2AM, HIST1H2BE, HIST1H2BL, and HIST1H2BN,
were located within 100 bp of the TBPF-ECAT-PCAT module
(Figure 5), which is consistent with a greater likelihood of reg-
ulatory interactions.
By contrast, the predicted transcription factor models exhib-
ited greater diversity when connecting NF-κB with other
transcription factors. The major transcription factors associ-
ated with NF-κB were ETSF (human and murine ETS1 fac-
tors; 8/14) and ZBPF (zinc binding protein factors; 8/14). In
most cases the locations of NF-κB binding sites were near to
either ETSF or ZBPF, except in two cases, where NF-κB sites
were separated from ETSF or ZBPF by PAX5 or EGRF (early
growth response family). We noticed that the selectivity of
these models containing five TFBSs was much greater than
that of other ones. It is therefore possible that cooperation of
ETSF-NF-κB or ZBPF-NF-κB with other transcription factors
is part of NF-κB transcriptional regulatory mechanisms.
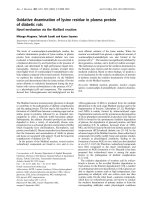
Frequency of putative TFBSs in proximal regions of promotersFigure 3
Frequency of putative TFBSs in proximal regions of promoters. The promoter sequences were extracted from the over-expressed genes in clusters A and
B, and subclusters C1 to C3 in UM-SCC cells using Genomatix Suite 3.4.1. The average length of these promoters was adjusted to approximately 600,
including about 500 base pairs upstream and about 100 base pairs downstream from the transcription start site. The promoter sequences from
vertebrates represented 159,505 promoters, including 55,207 from human, 69,108 from mouse, and 35,190 from rat in Genomatix promoter database.
The P value of transcription factor binding site (TFBS) frequency in a given cluster was calculated by MatInspector of Genomatix Suite 3.4.1. *Significantly
increased frequencies of putative binding motifs on promoter regions of clustered genes when compared with the vertebrate promoters with a randomly
drawn sample of the same size (P < 0.05).
†
Significantly lower frequency of the activator protein (AP)-1 binding motif when compared with the vertebrate
promoters. EGR, early growth response; NF-κB, nuclear factor-κB; STAT, signal transducer and activator of transcription.
0
10
20
30
40
50
60
70
80
p53 NF-кB AP-1 STAT3 EGR1
Frequency of TFBS (%)
Cluster A
Cluster B
Cluster C1
Cluster C2
Cluster C3
Vertebrate
*
*
*
*
*
*
*
*
*
*
*
**
*
†
†
R78.12 Genome Biology 2007, Volume 8, Issue 5, Article R78 Yan et al. />Genome Biology 2007, 8:R78
Predicted conserved p53 and NF-κB binding sites in proximal promoter regions of five representative genes from clusters A and BFigure 4
Predicted conserved p53 and NF-κB binding sites in proximal promoter regions of five representative genes from clusters A and B. The search for
conserved TFBS was carried out by multiple sequence alignment of each promoter set using DiAlignTF of Genomatix Suite 3.4.1. The promoter region
included about 500 base pairs upstream and about 100 base pairs downstream from the transcription start site (TSS) among human, chimpanzee, mouse,
and rat. (a) The conserved p53 binding motifs were present in two gene promoters from cluster A (CPS1 and ARID1A), and (b) conserved nuclear factor-
κB (NF-κB) binding motifs were present in three gene promoters from cluster B (ICAM1, IL6, and CA9). Letters in bold are the predicted binding sites of
p53 or NF-κB, letters in italic are early growth response (EGR)1 binding sites, and letters underlined denote the core conserved sequence. The numbers
showed predicted transcription factor binding site (TFBS) position from the TSS of human sequences, where negative positions were upstream of the TSS
and positive ones were downstream from the TSS.
(a) Conserved p53 binding sites
CPS1
-105 (p53) -85
5’ -CCCA-TGGAACATC
TCTGGACATTACCTCAGGAGGAGGGGTTAAGAGAAG- 3’ Human
5’ -TCCATTGGAACATC
TCTGGACATCAGCTTGGGAGGAGGGGCTAAGGAAAG- 3’ Mouse
5’ -TCCATTGGAACATC
TCTGGACATCAGCTTGGGAGGAGGGGCTGAGGAGGG- 3’ Rat
ARID1A
+45 (EGR1) p53 74 () +
5’ –AGCGGAGCCTCCACCGCCC
CCCTCATTCCCAGGCAAGGGCTTGGGGGGAA- 3’ Human
5’ -AGCGGAGCCTCCACCGCCCCCCTCATTCCCAGGCAAGGGCTTGGGGGGAA- 3’ Chimpanzee
3’ -AGCGGAGCCTCCACCGCCC
CCCTCATTCCCAGGCAAGGGCTTGGGGGGAA- 5’ Mouse
5’ -AGCGGAGCCTCCACCGCCCCCCTCATTCCCAGGCAAGGGCTTGGGGGGAA- 3’ Rat
(b) Conserved NF-κ B binding sites
ICAM1
-173 (p65/cRel) -158
5’ –ATTGCTTTAGCTTGGAAATTCCGGAGCTGAAGCGGCCAGCGAGGGAGGAT- 3’ Human
5’ -ATTGCTTTAGCTTGGAAA
TTCC
GGAGCTGAAGCGGCCAGCGAGGGAGGAT- 3’ Chimpanzee
5’ -ATTACTTCAGTTTGGAAA
TTCCTAGATCGCAGGGGCCAGCGAGGCAGGAC- 3’ Mouse
5’ -ATTACTTCAGTTTGGAAATTCCTGGGTCGCAGGGGCCAGCGAGGCAGGAC- 3’ Rat
IL6
(p65/cRel) -62-76
5’ –AAATGTGGGATT
TTCCCATGAGTCTCAATATTAGAGTCTCAACCCCCAAT- 3’ Human
5’ -AAATGTGGGATTTTCCCATGAGTCTCAAAATTAGAGAGTTGACTCCTAAT- 3’ Mouse
3’ -AAATGTGGGATTTTCC
CATGAGTCTCAAAAGTAGAGAGTCGACTCCCAAT- 5’ Rat
CA9
+17 (p50) +33
5’ –CGTACACACCGTGTGCTGGGACA
CCCC
ACAGTCAGCCGCATGGCTCCCCT- 3’ Human
5’ -CGTACACACCGTGTGCTGGGACA
CCCC
ACAGTCAGCCACATGGCTCCCCT- 3’ Chimpanzee
5’ -CGTCCACAGTGTGTCCTGGGACA
CCC CAGTCAGCTGCATGGCCTCCCT- 3’ Mouse
5’ -CGTCCACACCGTGTCCTGGGACACCC
CAGTCAGCTGCATGGCTTCCCT- 3’ Rat
Genome Biology 2007, Volume 8, Issue 5, Article R78 Yan et al. R78.13
comment reviews reports refereed researchdeposited research interactions information
Genome Biology 2007, 8:R78
These transcription factor modules are over-represented in
the promoter regions of genes with conserved and confirmed
NF-κB binding sites, such as IL8 (6/14), ICAM1 (6/14), and
IL6 (5/14); genes with conserved NF-κB binding sites, such as
DMAP1 (8/14), TOMM34 (7/14), and KCNN4 (5/14); genes
containing an orthologous promoter, such as YAP1 (6/14);
and ABCG2 (8/14), which did not belong to any of these cate-
gories (Table 3). Furthermore, we identified three NF-κB-
EGRF and one NF-κB-STAT models if only five transcription
factor families (namely NF-κB, p53, STAT, AP-1, and EGRF)
were included in the analysis (Table 3). Both models
containing NF-κB with either EGRF or STAT were observed
Table 3
Putative transcription factor models in clusters A and B over-expressed in HNSCC
Model Model matches in the cluster % of matches
in the cluster
a
% of hits
in GPD
b
Selectivity
c
Selected genes from cluster A
d
p53-TBPF HIST1H2AM, HIST2H2BE, HIST1H2BL, HIST1H2BN, CPS1,
XPA, XCL1
41 4.39 9.4
p53-TBPF-CREB HIST1H2AM, HIST2H2BE, HIST1H2BL, CPS1, XCL1 29 0.68 43.3
p53-TBPF-PCAT HIST1H2AM, HIST2H2BE, HIST1H2BL, HIST1H2BN, CPS1 29 0.25 119.4
p53-TBPF-CREB-TBPF HIST1H2AM, HIST2H2BE, HIST1H2BL, CPS1, XCL1 29 0.19 151.8
p53-TBPF-PCAT-SORY HIST2H2BE, HIST1H2BL, HIST1H2BN, CPS1 24 0.02 1180.9
p53-TBPF-CREB-ECAT HIST1H2AM, HIST2H2BE, HIST1H2BL, CPS1 24 0.05 433.0
p53-TBPF-VBPF-TBPF HIST2H2BE, HIST1H2BL, CPS1, XCL1 24 0.06 371.1
p53-TBPF-CREB-CDXF HIST1H2AM, HIST2H2BE, HIST1H2BL, CPS1 24 0.04 541.2
Selected genes from cluster B
e
ETSF-NFκB TOMM34, DMAP1, ACSL5, YAP1, AKAP12, PLK1,
TXNRD1, IL8
, ABCG2, BIRC2, RAB17
42 17.21 2.5
NFκB-ETSF ICAM1
, DMAP1, YAP1, RPN2, AKAP12, SHANK2, IL8,
ABCG2, BIRC2, RAB17,
38 13.45 3.1
ZBPF-NFκB IL6
, ICAM1, TOMM34, KCNN4, CA9, FADS3, RPN2,
SHANK2, ABCG2, RAB17
38 12.76 3.0
EGRF-NFκB
f
ICAM1, TOMM34, CA9, DMAP1, FADS3, KRT8, ABCG2, MLPH, 31 15.71 2.0
NFκB-EGRF(+)
f
ICAM1, KCNN4, YAP1, FADS3, RPN2, AKAP12,
TXNRD1, ABCG2
31 16.64 1.8
NFκB-EGRF(-)
f
ICAM1, TOMM34, FADS3, TXNRD1, ABCG2, MLPH,
PORIMIN, PTPRJ
31 16.46 1.9
NFκB-STAT
f
ICAM1, TOMM34, DMAP1, FADS3, KRT8, ABCG2, MLPH 27 9.57 2.8
SP1-ZBPF-NFκB IL6
, ICAM1, KCNN4, CA9, FADS3, KRT8 23 4.02 5.7
NFκB-ZBPF-EGRF YAP1, TXND1, AKAP12, FADS3, PPP1R12A, RPN2 23 6.75 3.4
ZBPF-NFκB-MAZF KCNN4, DMAP1, YAP1, FADS3, TXNRD1, ABCG2 23 2.45 9.4
NFκB-PAX5-ZBPF-ZBPF
g
DMAP1, TXNRD1, FADS3, ABCG2, BCAT1 19 1.46 13.2
CREB-ZBPF-NFκB-ETSF
g
IL6, TOMM34, KCNN4, ABCG2, PTPRJ 19 0.35 54.7
NKXH-HOXF-CREB-NFκB-ETSF
g
IL6, TOMM34, DMAP1, IL8 15 0.03 530.8
HNF1-HOXF-CREB-NFκB-ETSF
g
IL6, TOMM34, DMAP1, IL8 15 0.02 943.7
EVI1-LHXF-HNF1-NFκB-ETSF
g
ICAM1, TOMM34, DMAP1, IL8 15 0.01 1213.3
NFκB-EGRF-ETSF-SP1F-ZBPF
g
ICAM1, TXNRD1, YAP1, ABCG2 15 0.22 70.8
EVI1-HNF1-HOXF-NFκB-ETSF
g
ICAM1, TOMM34, DMAP1, IL8 15 0.02 943.7
EBOX-ZBPF-NFκB-MAZF-PAX5
g
KCNN4, YAP1, FADS3, ABCG2 15 0.13 116.3
Shown are the selected models and their matches in the clusters A and B measured using FrameWorker, and hits in Genomatix promoter database
(GPD) measured using ModelInspector of Genomatix Suite 3.4.1 [108]. In general, the distance between two transcription factor binding elements
was limited to 5 to 150 base pairs. Genes in bold are orthologs; those in italic and bold contain conserved nuclear factor-κB (NF-κB) or p53 binding
sites in orthologous promoter sets; underlined genes contain known NF-κB binding site.
a
Percentage of matches in p53 or NF-κB group in the cluster
for that model.
b
Percentage of hits in all human promoters (55,207) in GPD for that model.
c
The ratio between percentage of matches in the cluster
and percentage of hits in the entire human promoters of GPD for that model [116].
d
Including 17 input genes with predicted p53 binding sites in
cluster A. p53 is shown in bold.
e
Including 26 input genes with predicted NF-κB binding sites in cluster B. NF-κB is shown in bold.
f
Model searching
only covered five transcription factor families: NF-κB, p53, signal transducer and activator of transcription (STAT), activator protein (AP)-1, and early
growth response family (EGRF). (-) and (+) indicate strand direction of EGRF binding sites.
g
This distance was set to 5 to 200 base pairs.
R78.14 Genome Biology 2007, Volume 8, Issue 5, Article R78 Yan et al. />Genome Biology 2007, 8:R78
Transcription regulatory module containing multiple transcription factors in eight histone gene promoters from cluster AFigure 5
Transcription regulatory module containing multiple transcription factors in eight histone gene promoters from cluster A. Using FrameWorker of
Genomatix Suite 3.4.1, eight promoter regions of histone genes (two H2A and six H2B) from cluster A were used to predict regulatory modules including
TBPF (TATA-binding protein factors), ECAT (enhancer of CCAAT binding factors), or PCAT (promoter of CCAAT binding factors). p53 binding motifs
were also displayed. '(+)' and '(-)' refer to strand direction of transcription factor binding motifs.
Transcriptional Start Site (TSS)
HIST1H2AC
HIST1H2AM
HIST1H2BC
HIST1H2BD
HIST1H2BJ
HIST1H2BL
HIST1H2BN
HIST2H2BE
100 bp module 1 module 2
p53 (+) TBPF (-) PCAT (+)
p53 (-) ECAT (-)
Genome Biology 2007, Volume 8, Issue 5, Article R78 Yan et al. R78.15
comment reviews reports refereed researchdeposited research interactions information
Genome Biology 2007, 8:R78
in seven common genes: ICAM1, TOMM34, DAMP1, FADS3,
KRT8, ABCG2, and MLPH.
Gene expression and promoter binding activity
modulated by doxorubicin or tumor necrosis factor-α
To obtain experimental evidence on the predicted role of p53
and NF-κB in regulating gene expression of the clusters, we
compared expression levels of selected genes at baseline and
following treatment with classical inducers for p53 (doxoru-
bicin) or NF-κB activation (tumor necrosis factor [TNF]-α),
using real time RT-PCR. For study of cluster A genes, HKCs
were used and treated with doxorubicin to ensure functional
p53 status, because a variety of deficiencies in p53 expression
and function were observed in UMSCC cell lines with differ-
ent p53 status (Friedman, unpublished data). As shown in the
left panels of Figure 6a, doxorubicin treatment either induced
or suppressed expression levels of genes from cluster A in a
time-dependent manner. For genes from clusters B and C, in
which NF-κB promoter binding motifs were prevalent, TNF-
α treatment significantly modulated the expression of multi-
ple genes in UM-SCC 6 cells (Figure 6a; middle and right
panels). To confirm whether predicted NF-κB binding sites in
promoters from cluster B genes are bound by NF-κB compo-
nents, ChIP binding assay was performed using anti-NF-κB
antibodies (p65 and cRel). The results showed the promoter
binding activity of ICAM1, IL8, IL6, and YAP1 genes from
cluster B (Figure 6b). A strong basal and TNF-α induced p65
binding activity in IL8 promoter, and a weaker basal and sig-
nificant TNF-α induced p65 binding activity were observed in
IL6 and ICAM1 promoters, respectively (Figure 6b). Binding
of NF-κB family member cRel to the predicted cRel motif on
the YAP1 promoter was detected and inhibited by TNF-α
(Figure 6b). Minimal nonspecific binding activities were
observed in the negative controls using isotype IgGs. In addi-
tion, we also observed constitutive p53 binding activity to the
promoters of HIST1H2BD and HIST1H2BN from the cluster
A gene list (Yang and coworkers, unpublished data).
Discussion
Gene expression profiles have been intensively studied to
identify critical gene expression signatures related to hetero-
geneity in HNSCC phenotypes [1-8,56]. However, the under-
lying transcriptional regulatory mechanisms have not been
well defined. Until recently, genome-wide analysis of tran-
scriptional regulation involving multiple signal pathways and
transcription factors have mostly been conducted in the
prokaryotic and lower eukaryotic organisms, such as
Escherichia coli and yeast. Little information regarding tran-
scriptional control of global gene expression has been
generated from large-scale analysis of gene expression pro-
files in cancer related investigations. Utilizing array technol-
ogy together with up-to-date bioinformatics analyses and
biologic information, we found evidence for increased
prevalence and differential distribution of TFBSs for five
transcription factors in association with differentially
expressed gene signatures in subsets of HNSCC cell lines. The
five transcription factors p53, NF-κB, AP-1, STAT3, and EGR-
1 have previously been implicated by our laboratory and
others [21,22,24,25,30-33,36,41,50-52] as independent fac-
tors that contribute to malignant progression of HNSCCs.
However, the overall biologic significance and potential scope
of the contribution of these transcription factors in regulating
global and heterogeneous gene expression have not previ-
ously been defined. Our results suggest that over-expressed
gene clusters in human HNSCC subgroups identified by glo-
bal expression profile most likely involve the regulation of
transcription factors p53, NF-κB, and AP-1. In addition, the
broad repertoire of genes over-expressed by most HNSCCs
may be co-regulated by other transcription factors such as
STAT3 and EGR1. Enrichment for binding sites of NF-κB, AP-
1, STAT3, or EGR1 was found in the promoters of genes in
cluster B that are involved in cell survival, inflammation, and
angiogenesis (Figure 2 and Table 2). Some of the genes (IL6,
IL8, YAP1, and BIRC2) were associated with SCC metastatic
progression and aggressive phenotypes in previous studies
[9,38], suggesting that these transcription factors may coop-
erate to activate gene signatures that are important in
pathogenesis and increase the malignant potential of
HNSCCs with a wild-type p53-like expression pattern.
A remarkable observation from this study is the apparent
inverse relationship between expression of cluster A and B
genes and their association with dominant prevalence of
binding sites of p53 in cluster A genes, and NF-κB, AP-1, and
other transcription factors in cluster B genes. Cluster A genes
were expressed at higher levels in most cells with mutant p53
and exhibited a higher frequency of p53 and lower frequency
of AP-1 binding sites than those present in promoters of genes
in other clusters or vertebrate promoters (Figure 3). The seg-
regation of HNSCC cells into subsets with these gene expres-
sion clusters revealed a relationship with p53 mutation status
in most of the cells, which supports the importance of pre-
dicted p53 binding sites (Figure 3). In cluster A genes the
increased prevalence of predicted p53 binding motifs (Figure
3 and Table 2) were consistent with experimental data indi-
cating that selected genes from the list could be modulated by
doxorubicin treatment in HKCs that have normal p53 status
(Figure 6a). Surprisingly, however, cluster A genes were over-
expressed by UM-SCC cells with mutant p53 genotype, and
not by cells with wild-type p53-like expression pattern (Fig-
ure 3). A detailed mechanistic study of the role played by
mutant p53 in cluster A gene expression is underway. Con-
versely, cluster B genes with promoters containing known or
putative motifs for NF-κB were highly represented in
HNSCCs with a wild-type p53-like expression pattern. This
suggests that p53 status may also affect expression of NF-κB
regulated genes. One possible explanation could be related to
a mechanism proposed by Perkins and colleagues [57-59],
who previously showed that lack of functional p53 or p14
ARF
can permit activation of NF-κB, whereas p14
ARF
or p53 activa-
tion can result in a repression of NF-κB regulated genes
R78.16 Genome Biology 2007, Volume 8, Issue 5, Article R78 Yan et al. />Genome Biology 2007, 8:R78
Figure 6 (see legend on next page)
0.0
1.0
2.0
0.0
1.0
2.0
0.0
0.5
1.0
0.0
0.5
1.0
1.5
0.0
5.0
10.0
0.0
5.0
10.0
0.0
5.0
10.0
0.0
1.0
2.0
0.0
1.0
2.0
0.0
0.5
1.0
0.0
2.0
4.0
6.0
8.0
0.0
0.5
1.0
Ralative gene expression (arbitrary unit)
CDKN2C (p18)
XPA
CPS1
HIST1H2BN
ICAM1
IL6
IL8
AKAP12
TNFAIP2
IGFBP3
BAG2
PIK3R3
Control 1 3 6
Dox (h)
*
*
*
*
*
*
*
*
*
*
*
*
*
*
*
*
*
*
*
*
*
*
*
*
*
*
*
*
*
Control 1 2 4 6 8 24
TNF (h)
*
Cluster A Custer B Cluster C
*
*
*
*
*
*
*
*
*
*
*
*
*
*
*
*
*
*
*
Control 1 2 4 6 8 24
TNF (h)
(C1)
(C2)
(C3)
(C)
Antibody p65 IgG Input
TNF - + - + - +
Antibody cRel IgG Input
TNF - + - + - +
IL8
IL6
ICAM1
YAP1
(b)
(a)
Genome Biology 2007, Volume 8, Issue 5, Article R78 Yan et al. R78.17
comment reviews reports refereed researchdeposited research interactions information
Genome Biology 2007, 8:R78
through competition for co-factor CBP/p300 or phosphoryla-
tion of p65 thr 505. Studies of the mechanism(s) underlying
this apparent inverse relationship between p53 and NF-κB
regulated genes in HNSCC cells are in progress (Friedman,
unpublished data).
In this study, we observed segregation of nine out of 10 of the
UM-SCC lines by p53 genotype, with the exception of UM-
SCC 11B cells (Figures 1 and 2). The UM-SCC 11B cell line,
which exhibited a p53 mutation by sequence analysis and het-
erogeneous p53 protein expression in different subpopula-
tions by immunohistochemistry (Figure 1b), clustered with its
parental UM-SCC 11A and other UM-SCC cell lines that
exhibit low expression of wild-type p53 (Figures 1 and 2). The
low mRNA and protein expression of wild-type p53 with defi-
cient p53 function were previously reported in breast cancer
cell lines and tissue specimens [60,61]. At this stage, we have
not yet determined whether the p53 related subgrouping of
UM-SCC cells by gene profiling could result from loss of wild-
type p53 function in the UM-SCC cells with wild-type p53-like
expression pattern, differences in function of the various p53
mutants, or activation or interactions with other p53 family
members or co-factors. Preliminary data revealed the pres-
ence of low transducing activity by reporter gene assay in
UM-SCC 11B and other UM-SCC cells with a wild-type p53-
like expression pattern, which is in contrast to the greater
activity observed in some UM-SCC cells with gain-of-function
mutant p53 (Friedman, unpublished data). In addition, mul-
tiple p53, p63, and p73 family members can compete for the
same binding motifs and differentially regulate various p53
family gene programs, such as those recently implicated in
survival and adhesion of HNSCCs [62]. Exceptions observed
in our study may be useful in dissecting whether certain p53
mutations or alternative family members affect overall gene
expression profiles. Determination of the regulation of these
genes will require further study of the potentially complex
contribution of expression, phosphorylation, and co-factor
interaction of wild-type and p53 mutants, and possibly other
p53 family members such as p63 and p73.
In cluster A, about 25% of genes are involved in chromosome
structure and functions by GO annotation (Additional data
file 2), including eight genes in histone H2A and H2B fami-
lies. However, the biologic significance of heterogeneous
expression of the H2 histone gene family in cancer biology
and the relationship to p53 regulatory mechanisms are not
well understood. It is known that the core structure of the
nucleosome is dependent upon both histone-histone and his-
tone-DNA interactions, and alterations of chromatin struc-
tures and modifications of histone by acetylation and
phosphorylation are basic processes for activation or repres-
sion of gene expression [63]. For example, in H2AX-deficient
mice, embryonic stem cells exhibited impaired recruitment of
specific DNA repair complexes to ionizing radiation-induced
nuclear foci [64]. Histone H2B has been suggested to play a
specific role in UV-induced DNA repair processes in yeast
[65], whereas histone H2B-elicited ubiquitylation may play a
role in gene activation and affect gene silencing [66]. Mdm2
is a negative regulator of p53 that can interact directly with
histones and induce monoubiquitylation of histones H2A and
H2B [67,68]. Yu and coworkers [68] observed that rapid p53-
mediated inhibition of cell cycle progression was induced by
DNA-damaging agents in differentiated neuroblastoma cells,
resulting in induction of cdk2-cyclin E expression followed by
phosphorylation of histone H2B and cell death. In addition,
p53 is also able to recruit p300 to the p21 promoter that leads
to targeted acetylation of chromatin-assembled core histones
H2A, H2B, H3, and H4 [69]. The possible effects of differen-
tial expression of the histone genes in transcription or DNA
integrity in HNSCCs over-expressing mutant p53 warrant
further investigation.
Cluster B genes were over-expressed by UM-SCC cells with
wild-type p53-like expression pattern (Figure 2). Functional
categories of about 40% genes in cluster B with dominant NF-
κB binding sites belong to cell proliferation and signal trans-
duction (Table 2). TNF-α induced rapidly and significantly
increased expression of several known NF-κB targeted genes,
including ICAM1, IL6, IL8 and TNFAIP2, but the mecha-
nisms are less well understood for the rest of the genes pre-
sented (Figure 6a). We previously showed that, in HNSCCs,
NF-κB elicited over-expression of cytokine and growth factor
genes that promote inflammation and angiogenesis, such as
IL1, IL6, IL8, GRO-1, GM-CSF, and VEGF
[21,22,24,25,37,49,70]. Molecular profiling of transformed
and metastatic murine SCCs showed that Gro1 (IL8
homolog), antiapoptotic gene cIAP-1 (cIap-1/Birc2), and
Yap65 (YAP 1) were upregulated and clustered together in
association with activation of NF-κB and tumor growth, met-
astatic progression, and angiogenesis [37,38]. Chung and
coworkers [71] recently identified human homologs of a set of
99 genes from our murine tumor model. These genes are
modulated by NF-κB and highly represented in a gene cluster
and subset of patients with HNSCC who have poor prognosis
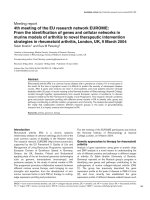
Basal and inducible gene expression, and promoter binding activity were modulated by doxorubicin or TNF-αFigure 6 (see previous page)
Basal and inducible gene expression, and promoter binding activity were modulated by doxorubicin or TNF-α. (a) Human keratinocyte (HKC) cells were
treated with doxorubicin (Dox; 0.5 μg/ml, left panels), and the UM-SCC 6 cell line was treated with tumor necrosis factor (TNF)-α (2000 U/ml, center and
right panels) for different periods, as indicated. Total RNA was harvested by Trizol and genes selected from clusters A to C were analyzed by real-time
reverse transcription polymerase chain reaction (RT-PCR). The data are presented as the mean plus standard deviation from triplicates with normalization
by 18S ribosome RNA. '(C1)', '(C2)', and '(C3)' refer to the three subclusters of cluster C. '(C)' refers to genes in cluster C outside subclusters C1 to C3.
(b) Chromatin immunoprecipitation assays were performed in UM-SCC 11A cells using rabbit polyclonal anti-p65 or cRel antibodies with IgG isotype
control.
R78.18 Genome Biology 2007, Volume 8, Issue 5, Article R78 Yan et al. />Genome Biology 2007, 8:R78
[71]. In addition, some cluster B genes, such as BIRC2 (cIAP-
1), YAP1, and KRT18 were also identified by another labora-
tory using 5 UM-SCC cell lines resistant to cisplatin [5]. Jeon
and coworkers [1] studied 25 UM-SCC lines, including 11A,
11B, 22A and 22B; three of the genes in their upregulated gene
cluster, namely IL8, KRT8, and TXNRD1, overlapped with
our cluster B gene list. Recently, Roepman and coworkers [9]
reported that cluster B genes IL6, IL8, YAP1, and BIRC2 are
upregulated in metastatic HNSCC tumor specimens. ICAM1
is another NF-κB regulated gene in the cluster B list and is
implicated in adhesion in a wide range of inflammatory and
immune responses, and carcinogenesis [72-75]. Together,
these data indicate that heterogeneity in expression of genes
in clusters B and C are important in the malignant phenotype
and therapeutic resistance, and that NF-κB and other tran-
scription factors contribute to their differential expression in
HNSCCs.
Increased prevalence of STAT3 and EGR1 binding motifs
were predicted in the promoters and distributed throughout
the gene clusters over-expressed by UM-SCC cells, when
compared with those in vertebrate promoters, indicating that
these transcription factors could play a broader or co-regula-
tory role with other transcription factors in gene expression in
HNSCC tumorigenesis [31-33,36]. In addition, the
occurrence of three EGRF-NF-κB and one STAT-NF-κB puta-
tive modules were identified, which is consistent with previ-
ous examples indicating that NF-κB can actively interact with
STAT3, EGR1, and other transcription factors to regulate
cytokine and growth factor expression, and receptor kinase
activation [76-79]. Our previous experimental data are also
consistent with the hypothesis that NF-κB may interact with
EGR1, activated by hepatocyte growth factor (HGF) and the
tyrosine kinase receptor c-MET, to co-regulate gene expres-
sion in HNSCC [36,48]. EGR1 can be activated through HGF/
c-Met tyrosine kinase receptor and protein kinase C depend-
ent mechanisms and induce PDGF and VEGF [48]. HGF pro-
moted expression of angiogenesis factors in tumor cells
through both mitogen-activated protein kinase kinase and
phosphatidylinositol 3-kinase dependent pathways [48].
Over-expression of c-Met expression enhanced the expres-
sion of angiogenesis factors IL8, VEGF, and PDGF in
response to HGF in vitro [48], and increased tumorigenesis
and metastasis in the tumor microenvironment [80].
Identification of TFBSs by sequence similarity only indicates
the potential for physical binding of transcription factors to
their corresponding regulatory regions. These binding motifs
do not all necessarily play functional roles in the biologic con-
text. Determination of conservation of cis-regulatory ele-
ments across species, or so-called phylogenetic footprinting
[81,82], is useful in predicting a functional role of cis-regula-
tory motifs in transcriptional regulation [10,82]. We analyzed
conserved TFBSs by two steps at the sequence level, including
annotation of orthologous genes and study of the similarity of
TFBSs in aligned regulatory regions. We found a majority of
the putative TFBSs (more than about 60%) appeared in
orthologous promoter sets of cluster A or cluster B (Table 2),
and conserved binding sites for p53 and NF-κB were observed
in five and ten genes of the two clusters (Figure 4). These data
suggest that these predicted TFBSs are likely to be functional
in evolution, and the activities of some predicted TFBSs have
been tested experimentally. As shown in Figure 6a, among the
genes we selected for experiment, ten out of 12 gene promot-
ers fell within orthologous regions (except HIST1H2BN and
IL8; Table 2). Their levels of gene expression were regulated
by doxorubicin or TNF-α (Figure 6a).
It is widely believed that transcriptional regulation of gene
expression is most often accomplished by functional cooper-
ation of multiple transcription factors rather than a single fac-
tor. In the promoters of cluster A genes, p53 binding motifs
were predicted to co-localize with TBPF motifs for TATA-
binding proteins (Table 3). As a regulatory module, p53-
TBPF interacts with other transcription factors that could
contribute significantly to the controlling mechanism of clus-
ter A gene expression regulating chromosome structure,
function, and stability (Table 3). In addition, a putative com-
mon regulatory module for all eight histone genes in cluster A
was identified as TBPF-ECAT-PCAT with high selectivity
(Figure 5). It is interesting that the predicted p53 binding
sites in four histone genes are close to this module. Using Bib-
lioSphere PathwayEdition of Genomatix, the functional co-
citations of p53-NFYC (nuclear factor YC) and p53-YB-1 (Y-
box-binding protein 1) were observed, and NFYC and YB-1
belong to ECAT and PCAT families. It has been shown that
YB-1 (also known as DNA binding protein B) accumulates in
the nucleus under genotoxic stress only when cells retain
wild-type p53, whereupon YB-1 inhibits p53 activity [83]. The
NFY family, including A, B and C subunits, are histone-like
CCAAT-binding trimers and are specifically required for con-
sensus CCAAT-box binding in enhancer regions [84-86]. The
core regions of NFYC and NFYB proteins exhibited high
sequence similarity with histones H2A and H2B, respectively
[84,87,88], and NFYC has been shown to be an important tar-
get of p53 regulation in wild-type p53 mediated gene repres-
sion [89,90].
In addition to the dominant NF-κB binding motifs on the pro-
moter regions of cluster B, we also captured 14 candidate NF-
κB related regulatory models linked with orthologous pro-
moter sets, or the conserved or experimentally defined NF-κB
binding sites (Table 3). Six genes, namely IL6, IL8, ICAM1,
KCNN4, TOMM34, and DMAP1, which contain phylogenetic
conserved or known NF-κB binding sites were highly
enriched in these selected models. The majority of the regula-
tory modules contain ETSF-NF-κB, ZBPF-NF-κB and EGRF-
NF-κB with other TFBSs. The ETS family is a large set of tran-
scription factors that is characterized by an evolutionally con-
served ETS domain; they are related to cancer cell growth,
signal transduction, angiogenesis, cell proliferation, and
apoptosis [91-94]. ZBP-89 (also called ZNF-148), a main
Genome Biology 2007, Volume 8, Issue 5, Article R78 Yan et al. R78.19
comment reviews reports refereed researchdeposited research interactions information
Genome Biology 2007, 8:R78
ZBPF member, is a Krüppel-type zinc-finger protein and is
involved in transcriptional regulation of a variety of genes
[95], cell growth arrest [96,97], and apoptosis and cell death
[96]. Borghaei and coworkers [98] found that both ZBP-89
and NF-κB binding to SIRE (stromelysin IL-1 responsive ele-
ment) sites of the matrix metalloproteinase-3 promoter in
response to inflammatory cytokines [98]. Coordinated bind-
ing of ZBP-89, SP1, and NF-κB p65/p50 in the ENA-78 (epi-
thelial neutrophil-activating peptide-78) promoter play a
major role in the regulation of ENA-78 expression in Caco-2
human colonic epithelial cells [99]. Thus, the regulation of
genes in cluster B by NF-κB is most likely linked to ETS mem-
bers or ZBPF. We are currently conducting studies to confirm
this co-operation of transcription factors and their binding to
the promoter sequence experimentally.
In our ten UM-SCC cell lines, unique and novel gene expres-
sion signatures were identified by cDNA microarray analysis,
and the newly discovered regulatory mechanisms that control
such gene expression signatures (predominantly involving
transcription factors) were revealed. Important genes within
the expression profiles, and the related transcriptional regu-
latory mechanisms identified, are consistent with observa-
tions from clinical studies in more complex tissue specimens
in independent studies at our and other institutions,
supporting the biologic and clinical relevance of genes within
clusters identified in our study in an experimental cell system
[5-8,13,16-20,31,32,41,70,71].
Conclusion
A distinct molecular gene classification of HNSCC cells was
obtained with differentially expressed gene clusters associ-
ated with different p53 genotype and protein expression sta-
tus. The prevalences of p53, NF-κB, and AP-1 binding sites
were observed in the promoter regions of different gene clus-
ters, suggesting their importance for the subgrouping of
HNSCCs. Increases in STAT3 and EGR1 binding sites were
observed in all over-expressed gene clusters compared with
vertebrate promoters, indicating their broader role in co-reg-
ulating the expression of genes in HNSCCs. The importance
of these transcriptional regulatory elements in clustered gene
expression by UM-SCC cells was supported by the prediction
of several regulatory modules in different gene clusters,
experimentally modulated gene expression under doxoru-
bicin and TNF-α, and NF-κB binding activity measured by
ChIP assays. Therefore, our finding of the predominant role
of p53, NF-κB, and other transcription factors provides a use-
ful clue for elucidating the mechanisms that control differen-
tial expression of gene clusters and related molecular
classifications in HNSCCs, and to develop targeted therapeu-
tics in the future.
Materials and methods
Cell lines
Ten established HNSCC cell lines, namely UM-SCC 1, 5, 6, 9,
11A, 11B, 22A, 22B, 38, and 46, were obtained from the Uni-
versity of Michigan series of HNSCC cell lines (Ann Arbor,
MI, USA), as described previously and in Table 1[26,48,70].
HKCs were obtained from four individuals (Cascade Biologics
Inc., Portland, OR, USA), and cultured following the manu-
facturer's suggestions.
DNA sequencing
Genomic DNA was isolated using Trizol method, in accord-
ance with the manufacturer's suggestions (Invitrogen,
Carlsbad, CA, USA). DNA sequencing was conducted using
PCR with reported primers for p53 exons 4 to 9, and samples
were sequenced bidirectionally using Applied Biosystems
DNA sequencers (Applied Biosystems, Foster City, CA, USA),
in accordance with the manufacturer's protocol, at the
NIDCD (National Institute on Deafness and Other Communi-
cation Disorders) Core Sequencing Facility. All p53 mutations
were confirmed in independent PCR reactions to ensure that
the mutation was not an artifact of PCR.
Immunocytochemistry
Immunostaining of p53 protein was performed in cultured
UM-SCC cells. Briefly, UM-SCC cells (1 to 2 × 10
4
) were plated
on eight-well chamber slides (Lab-Tek, Naperville, IL, USA)
for 2 to 3 days, fixed, and permeabilized in freshly made cold
methanol:acetone (1:1). Then, 1% hydrogen peroxide (Fisher
Scientific, Fair Lawn, NJ, USA) was used for blockade of
endogenous peroxidase. Ten per cent blocking serum (Vector
Labs, Inc., Burlingame, CA, USA) was used to block the
nonspecific binding sites for 20 min and removed without
washing. The samples were incubated with the primary anti-
bodies, namely 2 μg/ml mouse anti-human p53 (DO-1, IgG
2a
;
Calbiochem, EMD Biosciences, San Diego, CA, USA) or iso-
type control mouse IgG (Cat# I2000, Vector Labs, Inc.),
which were diluted in phosphate-buffered saline with 10%
blocking serum overnight at 4°C. The samples were blocked
with 5% serum for 20 min and incubated with the secondary
biotinylated antibody for 30 min, followed by 30 min incuba-
tion with biotin/avidin horseradish peroxidase conjugates
(Vectastain Elite ABC kit; Vector Labs, Inc.) and chromogen
DAB (ciaminobenzidine tetrahydro-chloride; Vector Labs,
Inc.), in accordanc with the manufacturer's specifications.
Microarray experiments and data collection
The experimental methods used for microarray were recently
described [44,100]. Briefly, the cDNA microarray chips of
24,000 human elements were developed and printed by
National Human Genome Research Institute (Bethesda, MD,
USA). Total RNA was isolated from UM-SCC cell lines or
HKCs, reverse transcribed, labeled with Cy5, and combined
with the Cy3 labeled cDNA reverse transcribed from human
universal reference RNA (Stratagene, La Jolla, CA, USA). The
labeled targets were hybridized on to the cDNA array chip at
R78.20 Genome Biology 2007, Volume 8, Issue 5, Article R78 Yan et al. />Genome Biology 2007, 8:R78
65°C overnight. Fluorescence intensity was obtained using a
GenePix 4000 microarray scanner with GenePix Pro software
(Axon Instruments, Union City, CA, USA).
Microarray data analysis according to the p53 related
expression pattern of UM-SCC cell lines
The 24,000 cDNA microarray chips contained a total of
23,220 spots, which includes known genes, expressed
sequence tags, hypothetical proteins, and control spots. There
were 12,270 known gene sports on the arrays [44], where a
list of 9,273 known genes with good quality were generated
and subjected to principal components analysis and genome-
wide gene expression hierarchical clustering. The results seg-
regated cells into three distinct groups, HKCs, UM-SCC cells
with wild-type p53-like expression pattern (including UM-
SCC 11B), and most cells with mutant p53 [44]. We have
tested the subgrouping of UM-SCC cells using four strategies:
principle components analysis of 9,273 known genes; hierar-
chical clustering analysis of 9,273 known genes; hierarchical
clustering analysis of genes that exhibited at least twofold
changes in gene expression among keratinocytes, five UM-
SCC lines with mutant p53, and five UM-SCC lines with wild-
type p53-like status (including UM-SCC 11B cells); and hier-
archical clustering analysis of the genes with at least twofold
changes in gene expression among the groups when UM-SCC
11B was included in the mutant p53 group. Under all four cir-
cumstances, UM-SCC 11B line is always grouped with UM-
SCC cells with wild-type p53-like group, but not with the
group of cells with mutant p53. The significance of this group-
ing of cells has been tested by multiple statistical methods in
the 'class prediction analysis' provided in BRB-Array Tools
developed by the US National Institutes of Health, in which
UM-SCC 11B was predicted to belong to the group designated
wild-type p53-like (P < 0.001) [45]. Based on these observa-
tions, we defined the subset of UM-SCC cells with wild-type
p53 genotype plus UM-SCC 11B cells as exhibiting a wild-type
p53-like expression pattern.
In order to analyze further the differential gene expression
between HKCs and UM-SCC cells with different p53 status,
we selected genes that satisfy at least one of the following cri-
teria (two-tailed t-test, P < 0.05): twofold or greater change in
average gene expression between UM-SCC cells in either
group when compared with the average gene expression by
HKCs; and twofold or greater change in average gene expres-
sion between ten tumor cell lines and HKCs. Hierarchical
clustering was performed using Stanford University software
Cluster 2.11 [101]. Missing data from microarray were esti-
mated using K imputer of SAM 2.11 [102]. Normalized two-
based log ratios for 1,011 genes were median-centered within
each gene and array for all of the cluster analyses. The cluster-
ing results were obtained based on average linkage with one
minus Pearson correlation distance metrics. The expression
of clustered genes was visualized using Java Treeview [103].
A mixed model based F test was used to analyze differential
gene expression among three groups: HKCs, UM-SCC cell
lines with wild-type p53-like expression patterns, and UM-
SCC cell lines with mutant p53 expression patterns. Such a
model was used to test the fixed effects of random factors
[104,105]. Each gene expression level was measured inde-
pendently for each subject with homogeneous variance. The
normalized model for this study is as follows:
Y
ijg
= μ + S
j
+ G
g
+ Ex
i(c,w,m)
+ ε
ijg
Where Y
ijg
denotes response of gene g for subject j in group i
(c, w, m); μ is a fixed effect that represents an overall mean
value; S
j
is the random effect of each subject; G
g
is the random
effect of each gene; ε
ijg
is the random error; Ex
(c,w,m)
is the
fixed effect for different gene expression type; c is HKCs; w is
wild-type p53-like; and m is mutant p53. Restricted maxi-
mum likelihood was used to estimate the covariance parame-
ters in the model. The F test was performed in mixed model
using SAS 9.1 program (SAS Institute Inc. Cary, NC, USA). P
< 0.05 between two groups was considered statistically
significant.
Gene Ontology annotation
GO annotation was performed using Onto-Express [46],
AmiGo [106], and Entrez Gene database of National Center
for Biotechnology Information (National Institutes of Health,
Bethesda, MD, USA) [107]. Onto-Express dynamically calcu-
lates P values for the GO term based on the abstraction level
chosen by the user. A hypergeometric distribution was used
to calculate the significance values in the probability model
[46]. Corrected P < 0.05 was used as cutoff value in this study.
Prediction of transcription factor binding sites on
promoters of clustered genes
Promoter sequences of selected genes were extracted using
ElDorado task of commercial Genomatix software suite 3.4.1
[108]. The promoter regions were defined as 'optimized'
regions by Genomatix Suite 3.4.1, in which the average 'opti-
mized' length of 159,207 vertebrate promoters is 632 bp, usu-
ally including about 500 bp upstream of the most 5' mapped
transcription start site and about 100 bp downstream from
the most 3' mapped transcription start site. The vertebrate
promoters in GPD consist of 55,207 from human, 69,108
from mouse, and 35,190 from rat. GEMS Launcher of Geno-
matix is an integrated software package and contains multiple
tasks of sequence analysis and functional genomics, including
MatInspector. MatInspector is used to search transcription
factor matrix matches based on position weight matrices,
which provide powerful estimates for searching for TFBSs
and have been used successfully to detect functional tran-
scription factor elements [109-111]. To reduce false-positive
findings, MatInspector also used optimized transcription fac-
tor matrix thresholds and transcription factor family concept,
and incorporated data from independent publications
[112,113].
Genome Biology 2007, Volume 8, Issue 5, Article R78 Yan et al. R78.21
comment reviews reports refereed researchdeposited research interactions information
Genome Biology 2007, 8:R78
In this study, the Gene2Promoter task in Genomatix was used
to analyze a set of genes (cluster) when searching for TFBSs
through MatInspector. All matrices of p53, NF-κB, and AP-1
families were used. The matrices for p53 family included the
full length, 5' half site, or 3' half site of its binding motifs. NF-
κB family included five subunits: RelA (p65), RelB, cRel, NF-
κB1 (p50), and NF-κB2. AP-1 family consisted of c-Jun, JunB,
JunD, c-Fos, FosB, Fra-1, Fra-2, BATF, JDP2, and SNFT. We
chose matrix STAT3.01 for the STAT3 search, and matrices
EGR1.01 and EGR1.02 for the EGR1 search. Default matrix
indices (core similarity: 0.75; matrix similarity: optimized)
were set during TFBS searching.
The P value of TFBS frequency in a given cluster was calcu-
lated by MatInspector. It refers to the probability of obtaining
an equal or greater number of sequences with a match in a
randomly drawn sample of the same size as input sequence
set [108]. P calculation was based on 'positional bias' [114]
and the precalculated number of promoter matches in GPD.
The lower this probability, the greater is the importance of the
observed transcription factor. The χ
2
test for TFBSs distrib-
uted in different clusters was also conducted.
Prediction of orthologous promoter regions and
regulatory modules of multiple transcription factor
binding sites
To find conserved TFBSs, we extracted orthologous promoter
sets in proximal promoter region with average 'optimized'
length among human, mouse, and rat for every gene of inter-
est using 'Comparative genomics' in ElDorado. Multiple
sequence alignment of each same promoter set was carried
out using the DiAlignTF task of GEMS Launcher. DiAlignTF
is able to reduce false-positive findings and display the most
likely functional TFBSs within orthologous promoters [112].
Another task, FrameWorker, offers a technology with which
to define a common framework of TFBSs from a set of pro-
moter sequences, which was used to construct promoter
models consisting of at least two TFBSs for each clustered
gene. Such models represent the smallest functional tran-
scriptional unit and putative regulatory module [115]. In this
study, we used two sets of genes with either p53 or NF-κB
binding sites. In general, the distance of two TFBSs was lim-
ited to 5 to 150 bp. For the group with NF-κB binding sites,
the distance was set to 5 to 200 bp in order to search models
containing four or five TFBSs. Default values were used for
other parameters. Such frameworks were refined further with
comparative genomics. However, in the p53 group, all genes
in the putative models contain at least one p53 binding site.
In each model, there was at least one orthologous promoter
contains conserved p53 binding sites. The minimal number of
the selected genes was seven for two TFBSs, five for three
TFBSs, and four for four TFBSs. In the group containing NF-
κB binding sites, only models satisfying the following condi-
tions were selected: they contained at least one NF-κB bind-
ing site; at least 60% matched gene promoters contained
orthologous regions among human, mouse, and rat. The min-
imal numbers of selected genes were ten for two TFBSs, six
for three TFBSs, five for four TFBSs, and four for five TFBSs.
Considering the large distance used in defining models
containing four to five TFBSs, we set an additional condition;
specifically, the model had to contain at least a gene with con-
served or known NF-κB binding sites.
The predicted models were then used to scan the entire
human database of GPD, containing 55,207 promoters, using
ModelInspector of GEMS Launcher. The number of hits and
percentage of hits in GPD were traced. The percentage was
also used to calculate selectivity in order to evaluate the puta-
tive models. 'Selectivity' was calculated using the following
formula: percentage of matches in the cluster (the third col-
umn in the Table 3) divided by percentage of hits in GPD (the
fourth column in the Table 3) [116]. The former refers to pro-
portion of matches in certain gene clusters.
Basal and inducible gene expression in HKCs and UM-
SCC cells
Gene expression profiles generated from microarray were
confirmed by real-time quantitative RT-PCR using the
Assays-on-Demand™ Gene Expression Assay (Applied Bio-
systems, Foster City, CA, USA). Briefly, cultured UM-SCC
cells at 70% to 80% confluence were treated with or without
TNF (2,000 units/ml, Knoll Pharmaceutical Company,
Whippany, NJ, USA) or doxorubicin (0.5 μg/ml, Sigma, St.
Louis, MO, USA) for different time points, and total RNA was
isolated using Trizol (Invitrogen, Carlsbad, CA, USA). cDNA
synthesis was performed by using High-Capacity cDNA
Archive Kit (Applied Biosystems) to synthesize single-
stranded cDNA from total RNA samples, in accordance with
the manufacturer's protocol. The PCR cycling was carried out
by adding 30 ng cDNA in 30 μl of PCR reaction mix (1.5 μl of
20× assay mix and 15 μl of 2× TaqMan Universal Master Mix;
Applied Biosystems). Amplification conditions were as fol-
lows: activation of enzymes for 2 min at 50°C and 10 min at
95°C, followed by 40 cycles at 15 s at 95°C and 1 min at 60°C.
Thermal cycling and fluorescence detection was done using
an ABI Prism 7700 Sequence Detection System (Applied Bio-
systems). Relative quantitation of the expression was calcu-
lated by normalizing the target gene signals with the 18S
endogenous control. An arbitrary unit was calculated after
setting C
T
equal to 40 as undetectable expression level.
Chromatin immunoprecipitation assay
ChIP assays were performed using the EZ ChIP assay kit
(Upstate Biotechnology, Waltham, MA, USA), following the
manufacturer's directions. Briefly, cultured UM-SCC cells at
70% to 80% confluence were treated with or without TNF-α
(2,000 unit/ml) for 1 hour. DNA and proteins were cross-
linked by 1% formaldehyde, whole cell lysates then were har-
vested, and sonicated using SONICATOR XL2020 (Misonix
Inc, Farmingdale, NY, USA). Pre-cleared chromatin was
immunoprecipitated with a rabbit polyclonal antibody
R78.22 Genome Biology 2007, Volume 8, Issue 5, Article R78 Yan et al. />Genome Biology 2007, 8:R78
against p65 (Upstate Biotechnology), or c-Rel subunits (Santa
Cruz, Biotechnology, Inc, Santa Cruz, CA, USA) of human NF-
κB or normal rabbit IgG (Upstate Biotechnology), followed by
incubation with protein A-agarose saturated salmon sperm
DNA (Upstate Biotechnology). Precipitated DNA was ana-
lyzed by PCR (35 cycles) with Platinum Taq DNA Polymerase
(Invitrogen, Carlsbad, CA). The PCR products were analyzed
on a 2% agarose E-Gel (Invitrogen). Primers for the IL8 pro-
moter (-121 to +61 bp) were 5'-GGGCCATCAGTTGCAAATC-
3' (forward) and 5'-TTCCTTCCGGTGGTTTCTTC-3'
(reverse). For the IL6 promoter (-203 to -60 bp) they were 5'-
TGCACTTTTCCCCCTAGTTG-3' (forward) and 5'-TCAT-
GGGAAAATCCCACATT-3' (reverse). For the ICAM1 pro-
moter (-385 to -157 bp) they were 5'-
GCAGCCTGGAGTCTCAGTTT-3' (forward) and 5'-TCCG-
GAATTTCCAAGCTAAA-3' (reverse). Finally, for the YAP1
(Yes-associated protein 1) promoter (-309 to -164) they were
5'-TAGCAACTTGCAGCGAAAAG-3' (forward) and 5'-GCCT-
CAAACGCCAAAACTAA-3' (reverse). All of the above PCR
amplified regions contained at least a putative NF-κB binding
site, as predicted by Genomatix Suite 3.4.1.
Additional data files
The following additional data are available with the online
version of this paper. Additional data file 1 shows list of genes
in cluster C (over-expressed in UM-SCC cells). Additional
data file 2 includes GO annotations of genes in clusters A to C
(over-expressed in UM-SCC cells) and of genes in clusters D
to F (under-expressed in UM-SCC cells). Additional data 3
provides sequences, location, and matrix similarity of puta-
tive TFBSs in genes in clusters A and B (over-expressed in
UM-SCC cells).
Additional data file 1Genes in cluster CShown is a list of genes in cluster C (over-expressed in UM-SCC cells).Click here for fileAdditional data file 2GO annotations of genes in clusters A to FIncluded are GO annotations of genes in clusters A to C (over-expressed in UM-SCC cells) and of genes in clusters D to F (under-expressed in UM-SCC cells).Click here for fileAdditional data file 3Sequences, location, and matrix similarity of putative TFBSs in genes in clusters A and BProvided are sequences, location, and matrix similarity of putative TFBSs in genes in clusters A and B (over-expressed in UM-SCC cells).Click here for file
Acknowledgements
This work is supported by NIDCD Intramural project Z01-DC-00016. We
are grateful to Drs Thomas E Carey and Carol R Bradford (University of
Michigan, Ann Harbor, MI, USA) for providing UM-SCC cell lines and
related clinical data. We should like to express our appreciation to Dr
Xiaojiang Xu for his prompt effort in biostatistical analysis of microarray
data (Biometric Research Branch, Division of Cancer Treatment and Diag-
nosis, NCI/NIH). We should also like to express our appreciation to Drs
Hong-Wei Sun (NIAMS/NIH), Myong-Hee Sung (NCI/NIH), and the NIH
Fellows Editorial Board for their critical reading and helpful comments.
References
1. Jeon GA, Lee JS, Patel V, Gutkind JS, Thorgeirsson SS, Kim EC, Chu
IS, Amornphimoltham P, Park MH: Global gene expression pro-
files of human head and neck squamous carcinoma cell lines.
Int J Cancer 2004, 112:249-258.
2. Warner GC, Reis PP, Makitie AA, Sukhai MA, Arora S, Jurisica I, Wells
RA, Gullane P, Irish J, Kamel-Reid S: Current applications of
microarrays in head and neck cancer research. Laryngoscope
2004, 114:241-248.
3. Choi P, Chen C: Genetic expression profiles and biologic
pathway alterations in head and neck squamous cell
carcinoma. Cancer 2005, 104:1113-1128.
4. Gonzalez HE, Gujrati M, Frederick M, Henderson Y, Arumugam J,
Spring PW, Mitsudo K, Kim HW, Clayman GL: Identification of 9
genes differentially expressed in head and neck squamous
cell carcinoma. Arch Otolaryngol Head Neck Surg 2003,
129:754-759.
5. Akervall J, Guo X, Qian CN, Schoumans J, Leeser B, Kort E, Cole A,
Resau J, Bradford C, Carey T, et al.: Genetic and expression pro-
files of squamous cell carcinoma of the head and neck corre-
late with cisplatin sensitivity and resistance in cell lines and
patients. Clin Cancer Res 2004, 10:8204-8213.
6. Ginos MA, Page GP, Michalowicz BS, Patel KJ, Volker SE, Pambuccian
SE, Ondrey FG, Adams GL, Gaffney PM: Identification of a gene
expression signature associated with recurrent disease in
squamous cell carcinoma of the head and neck. Cancer Res
2004, 64:55-63.
7. Chung CH, Parker JS, Karaca G, Wu J, Funkhouser WK, Moore D,
Butterfoss D, Xiang D, Zanation A, Yin X, et al.: Molecular classifi-
cation of head and neck squamous cell carcinomas using pat-
terns of gene expression. Cancer Cell 2004, 5:489-500.
8. Hunter KD, Thurlow JK, Fleming J, Drake PJ, Vass JK, Kalna G,
Higham DJ, Herzyk P, Macdonald DG, Parkinson EK, et al.: Diver-
gent routes to oral cancer. Cancer Res 2006, 66:7405-7413.
9. Roepman P, Kemmeren P, Wessels LF, Slootweg PJ, Holstege FC:
Multiple robust signatures for detecting lymph node metas-
tasis in head and neck cancer. Cancer Res 2006,
66:2361-2366.
10. Fickett JW, Wasserman WW: Discovery and modeling of tran-
scriptional regulatory regions. Curr Opin Biotechnol 2000,
11:19-24.
11. Sionov RV, Haupt Y: The cellular response to p53: the decision
between life and death. Oncogene 1999, 18:6145-6157.
12. Heinrichs S, Deppert W: Apoptosis or growth arrest: modula-
tion of the cellular response to p53 by proliferative signals.
Oncogene 2003, 22:555-571.
13. Hollstein M, Sidransky D, Vogelstein B, Harris CC: p53 mutations
in human cancers. Science 1991, 253:49-53.
14. Olivier M, Eeles R, Hollstein M, Khan MA, Harris CC, Hainaut P: The
IARC TP53 database: new online mutation analysis and rec-
ommendations to users. Hum Mutat 2002, 19:607-614.
15. Vousden KH, Lu X: Live or let die: the cell's response to p53.
Nat Rev Cancer 2002, 2:594-604.
16. Brennan JA, Boyle JO, Koch WM, Goodman SN, Hruban RH, Eby YJ,
Couch MJ, Forastiere AA, Sidransky D: Association between cig-
arette smoking and mutation of the p53 gene in squamous-
cell carcinoma of the head and neck. N Engl J Med 1995,
332:712-717.
17. Melhem MF, Law JC, el-Ashmawy L, Johnson JT, Landreneau RJ,
Srivastava S, Whiteside TL: Assessment of sensitivity and
specificity of immunohistochemical staining of p53 in lung
and head and neck cancers. Am J Pathol 1995, 146:1170-1177.
18. Nylander K, Schildt EB, Eriksson M, Magnusson A, Mehle C, Roos G:
A non-random deletion in the p53 gene in oral squamous cell
carcinoma. Br J Cancer 1996, 73:1381-1386.
19. Quon H, Liu FF, Cummings BJ: Potential molecular prognostic
markers in head and neck squamous cell carcinomas. Head
Neck 2001, 23:147-159.
20. Blons H, Laurent-Puig P: TP53 and head and neck neoplasms.
Hum Mutat 2003, 21:252-257.
21. Ondrey FG, Dong G, Sunwoo J, Chen Z, Wolf JS, Crowl-Bancroft CV,
Mukaida N, Van Waes C: Constitutive activation of transcrip-
tion factors NF-(kappa)B, AP-1, and NF-IL6 in human head
and neck squamous cell carcinoma cell lines that express
pro-inflammatory and pro-angiogenic cytokines. Mol Carcinog
1999, 26:119-129.
22. Duffey DC, Chen Z, Dong G, Ondrey FG, Wolf JS, Brown K, Sieben-
list U, Van Waes C: Expression of a dominant-negative mutant
inhibitor-kappaBalpha of nuclear factor-kappaB in human
head and neck squamous cell carcinoma inhibits survival,
proinflammatory cytokine expression, and tumor growth in
vivo. Cancer Res 1999, 59:3468-3474.
23. Duan J, Friedman J, Nottingham L, Chen Z, Ara G, Van Waes C:
Nuclear factor-kappaB p65 small interfering RNA or protea-
some inhibitor bortezomib sensitizes head and neck squa-
mous cell carcinomas to classic histone deacetylase
inhibitors and novel histone deacetylase inhibitor PXD101.
Mol Cancer Ther 2007, 6:37-50.
24. Wolf JS, Chen Z, Dong G, Sunwoo JB, Bancroft CC, Capo DE, Yeh
NT, Mukaida N, Van Waes C: IL (interleukin)-1alpha promotes
nuclear factor-kappaB and AP-1-induced IL-8 expression,
cell survival, and proliferation in head and neck squamous
cell carcinomas. Clin Cancer Res 2001, 7:1812-1820.
25. Bancroft CC, Chen Z, Yeh J, Sunwoo JB, Yeh NT, Jackson S, Jackson
C, Van Waes C: Effects of pharmacologic antagonists of epi-
Genome Biology 2007, Volume 8, Issue 5, Article R78 Yan et al. R78.23
comment reviews reports refereed researchdeposited research interactions information
Genome Biology 2007, 8:R78
dermal growth factor receptor, PI3K and MEK signal kinases
on NF-kappaB and AP-1 activation and IL-8 and VEGF
expression in human head and neck squamous cell carci-
noma lines. Int J Cancer 2002, 99:538-548.
26. Yu M, Yeh J, Van Waes C: Protein kinase casein kinase 2 medi-
ates inhibitor-kappaB kinase and aberrant nuclear factor-
kappaB activation by serum factor(s) in head and neck squa-
mous carcinoma cells. Cancer Res 2006, 66:6722-6731.
27. Pahl HL: Activators and target genes of Rel/NF-kappaB tran-
scription factors. Oncogene 1999, 18:6853-6866.
28. Richmond A: Nf-kappa B, chemokine gene transcription and
tumour growth. Nat Rev Immunol 2002, 2:664-674.
29. Li JJ, Westergaard C, Ghosh P, Colburn NH: Inhibitors of both
nuclear factor-kappaB and activator protein-1 activation
block the neoplastic transformation response. Cancer Res
1997, 57:3569-3576.
30. Hong SH, Ondrey FG, Avis IM, Chen Z, Loukinova E, Cavanaugh PF
Jr, Van Waes C, Mulshine JL: Cyclooxygenase regulates human
oropharyngeal carcinomas via the proinflammatory
cytokine IL-6: a general role for inflammation? Faseb J 2000,
14:1499-1507.
31. Grandis JR, Drenning SD, Zeng Q, Watkins SC, Melhem MF, Endo S,
Johnson DE, Huang L, He Y, Kim JD: Constitutive activation of
Stat3 signaling abrogates apoptosis in squamous cell car-
cinogenesis in vivo. Proc Natl Acad Sci USA 2000, 97:4227-4232.
32. Song JI, Grandis JR: STAT signaling in head and neck cancer.
Oncogene 2000, 19:2489-2495.
33. Lee TL, Yeh J, Van Waes C, Chen Z: Epigenetic modification of
SOCS-1 differentially regulates STAT3 activation in
response to interleukin-6 receptor and epidermal growth
factor receptor signaling through JAK and/or MEK in head
and neck squamous cell carcinomas. Mol Cancer Ther 2006,
5:8-19.
34. Gerdes MJ, Myakishev M, Frost NA, Rishi V, Moitra J, Acharya A, Levy
MR, Park SW, Glick A, Yuspa SH, et al.:
Activator protein-1 activ-
ity regulates epithelial tumor cell identity. Cancer Res 2006,
66:7578-7588.
35. Cao XM, Koski RA, Gashler A, McKiernan M, Morris CF, Gaffney R,
Hay RV, Sukhatme VP: Identification and characterization of
the Egr-1 gene product, a DNA-binding zinc finger protein
induced by differentiation and growth signals. Mol Cell Biol
1990, 10:1931-1939.
36. Worden B, Yang XP, Lee TL, Bagain L, Yeh NT, Cohen JG, Van Waes
C, Chen Z: Hepatocyte growth factor/scatter factor differen-
tially regulates expression of proangiogenic factors through
Egr-1 in head and neck squamous cell carcinoma. Cancer Res
2005, 65:7071-7080.
37. Dong G, Loukinova E, Chen Z, Gangi L, Chanturita TI, Liu ET, Van
Waes C: Molecular profiling of transformed and metastatic
murine squamous carcinoma cells by differential display and
cDNA microarray reveals altered expression of multiple
genes related to growth, apoptosis, angiogenesis, and the
NF-kappaB signal pathway. Cancer Res 2001, 61:4797-4808.
38. Loercher A, Lee TL, Ricker JL, Howard A, Geoghegen J, Chen Z, Sun-
woo JB, Sitcheran R, Chuang EY, Mitchell JB, et al.: Nuclear factor-
kappaB is an important modulator of the altered gene
expression profile and malignant phenotype in squamous
cell carcinoma. Cancer Res 2004, 64:6511-6523.
39. Zhang MQ: Large-scale gene expression data analysis: a new
challenge to computational biologists. Genome Res 1999,
9:681-688.
40. Brazma A, Vilo J: Gene expression data analysis. FEBS Lett 2000,
480:17-24.
41. Bradford CR, Zhu S, Ogawa H, Ogawa T, Ubell M, Narayan A, John-
son G, Wolf GT, Fisher SG, Carey TE: P53 mutation correlates
with cisplatin sensitivity in head and neck squamous cell car-
cinoma lines. Head Neck 2003, 25:654-661.
42. Chen Z, Colon I, Ortiz N, Callister M, Dong G, Pegram MY, Arosa-
rena O, Strome S, Nicholson JC, Van Waes C: Effects of inter-
leukin-1alpha, interleukin-1 receptor antagonist, and
neutralizing antibody on proinflammatory cytokine expres-
sion by human squamous cell carcinoma lines. Cancer Res
1998, 58:3668-3676.
43. Kato T, Duffey DC, Ondrey FG, Dong G, Chen Z, Cook JA, Mitchell
JB, Van Waes C: Cisplatin and radiation sensitivity in human
head and neck squamous carcinomas are independently
modulated by glutathione and transcription factor NF-kap-
paB. Head Neck 2000, 22:748-759.
44. Lee TL, Yang X, Yan B, Freidman J, Duggal P, Bagain L, Geoghegan J,
Dong G, Yeh TN, Wang J, et al.: A novel NF-kappaB gene signa-
ture is differentially expressed in head and neck squamous
cell carcinomas in association with TP53 status. Clin Cancer
Res 2007 in press.
45. Simon R, Lam A, Li M, Ngan M, Menenzes M, Zhao Y: Analysis of
gene expression data using BRB-Array Tools. Cancer
Informatics 2007, 2:11-17.
46. Draghici S, Khatri P, Martins RP, Ostermeier GC, Krawetz SA: Glo-
bal functional profiling of gene expression. Genomics 2003,
81:98-104.
47. Loukinova E, Chen Z, Van Waes C, Dong G: Expression of proan-
giogenic chemokine Gro 1 in low and high metastatic vari-
ants of Pam murine squamous cell carcinoma is differentially
regulated by IL-1alpha, EGF and TGF-beta1 through NF-
kappaB dependent and independent mechanisms. Int J Cancer
2001, 94:637-644.
48. Dong G, Chen Z, Li ZY, Yeh NT, Bancroft CC, Van Waes C: Hepa-
tocyte growth factor/scatter factor-induced activation of
MEK and PI3K signal pathways contributes to expression of
proangiogenic cytokines interleukin-8 and vascular endothe-
lial growth factor in head and neck squamous cell carcinoma.
Cancer Res 2001, 61:5911-5918.
49. Bancroft CC, Chen Z, Dong G, Sunwoo JB, Yeh N, Park C, Van Waes
C: Coexpression of proangiogenic factors IL-8 and VEGF by
human head and neck squamous cell carcinoma involves
coactivation by MEK-MAPK and IKK-NF-kappaB signal
pathways. Clin Cancer Res 2001, 7:435-442.
50. Baron V, Adamson ED, Calogero A, Ragona G, Mercola D: The tran-
scription factor Egr1 is a direct regulator of multiple tumor
suppressors including TGFbeta1, PTEN, p53, and
fibronectin. Cancer Gene Ther 2006, 13:115-124.
51. el-Deiry WS: Regulation of p53 downstream genes. Semin Can-
cer Biol 1998, 8:
345-357.
52. Somasundaram K: Tumor suppressor p53: regulation and
function. Front Biosci 2000, 5:D424-D437.
53. Liu HS, Pan CE, Liu QG, Yang W, Liu XM: Effect of NF-kappaB and
p38 MAPK in activated monocytes/macrophages on pro-
inflammatory cytokines of rats with acute pancreatitis. World
J Gastroenterol 2003, 9:2513-2518.
54. Morgenstern B, Frech K, Dress A, Werner T: DIALIGN: finding
local similarities by multiple sequence alignment. Bioinformat-
ics 1998, 14:290-294.
55. Werner T, Fessele S, Maier H, Nelson PJ: Computer modeling of
promoter organization as a tool to study transcriptional
coregulation. Faseb J 2003, 17:1228-1237.
56. Hunter KD, Parkinson EK, Harrison PR: Profiling early head and
neck cancer. Nat Rev Cancer 2005, 5:127-135.
57. Webster GA, Perkins ND: Transcriptional cross talk between
NF-kappaB and p53. Mol Cell Biol 1999, 19:3485-3495.
58. Rocha S, Martin AM, Meek DW, Perkins ND: p53 represses cyclin
D1 transcription through down regulation of Bcl-3 and
inducing increased association of the p52 NF-kappaB subunit
with histone deacetylase 1. Mol Cell Biol 2003, 23:4713-4727.
59. Rocha S, Garrett MD, Campbell KJ, Schumm K, Perkins ND: Regu-
lation of NF-kappaB and p53 through activation of ATR and
Chk1 by the ARF tumour suppressor. Embo J 2005,
24:1157-1169.
60. Raman V, Martensen SA, Reisman D, Evron E, Odenwald WF, Jaffee
E, Marks J, Sukumar S: Compromised HOXA5 function can
limit p53 expression in human breast tumours. Nature 2000,
405:974-978.
61. Kang JH, Kim SJ, Noh DY, Park IA, Choe KJ, Yoo OJ, Kang HS: Meth-
ylation in the p53 promoter is a supplementary route to
breast carcinogenesis: correlation between CpG methyla-
tion in the p53 promoter and the mutation of the p53 gene
in the progression from ductal carcinoma in situ to invasive
ductal carcinoma. Lab Invest 2001,
81:573-579.
62. Rocco JW, Leong CO, Kuperwasser N, DeYoung MP, Ellisen LW:
p63 mediates survival in squamous cell carcinoma by sup-
pression of p73-dependent apoptosis. Cancer Cell 2006, 9:45-56.
63. Luger K, Rechsteiner TJ, Flaus AJ, Waye MM, Richmond TJ: Charac-
terization of nucleosome core particles containing histone
proteins made in bacteria. J Mol Biol 1997, 272:301-311.
64. Bassing CH, Chua KF, Sekiguchi J, Suh H, Whitlow SR, Fleming JC,
Monroe BC, Ciccone DN, Yan C, Vlasakova K, et al.: Increased ion-
izing radiation sensitivity and genomic instability in the
absence of histone H2AX. Proc Natl Acad Sci USA 2002,
R78.24 Genome Biology 2007, Volume 8, Issue 5, Article R78 Yan et al. />Genome Biology 2007, 8:R78
99:8173-8178.
65. Martini EM, Keeney S, Osley MA: A role for histone H2B during
repair of UV-induced DNA damage in Saccharomyces
cerevisiae. Genetics 2002, 160:1375-1387.
66. Zhang Y: Transcriptional regulation by histone ubiquitination
and deubiquitination. Genes Dev 2003, 17:2733-2740.
67. Minsky N, Oren M: The RING domain of Mdm2 mediates his-
tone ubiquitylation and transcriptional repression. Mol Cell
2004, 16:631-639.
68. Yu X, Caltagarone J, Smith MA, Bowser R: DNA damage induces
cdk2 protein levels and histone H2B phosphorylation in SH-
SY5Y neuroblastoma cells. J Alzheimers Dis 2005, 8:7-21.
69. Espinosa JM, Emerson BM: Transcriptional regulation by p53
through intrinsic DNA/chromatin binding and site-directed
cofactor recruitment. Mol Cell 2001, 8:57-69.
70. Chen Z, Malhotra PS, Thomas GR, Ondrey FG, Duffey DC, Smith
CW, Enamorado I, Yeh NT, Kroog GS, Rudy S, et al.: Expression of
proinflammatory and proangiogenic cytokines in patients
with head and neck cancer. Clin Cancer Res 1999, 5:1369-1379.
71. Chung CH, Parker JS, Ely K, Carter J, Yi Y, Murphy BA, Ang KK, El-
Naggar AK, Zanation AM, Cmelak AJ, et al.: Gene expression pro-
files identify epithelial-to-mesenchymal transition and acti-
vation of nuclear factor-{kappa}b signaling as characteristics
of a high-risk head and neck squamous cell carcinoma. Cancer
Res 2006, 66:8210-8218.
72. Welty SE, Rivera JL, Elliston JF, Smith CV, Zeb T, Ballantyne CM,
Montgomery CA, Hansen TN: Increases in lung tissue expres-
sion of intercellular adhesion molecule-1 are associated with
hyperoxic lung injury and inflammation in mice. Am J Respir
Cell Mol Biol 1993, 9:393-400.
73. Colletti LM, Cortis A, Lukacs N, Kunkel SL, Green M, Strieter RM:
Tumor necrosis factor up-regulates intercellular adhesion
molecule 1, which is important in the neutrophil-dependent
lung and liver injury associated with hepatic ischemia and
reperfusion in the rat. Shock 1998, 10:182-191.
74. Kacimi R, Karliner JS, Koudssi F, Long CS: Expression and regula-
tion of adhesion molecules in cardiac cells by cytokines:
response to acute hypoxia. Circ Res 1998, 82:576-586.
75. Stanciu LA, Djukanovic R: The role of ICAM-1 on T-cells in the
pathogenesis of asthma. Eur Respir J 1998, 11:949-957.
76. Bavendiek U, Libby P, Kilbride M, Reynolds R, Mackman N, Schonbeck
U: Induction of tissue factor expression in human endothelial
cells by CD40 ligand is mediated via activator protein 1,
nuclear factor kappa B, and Egr-1. J Biol Chem 2002,
277:25032-25039.
77. Thyss R, Virolle V, Imbert V, Peyron JF, Aberdam D, Virolle T: NF-
kappaB/Egr-1/Gadd45 are sequentially activated upon UVB
irradiation to mediate epidermal cell death. Embo J 2005,
24:128-137.
78. Squarize CH, Castilho RM, Sriuranpong V, Pinto DS Jr, Gutkind JS:
Molecular cross-talk between the NFkappaB and STAT3 sig-
naling pathways in head and neck squamous cell carcinoma.
Neoplasia 2006, 8:733-746.
79. Yang J, Liao X, Agarwal MK, Barnes L, Auron PE, Stark GR: Unphos-
phorylated STAT3 accumulates in response to IL-6 and acti-
vates transcription by binding to NF{kappa}B. Genes Dev 2007,
21:1396-1408.
80. Dong G, Lee TL, Yeh NT, Geoghegan J, Van Waes C, Chen Z: Met-
astatic squamous cell carcinoma cells that overexpress c-
Met exhibit enhanced angiogenesis factor expression, scat-
tering and metastasis in response to hepatocyte growth
factor. Oncogene 2004, 23:6199-6208.
81. Gumucio DL, Heilstedt-Williamson H, Gray TA, Tarle SA, Shelton
DA, Tagle DA, Slightom JL, Goodman M, Collins FS: Phylogenetic
footprinting reveals a nuclear protein which binds to silencer
sequences in the human gamma and epsilon globin genes.
Mol Cell Biol 1992,
12:4919-4929.
82. Zhang Z, Gerstein M: Of mice and men: phylogenetic footprint-
ing aids the discovery of regulatory elements. J Biol 2003, 2:11.
83. Zhang YF, Homer C, Edwards SJ, Hananeia L, Lasham A, Royds J,
Sheard P, Braithwaite AW: Nuclear localization of Y-box factor
YB1 requires wild-type p53. Oncogene 2003, 22:2782-2794.
84. Sinha S, Kim IS, Sohn KY, de Crombrugghe B, Maity SN: Three
classes of mutations in the A subunit of the CCAAT-binding
factor CBF delineate functional domains involved in the
three-step assembly of the CBF-DNA complex. Mol Cell Biol
1996, 16:328-337.
85. Maity SN, de Crombrugghe B: Role of the CCAAT-binding pro-
tein CBF/NF-Y in transcription. Trends Biochem Sci 1998,
23:174-178.
86. Mantovani R: The molecular biology of the CCAAT-binding
factor NF-Y. Gene 1999, 239:15-27.
87. Kim IS, Sinha S, de Crombrugghe B, Maity SN: Determination of
functional domains in the C subunit of the CCAAT-binding
factor (CBF) necessary for formation of a CBF-DNA com-
plex: CBF-B interacts simultaneously with both the CBF-A
and CBF-C subunits to form a heterotrimeric CBF molecule.
Mol Cell Biol 1996, 16:4003-4013.
88. Sinha S, Maity SN, Lu J, de Crombrugghe B: Recombinant rat CBF-
C, the third subunit of CBF/NFY, allows formation of a pro-
tein-DNA complex with CBF-A and CBF-B and with yeast
HAP2 and HAP3. Proc Natl Acad Sci USA 1995, 92:1624-1628.
89. Romier C, Cocchiarella F, Mantovani R, Moras D: The NF-YB/NF-
YC structure gives insight into DNA binding and transcrip-
tion regulation by CCAAT factor NF-Y. J Biol Chem 2003,
278:1336-1345.
90. Imbriano C, Gurtner A, Cocchiarella F, Di Agostino S, Basile V, Gos-
tissa M, Dobbelstein M, Del Sal G, Piaggio G, Mantovani R: Direct
p53 transcriptional repression: in vivo analysis of CCAAT-
containing G2/M promoters. Mol Cell Biol 2005, 25:3737-3751.
91. Oikawa T: ETS transcription factors: possible targets for can-
cer therapy. Cancer Sci 2004, 95:626-633.
92. Bassuk AG, Anandappa RT, Leiden JM:
Physical interactions
between Ets and NF-kappaB/NFAT proteins play an impor-
tant role in their cooperative activation of the human immu-
nodeficiency virus enhancer in T cells. J Virol 1997,
71:3563-3573.
93. Graves BJ, Petersen JM: Specificity within the ets family of tran-
scription factors. Adv Cancer Res 1998, 75:1-55.
94. Oikawa T, Yamada T: Molecular biology of the Ets family of
transcription factors. Gene 2003, 303:11-34.
95. Bai L, Logsdon C, Merchant JL: Regulation of epithelial cell
growth by ZBP-89: potential relevance in pancreatic cancer.
Int J Gastrointest Cancer 2002, 31:79-88.
96. Bai L, Merchant JL: ZBP-89 promotes growth arrest through
stabilization of p53. Mol Cell Biol 2001, 21:4670-4683.
97. Remington MC, Tarle SA, Simon B, Merchant JL: ZBP-89, a Krup-
pel-type zinc finger protein, inhibits cell proliferation. Bio-
chem Biophys Res Commun 1997, 237:230-234.
98. Borghaei RC, Rawlings PL Jr, Javadi M, Woloshin J: NF-kappaB
binds to a polymorphic repressor element in the MMP-3
promoter. Biochem Biophys Res Commun 2004, 316:182-188.
99. Keates AC, Keates S, Kwon JH, Arseneau KO, Law DJ, Bai L, Mer-
chant JL, Wang TC, Kelly CP: ZBP-89, Sp1, and nuclear factor-
kappa B regulate epithelial neutrophil-activating peptide-78
gene expression in Caco-2 human colonic epithelial cells. J
Biol Chem 2001, 276:43713-43722.
100. Chen Z, Lee TL, Yang XP, Dong G, Loercher A, Van Waes C: cDNA
microarray and bioinformatic analysis of nuclear factor-kap-
paB related genes in squamous cell carcinoma. In Cancer
Genomics and Proteomics: Methods and Protocols Volume 383. Edited by:
Fisher PD. Totowa, NJ: Humana Press; 2007.
101. Eisen MB, Spellman PT, Brown PO, Botstein D: Cluster analysis
and display of genome-wide expression patterns. Proc Natl
Acad Sci USA 1998, 95:14863-14868.
102. Stanford software: Significant Analysis of Microarray
[http:/
/www-stat.stanford.edu/~tibs/SAM/]
103. Saldanha AJ: Java Treeview: extensible visualization of micro-
array data. Bioinformatics 2004, 20:3246-3248.
104. Tempelman RJ: Assessing statistical precision, power, and
robustness of alternative experimental designs for two color
microarray platforms based on mixed effects models. Vet
Immunol Immunopathol 2005, 105:175-186.
105. Wolfinger RD, Gibson G, Wolfinger ED, Bennett L, Hamadeh H,
Bushel P, Afshari C, Paules RS: Assessing gene significance from
cDNA microarray expression data via mixed models. J Com-
put Biol 2001, 8:625-637.
106. Gene Ontology: database []
107. National Center for Biotechnology Information [http://
www.ncbi.nlm.nih.gov]
108. Genomatix Software GmbH []
109. Hoh J, Jin S, Parrado T, Edington J, Levine AJ, Ott J: The p53MH
algorithm and its application in detecting p53-responsive
genes. Proc Natl Acad Sci USA 2002, 99:8467-8472.
110. Bajic VB, Tan SL, Chong A, Tang S, Strom A, Gustafsson JA, Lin CY,
Liu ET: Dragon ERE Finder version 2: A tool for accurate
Genome Biology 2007, Volume 8, Issue 5, Article R78 Yan et al. R78.25
comment reviews reports refereed researchdeposited research interactions information
Genome Biology 2007, 8:R78
detection and analysis of estrogen response elements in ver-
tebrate genomes. Nucleic Acids Res 2003, 31:3605-3607.
111. Benos PV, Lapedes AS, Stormo GD: Probabilistic code for DNA
recognition by proteins of the EGR family. J Mol Biol 2002,
323:701-727.
112. Cartharius K, Frech K, Grote K, Klocke B, Haltmeier M, Klingenhoff
A, Frisch M, Bayerlein M, Werner T: MatInspector and beyond:
promoter analysis based on transcription factor binding
sites. Bioinformatics 2005, 21:2933-2942.
113. Quandt K, Frech K, Karas H, Wingender E, Werner T: MatInd and
MatInspector: new fast and versatile tools for detection of
consensus matches in nucleotide sequence data. Nucleic Acids
Res 1995, 23:4878-4884.
114. Hughes JD, Estep PW, Tavazoie S, Church GM: Computational
identification of cis-regulatory elements associated with
groups of functionally related genes in Saccharomyces
cerevisiae. J Mol Biol 2000, 296:1205-1214.
115. Werner T: Promoters can contribute to the elucidation of
protein function. Trends Biotechnol 2003, 21:9-13.
116. Dohr S, Klingenhoff A, Maier H, Hrabe de Angelis M, Werner T, Sch-
neider R: Linking disease-associated genes to regulatory net-
works via promoter organization. Nucleic Acids Res 2005,
33:864-872.