Báo cáo y học: " School of Computer Science and Engineering, Hebrew University" pot
Bạn đang xem bản rút gọn của tài liệu. Xem và tải ngay bản đầy đủ của tài liệu tại đây (1.71 MB, 17 trang )
Genome Biology 2007, 8:R108
comment reviews reports deposited research refereed research interactions information
Open Access
2007Fagnaniet al.Volume 8, Issue 6, Article R108
Research
Functional coordination of alternative splicing in the mammalian
central nervous system
Matthew Fagnani
¤
*†
, Yoseph Barash
¤
*‡
, Joanna Y Ip
*†
, Christine Misquitta
*
,
Qun Pan
*
, Arneet L Saltzman
*†
, Ofer Shai
‡
, Leo Lee
‡
, Aviad Rozenhek
§
,
Naveed Mohammad
†
, Sandrine Willaime-Morawek
†
, Tomas Babak
*†
,
Wen Zhang
*†
, Timothy R Hughes
*†
, Derek van der Kooy
†
, Brendan J Frey
*‡
and Benjamin J Blencowe
*†
Addresses:
*
Banting and Best Department of Medical Research, Centre for Cellular and Biomolecular Research, University of Toronto, 160
College Street, Toronto, Ontario, Canada. M5S 3E1.
†
Department of Molecular and Medical Genetics, Centre for Cellular and Biomolecular
Research, University of Toronto, 160 College Street, Toronto, Ontario, Canada. M5S 3E1.
‡
Department of Electrical and Computer Engineering,
University of Toronto, 40 St. George's Street, Toronto, Ontario, Canada.
§
School of Computer Science and Engineering, Hebrew University,
Jerusalem 91904, Israel.
¤ These authors contributed equally to this work.
Correspondence: Brendan J Frey. Email: Benjamin J Blencowe. Email:
© 2007 Fagnani et al.; licensee BioMed Central Ltd.
This is an open access article distributed under the terms of the Creative Commons Attribution License ( which
permits unrestricted use, distribution, and reproduction in any medium, provided the original work is properly cited.
Alternative splicing in the central nervous system<p>A microarray analysis provides new evidence suggesting that specific cellular processes in the mammalian CNS are coordinated at the level of alternative splicing, and that a complex splicing code underlies CNS-specific alternative splicing regulation.</p>
Abstract
Background: Alternative splicing (AS) functions to expand proteomic complexity and plays
numerous important roles in gene regulation. However, the extent to which AS coordinates
functions in a cell and tissue type specific manner is not known. Moreover, the sequence code that
underlies cell and tissue type specific regulation of AS is poorly understood.
Results: Using quantitative AS microarray profiling, we have identified a large number of widely
expressed mouse genes that contain single or coordinated pairs of alternative exons that are
spliced in a tissue regulated fashion. The majority of these AS events display differential regulation
in central nervous system (CNS) tissues. Approximately half of the corresponding genes have
neural specific functions and operate in common processes and interconnected pathways.
Differential regulation of AS in the CNS tissues correlates strongly with a set of mostly new motifs
that are predominantly located in the intron and constitutive exon sequences neighboring CNS-
regulated alternative exons. Different subsets of these motifs are correlated with either increased
inclusion or increased exclusion of alternative exons in CNS tissues, relative to the other profiled
tissues.
Conclusion: Our findings provide new evidence that specific cellular processes in the mammalian
CNS are coordinated at the level of AS, and that a complex splicing code underlies CNS specific
AS regulation. This code appears to comprise many new motifs, some of which are located in the
constitutive exons neighboring regulated alternative exons. These data provide a basis for
understanding the molecular mechanisms by which the tissue specific functions of widely expressed
genes are coordinated at the level of AS.
Published: 12 June 2007
Genome Biology 2007, 8:R108 (doi:10.1186/gb-2007-8-6-r108)
Received: 18 October 2006
Revised: 22 January 2007
Accepted: 12 June 2007
The electronic version of this article is the complete one and can be
found online at />R108.2 Genome Biology 2007, Volume 8, Issue 6, Article R108 Fagnani et al. />Genome Biology 2007, 8:R108
Background
Alternative splicing (AS) is the process by which the exon
sequences of primary transcripts are differentially included in
mature mRNA, and it represents an important mechanism
underlying the regulation and diversification of gene function
[1-4]. Comparisons of data from transcript sequencing efforts
and microarray profiling experiments have provided evi-
dence that AS is more frequent in organisms with increased
cellular and functional specialization [4-6]. It is estimated
that more than 66% of mouse and human genes contain one
or more alternative exons [7]. Moreover, transcripts
expressed in organs consisting of large numbers of special-
ized cell types and activities, such as the mammalian brain,
are known to undergo relatively frequent AS [8,9].
The extent to which AS events in different cell and tissue types
are regulated in a coordinated fashion to control specific cel-
lular functions and processes is not known. Evidence for
coordination of cellular functions by AS was recently pro-
vided by a study that employed a custom microarray to profile
AS in mouse tissues. It was shown that deletion of the mouse
gene that encodes Nova-2 (a neural specific AS factor) prima-
rily affects AS events associated with genes encoding proteins
that function in the synapse and in axon guidance [10]. In the
absence of Nova-2, about 7% of AS events were detected to
undergo differential inclusion levels between brain and thy-
mus tissues [10], suggesting that additional neural specific AS
events, and alternative exons specifically regulated in other
tissues, might also be under coordinated control by specific
splicing factors. The idea that AS coordinates the activities of
functionally related genes is also supported by the results of
studies on the Drosophila AS factor Transformer-2 (Tra2).
Binding of Tra2 to a specialized exonic splicing enhancer ele-
ment regulates the AS of transcripts encoding the transcrip-
tion factors Doublesex and Fruitless, which activate sets of
genes that are involved in sex determination and courtship
behavior, respectively [11,12].
Current evidence indicates that tissue specific AS events may
be regulated in some cases by different combinations of
widely expressed factors and in other cases by cell/tissue spe-
cific factors [1,13,14]. In addition to the Nova AS regulators
(Nova-1/2), several other proteins have been shown to partic-
ipate in differential regulation of AS in the nervous system.
These proteins include nPTB/BrPTB (a neural enriched para-
log of the widely expressed polypyrimidine tract binding pro-
tein) and members of the CELF/Bruno-like, Elav, Fox, and
Muscleblind families of RNA binding proteins, which can also
regulate AS in other tissues [13-17]. Proteins that are known
to be involved in tissue specific regulation of AS tend to rec-
ognize relatively short (typically five to ten nucleotides)
sequences that are located in or proximal to regulated alter-
native exons. The binding of cell/tissue specific factors to
these cis-acting elements is known to affect splice site choice
by a variety of specific mechanisms that generally result in the
promotion or disruption of interactions that are required for
the recruitment of core splicing components during early
stages of spliceosome formation [1,13,14].
In several cases, cis-acting sequences bound by AS regulators
were initially identified by deletion and mutagenesis studies
employing model pre-mRNA reporter constructs, in conjunc-
tion with in vitro or transfection based assays that recapitu-
late cell or tissue specific AS patterns [18]. In other studies,
sequence motifs recognized by AS factors were identified by
SELEX (systematic evolution of ligands by exponential
enrichment) based methods and/or cross-linking/mapping
approaches [19,20]. However, only a small number of physi-
ologically relevant target AS events are known for most of the
previously defined splicing factors, and systematic
approaches to linking tissue regulated AS events with rele-
vant cis-acting control sequences and cognate regulatory fac-
tors have only just been attempted [21,22]. Such studies will
be important for defining the nature of the 'code' that under-
lies the regulation and coordination of cell and tissue type
specific AS events.
In the present study, we used a new microarray to profile AS
levels for thousands of cassette type alternative exons
(namely, exons that are flanked by intron sequences and that
are skipped or included in the final message) across a diverse
spectrum of mouse tissues. Analyses of these data resulted in
the identification of genes with single or multiple alternative
exons that display tissue correlated AS levels and the discov-
ery of many new central nervous system (CNS) associated AS
events that are enriched in functionally related genes. A com-
putational search also led to the identification of cis-acting
motifs, many of which are new, that correlate strongly with
CNS associated regulation of AS. Unexpectedly, many of
these new motifs are located in neighboring constitutive
exons and adjacent intron sequences. Together, our results
suggest a widespread role for tissue coordinated AS events
and associated cis-acting regulatory elements in controlling
important functions in the mouse CNS.
Results and discussion
Using a new AS microarray, we generated quantitative profil-
ing data for 3,707 cassette-type AS events in 27 diverse mouse
cells and tissues. These AS events were mined from expressed
sequence tag (EST) and cDNA sequences represented by
3,044 UniGene clusters (see Materials and methods, below).
The profiled tissues included whole brain, five brain subre-
gions, spinal cord, three embryonic stages, embryonic stem
cells, three muscle-based tissues (skeletal muscle, heart, and
tongue), gastrointestinal and reproductive tissues, and sev-
eral additional adult tissues. Quantitative, confidence-ranked
estimates for percentage exclusion ('skipping') levels of each
alternative exon were determined using the computational
analysis tool GenASAP (Generative Model for the Alternative
Splicing Array Platform) [23,24]. Confirming our previous
findings [23,25], GenASAP percentage exon exclusion values
Genome Biology 2007, Volume 8, Issue 6, Article R108 Fagnani et al. R108.3
comment reviews reports refereed researchdeposited research interactions information
Genome Biology 2007, 8:R108
ranking in the top one-third portion of the data correlated
well (Pearson correlation coefficient > 0.80), with reverse
transcription polymerase chain reaction (RT-PCR) measure-
ments (see below and Additional data file 1 [Figures 1 and 2]).
In the present study, we used our dataset to detect alternative
exons that display inclusion level differences specific to
groups of physiologically related tissues, as compared with all
other tissues. We also considered whether pairs of alternative
exons belonging to the same genes have coordinated inclu-
sion levels across the profiled tissues. From these analyses,
we investigated which AS events may be coordinated func-
tionally and potentially form AS-regulated networks, and
which sequence elements in transcripts are likely to play a
role in the regulation of functionally coordinated AS events.
Tissue-specific regulation of AS in non-CNS tissues
AS events specific to groups of related tissues were initially
analyzed. The use of the term 'specific' in this context, and
below, refers to the detection of a statistically significant AS
level difference in a group of tissues, relative to all of the other
profiled tissues (see Additional data file 1 [Materials and
methods] for details). We observed that about ten alternative
exons displayed inclusion level differences in embryonic stem
cells and the three whole embryo samples representing differ-
ent stages of development, relative to the other profiled tis-
sues. In addition, about ten alternative exons displayed
pronounced inclusion level differences in the three muscle-
based tissues (heart, skeletal muscle, and tongue), and five
alternative exons displayed AS patterns common to both CNS
and muscle tissues. Interestingly, some of the genes display-
ing AS differences in embryonic stem cells and embryonic
samples are associated with regulation of development, and
several of the genes with differential AS levels in muscle-
based tissues are associated with muscle specific functions.
These and other non-CNS-regulated AS events are described
in Additional data file 1 and are listed in Additional data file
2. These findings suggest that AS could play an important role
in coordinating gene functions in a tissue specific manner,
although a larger set of tissue specific AS events is required to
test this hypothesis.
Regulation of alternative splicing in mouse CNS tissues
The largest numbers of tissue dependent AS events detected
in our microarray data were associated with CNS tissues, with
about 110 events displaying specific AS level differences (Fig-
ure 1a). This observation is consistent with previous reports
providing evidence that AS is relatively frequent in the nerv-
ous system (see Introduction, above). Genes with these CNS
tissue specific AS events were selected based on an analysis
that controls for covariations in transcript levels in these tis-
sues (see Additional data file 1). Approximately 35 additional
CNS specific AS events were detected in genes that also dis-
played significant covariations at the transcript level across
the tissues. These covariations could reflect effects on AS lev-
els caused by co-transcriptional coupling [26] or independent
CNS tissue dependent regulation at the transcriptional and
splicing levels. However, we cannot exclude the possibility
that some of the additional CNS specific AS events are
detected as a consequence of measurement error resulting
from varying transcript levels.
The probable functional relevance of the majority of the 110
most significant CNS-associated AS events is underscored by
the observation that 60% of the alternative exons in this
group could be detected in aligned human EST and cDNA
sequences, whereas only about 24% of the non-CNS-associ-
ated alternative exons represented on the microarray could
be detected in both human and mouse cDNA/EST sequences.
This finding represents a statistically significant enrichment
of conserved cassette alternative exons with detected CNS-
associated AS levels, while controlling for variable cDNA/EST
counts (P < 1 × 10
-16
; see Additional data file 1).
Consistent with this observation, and with the results of pre-
vious reports [21,27], we found that intron sequences within
about 100 nucleotides of the CNS tissue regulated alternative
exons (where AS regulatory motifs are often found; see
below) more often overlap with the most conserved verte-
brate genomic regions [28], as compared with the overlap
observed for the corresponding intron sequences flanking
non CNS tissue regulated alternative exons (see Additional
data file 1; data not shown). For example, 50% of CNS specific
AS events versus 25% in other events have at least 25 of the
first 50 upstream intronic nucleotides located in these highly
conserved elements, and 25% of CNS specific AS events ver-
sus 10% of other events have the entire first 50 nucleotides of
the upstream intron covered by the conserved regions (Addi-
tional data file 1 [Figure 5]). A similar conservation level dis-
tribution was also observed in the 50 nucleotides downstream
of the alternative exons, although with a smaller (10% to 20%)
proportion of CNS-specific AS events versus non-CNS-spe-
cific AS events overlapping the most highly conserved regions
(Additional data file 1 [Figure 5]). The proportion of CNS
associated AS events that preserve reading frame in both iso-
forms is also significantly higher than observed for the other
profiled AS events (81% versus 44%; P = 7.95 × 10
-14
, by
Fisher's exact test). Only 8% of the CNS regulated exons have
the potential to introduce a premature termination codon
that could elicit nonsense mediated mRNA decay, in contrast
to about 37% of the other AS events (P = 2.6 × 10
-6
, by Fisher's
exact test). These results are consistent with recent findings
indicating that a relatively small proportion of conserved AS
events introduce premature termination codons [25,29], and
further indicate that AS-coupled nonsense mediated mRNA
decay is not a widespread mode of regulation of gene expres-
sion in the mammalian CNS. Taken together, our results thus
indicate that a relatively large fraction of CNS associated AS
events are under negative or purifying selection pressure to
conserve sequences required to produce alternatively spliced
forms; they are therefore likely to be functionally important.
R108.4 Genome Biology 2007, Volume 8, Issue 6, Article R108 Fagnani et al. />Genome Biology 2007, 8:R108
Figure 1 (see legend on next page)
-4.0 0.0 4.0
Relative transcript level
0 25 50 75 100
Percentage exon exclusion
CNS tissues
(a)
(b)
Genome Biology 2007, Volume 8, Issue 6, Article R108 Fagnani et al. R108.5
comment reviews reports refereed researchdeposited research interactions information
Genome Biology 2007, 8:R108
We also examined the potential impact of the CNS regulated
AS events at the protein level. The CNS associated AS events
have the potential to result in partial or complete domain dis-
ruption in 13% (4/31) of cases, whereas 34% (201/599) of the
non-CNS AS events represented on the arrays could result in
such a change (P = 0.017, by Fisher's exact test). This differ-
ence, although based on a small sample size, is consistent
with our observation that CNS regulated AS events are signif-
icantly enriched in conserved alternative exons, whereas AS
events with the potential to disrupt conserved protein coding
sequences are known to be significantly under-represented by
conserved alternative exons compared with species-specific
alternative exons [30]. In this regard, it is interesting to note
that the alternative exons regulated in a CNS-specific manner
are significantly shorter than the other profiled alternative
exons (median of 75 nucleotides versus 102 nucleotides; P =
4.6 × 10
-7
, by Wilcoxon-Mann-Whitney test), whereas the
alternative exons of AS events predicted to result in domain
disruption have longer median exon lengths than those that
are not predicted to result in domain disruption (116 nucle-
otides versus 99 nucleotides). Thus, the shorter alternative
exon lengths of the CNS specific AS events appear to account,
at least in part, for the lower proportion of predicted domain
disruptions resulting from this set of exons. Given that these
regulated exons are often conserved in human, it is interest-
ing to consider that they may contribute numerous important
roles, such as the formation and regulation of protein-protein
interactions associated with neural specific complexes and
pathways.
Remarkably, an extensive literature search revealed that 50
(40%) of the top 125 genes (ranked according to the signifi-
cance of the CNS associated AS level difference) have a
reported specific functional link with the nervous system.
Nervous system specific functions of genes containing CNS
regulated AS events are listed in Table 1, and a more detailed
description of the roles of some of these genes is provided in
Additional data files 2 and 3. Because about 20% of the genes
with CNS-regulated AS in our list have not been characterized
on any level or are poorly characterized, the proportion of
genes with specific functional roles in the nervous system is
likely to be considerably higher than 40%.
Consistent with the previous observation that about 7% of AS
events are differentially regulated between neocortex and
thymus by the AS regulator factor Nova-2 [10] (see Introduc-
tion, above), seven of the 110 CNS regulated AS events identi-
fied in our analysis are common to 50 neocortex regulated
events reported in this previous study. Moreover, 16 of the
CNS regulated AS events identified in our study overlap with
a set of brain specific alternative exons reported by Sugnet
and coworkers [21] in another microarray profiling study
involving mouse tissues. An additional 54 AS events reported
to be brain specific in this latter study also overlapped with AS
events represented by probes on our microarray. However,
our microarray data and analyses, as well as the RT-PCR
experiments in the present study and in that by Sugnet and
coworkers, do not provide support for more than a few of
these as being brain specific. In contrast, 17 out of 17 (100%)
of the CNS tissue specific AS events from our list of 110 were
subsequently confirmed by RT-PCR assays as having CNS tis-
sue specific splicing patterns (Figure 2; also see Additional
data file 1 [Figures 1 and 2]; data not shown). The results of
extensive literature searches (see Additional data file 1) fur-
ther indicate that approximately two-thirds or more of the
CNS associated AS events identified from our microarray data
either have not been reported, or if reported they were not
previously known to undergo nervous system specific AS (see
below).
Different contributions of alternative splicing and
transcriptional regulation in the mouse CNS
We then considered the extent to which the set of genes with
regulated neural specific AS events in our data overlap the set
of genes regulated in a neural specific manner at the tran-
scriptional level (the total level of the exon included and exon
excluded splice variants displaying significant CNS specific
changes). Using information provided by the microarray
probes targeting the constitutive exons flanking each
alternative exon, we identified about 200 genes that have
CNS associated changes at the transcript level, as represented
by statistically significant changes relative to most of the
other profiled tissues (see Additional data file 1 [Materials
and methods]). Consistent with previous findings indicating
that AS and transcript level regulation control different sub-
sets of genes in mammalian tissues [23,30,31], the majority
(about 80%) of the approximately 150 genes with the most
significant CNS associated AS levels do not overlap with the
approximately 200 genes regulated in a CNS specific manner
at the transcriptional level (Additional data file 1 [Figure 4]).
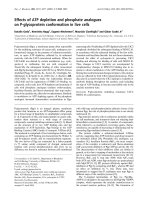
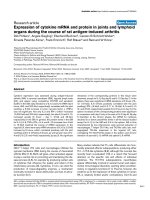
Identification of widely expressed genes with CNS specific regulation of ASFigure 1 (see previous page)
Identification of widely expressed genes with CNS specific regulation of AS. Microarray profiled genes with single or multiple alternative exons displaying
differential alternative splicing (AS) in the central nervous system (CNS) were identified using statistical procedures that control for covariation in
transcript levels (see Results and Materials and methods). (a) The top 100 genes with the most significant CNS associated AS levels are hierarchically
clustered on both axes, based on their overall AS level similarity across 27 profiled tissues. (b) The corresponding transcript levels of the same genes,
displayed in the same order. Color scales representing AS levels (percentage exon exclusion) and transcript levels (z-score scale) are shown below each
panel. The z-score represents the number of standard deviations from the mean transcript level (center of the scale, in black) of the given event.
Increasingly bright yellow represents lower transcript levels, and increasingly bright blue represents higher transcript levels. White rectangles in the AS
clustergram indicate removed GenASAP (Generative Model for the Alternative Splicing Array Platform) values. These values were removed when
transcript levels from the same genes (as measured using probes specific for constitutive exons on the microarray) were below the 95th percentile of the
negative control probes.
R108.6 Genome Biology 2007, Volume 8, Issue 6, Article R108 Fagnani et al. />Genome Biology 2007, 8:R108
Table 1
List of genes with CNS tissue-specific AS regulation
Category Gene name Accession CNS function/phenotype
Signaling Arhgef7 AF247655 Synapse formation
Camk2d BC042895 Phosphorylates PSD-95 in postsynaptic density
Camk2g BU560927 Phosphorylates PSD-95 in postsynaptic density
Git2 BU614137 Postsynaptic density interactions
Map4k6 BC011346 Axon guidance
Map3k4 AK122219 Neural tube development
Opa1 AK050383 Neuropathy
Plcb4 BC051068 Metabotropic glutamate neurotransmitter signaling pathway, synaptic depression
Ptprf AF300943 Synapse formation
Ptprk L10106 Neurite outgrowth
Rapgef6 BC019702 Neurogenesis, gliogenesis
Rap1ga1 BY234371 Neurite outgrowth
Vav2 U37017 Neurite outgrowth
Cytoskeleton Ablim1 AK122196 Axon guidance
Clasp1 CA326660 Axon guidance
Dst AK037206 Neurodegeneration, myelination, retrograde axonal transport
Kifap3 D50367 Axonal vesicle transport
Myo5a CA469310 Synaptic vesicle transport
Myo6 U49739 Neurotransmitter endocytosis
Syne1 BC041779 Synaptic nuclear envelope anchor at neuromuscular junction
Tmod2 AU035865 Learning/memory, long-term potentiation
Vesicular transport Dlgh4 D50621 Synaptic vesicle maturation
Dnm1 BC034679 Synaptic vesicle endocytosis
Exoc7 AF014461 Neurotransmitter receptor membrane targeting
Rab6ip2 AF340029 Neurotransmitter release
Snap23 AA450833 Neurotransmitter exocytosis
Sgip1 BC017596 Neural energy balance regulation
Syngr1 AK010442 Synaptic vesicle component
mRNA processing Adarb1 AF525421 Glutamate receptor mRNA editing
Papola NM_011112 Regulated polyadenylation at synapses
Transcription factors Apbb1 BM950527 Learning/memory, Alzheimer's disease
Nfatc3 BC021835 Axon outgrowth, neuronal survival, astrocyte function
Tcf12 X64840 Transcription factor involved in neuronal plasticity, CNS development
Tight junctions Baiap1 AK032350 Nervous system signaling
Magi3/6530407C02Rik AF213258 CNS signaling, neurotransmitter receptor regulation
Tjp4 BU612515 Interacts with synaptic protein
Ion channels P2rx4 AF089751 Neurotransmitter receptor
Slc24a2 NM_172426 Calcium ion channel in axon terminals
Other functions Agrn BG803812 Regulates formation of postsynaptic structure at the neuromuscular junction
Kidins220/C330002I19Rik AK083260 Neural signaling
Mgea6 BI962144 Meningioma antigen
Mgrn1
BY567496 Neuronal degradation, astrocytosis
Neo1 Y09535 Axon guidance, neuronal survival
NIBP/1810044A24Rik BC034590 Neurite outgrowth, nerve growth factor signaling
Pcmt1 AA981003 Memory, synaptic function, seizures
Sca2 AF041472 Neurodegenerative disease spinocerebellar ataxia
Serpinh1 BB613516 Glial cell protection, CNS development
Microarray-profiled genes displaying central nervous system (CNS) tissue specific alternative splicing regulation are listed, along with a description of known functions of the
genes in the nervous system. More detailed information on the same gene list, including published information on the CNS tissue regulated exons and relevant literature, is
provided in Additional data file 3.
Genome Biology 2007, Volume 8, Issue 6, Article R108 Fagnani et al. R108.7
comment reviews reports refereed researchdeposited research interactions information
Genome Biology 2007, 8:R108
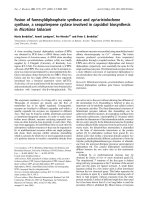
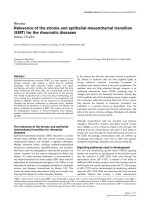
Coordination between AS events belonging to the same genesFigure 2
Coordination between AS events belonging to the same genes. (a) The correlation between the alternative splicing (AS) levels of pairs of alternative exons
belonging to the same genes was assessed using standard Spearman correlation. The cumulative distribution plot shows the number of exon pairs (y-axis)
observed to have an absolute value standard Spearman correlation higher than the value given on the x-axis. The blue curve with closed circles represents
the number of observed exon pairs from the same gene above a given correlation threshold. The red curve with open circles is the average number of
random pairs above a given correlation threshold, as determined using permutation resampling analysis (see Additional data file 1 [Materials and
methods]). Also, representative examples of pairs of alternative exons with correlated splicing levels are shown (b) for a pair of exons with positively
correlating inclusion levels from the Exo70 gene and (c) for a pair of exons with negatively correlating inclusion levels from the Neo1 gene. Upper panels
show plots comparing the GenASAP percentage exon exclusion levels for each exon in a correlating pair, with the percentage exclusion levels for each
exon separately plotted on the y-axis and x-axis. Circle sizes indicate relative transcript levels for the corresponding gene in each tissue shown, with larger
circles indicating higher transcript levels. Lower panels show radioactive reverse transcription polymerase chain reaction (RT-PCR) assays performed with
primer pairs targeted to constitutive exons flanking each alternative exon in a correlated pair. Percentage exclusion levels for each alternative exon, as
measured using a phosphorimager (see Materials and methods), are shown. Additional examples of correlated pairs of exons validated by RT-PCR assays
are shown in Additional data file 1 [Figure 2]. ES, embryonic stem cells.
Number of exon pairs from same
gene above correlation threshold
Average number of random exon
pairs above correlation threshold
(a)
(b)
(c)
0.0 0.2 0.4 0.6 0.8 1.0
1.0
0.8
0.6
0.4
0.2
0.0
93 92 92 90 94 92 65 62 41 38
Ovary
Salivary
Lung
ES
Liver
Heart
Eye
Midbrain
Cerebellum
Cortex
% exclusion
% exclusion4 7 9 5 23 17 32 49 62 49
GenASAP percentage exclusion (Exon 2)
GenASAP percentage exclusion (Exon 1)
1
2
Neo1
Cortex
Spinal cord
Cerebellum
Eye
Tongue
E15
ES
Intestine
Lung
Ovary
10 38 31 43 58 73 88 94 93 93 % exclusion
% exclusion
0.0 0.2 0.4 0.6 0.8 1.0
1.0
0.8
0.6
0.4
0.2
0.0
5 16 10 33 60 74 93 93 96 96
GenASAP percentage exclusion (Exon 2)
1
2
12
GenASAP percentage exclusion (Exon 1)
Exoc7
Exon 1Exon 2
Exon 1Exon 2
0.0 0.2 0.4 0.6 0.8 1.0
1.0
0.8
0.6
0.4
0.2
0.0
1
2
0.0 0.2 0.4 0.6 0.8 1.0
1.0
0.8
0.6
0.4
0.2
0.0
1
2
12
Number of exon pairs with greater correlation
Absolute value of Spearman correlation
R108.8 Genome Biology 2007, Volume 8, Issue 6, Article R108 Fagnani et al. />Genome Biology 2007, 8:R108
Table 2
Gene Ontology terms enriched in genes with CNS specific AS and transcript levels
Function/pathway GO term CNS
count
CNS
proportion
Total count Total
proportion
FDR
GO term enrichment in genes with CNS tissue specific AS levels
Signaling pathways Cell-cell signaling 7 0.065 17 0.011 0.02820
Rho guanyl-nucleotide exchange factor
activity
5 0.047 8 0.005 0.02820
Guanyl-nucleotide exchange factor activity 7 0.065 20 0.013 0.04400
Rho GTPase binding 3 0.028 3 0.002 0.04400
GTPase regulator activity 11 0.103 54 0.035 0.08280
Vesicular transport Vesicle-mediated transport 13 0.121 64 0.042 0.04400
Cytoskeleton Cytoskeletal protein binding 11 0.103 52 0.034 0.06720
Actin binding 8 0.075 32 0.021 0.09650
Nervous system Transmission of nerve impulse 5 0.047 13 0.008 0.09770
Neurophysiologic process 6 0.056 20 0.013 0.10800
Other functions Protein binding 49 0.458 449 0.291 0.03520
Plasma membrane 17 0.159 118 0.077 0.10800
GO term enrichment in genes with CNS tissue specific transcript levels
Signaling pathways Cell-cell signaling 12 0.085 34 0.015 0.00022
Cell communication 35 0.246 334 0.143 0.03030
Insulin secretion 3 0.021 5 0.002 0.08710
Peptide hormone secretion 3 0.021 5 0.002 0.08710
Ionotropic glutamate receptor activity 2 0.014 2 0.001 0.09940
G-protein-coupled receptor binding 2 0.014 2 0.001 0.09940
Glutamate-gated ion channel activity 2 0.014 2 0.001 0.09940
Excitatory extracellular ligand-gated ion
channel activity
3 0.021 6 0.003 0.09940
Cyclic-nucleotide-mediated signaling 3 0.021 7 0.003 0.13900
Genome Biology 2007, Volume 8, Issue 6, Article R108 Fagnani et al. R108.9
comment reviews reports refereed researchdeposited research interactions information
Genome Biology 2007, 8:R108
cAMP-mediated signaling 3 0.021 7 0.003 0.13900
G-protein coupled receptor protein
signaling pathway
9 0.063 58 0.025 0.14800
Secretory pathways Secretory pathway 10 0.070 45 0.019 0.02340
Secretion 10 0.070 51 0.022 0.04610
Regulated secretory pathway 4 0.028 11 0.005 0.09940
Cytoskeleton Microtubule 8 0.056 40 0.017 0.08980
microtubule associated complex 5 0.035 19 0.008 0.10800
Cytoskeleton 16 0.113 136 0.058 0.14800
Microtubule-based process 7 0.049 39 0.017 0.14800
Nervous system Transmission of nerve impulse 9 0.063 26 0.011 0.00456
Postsynaptic membrane 7 0.049 16 0.007 0.00512
Synaptic transmission 8 0.056 25 0.011 0.01100
Nervous system development 14 0.099 75 0.032 0.01500
Synaptosome 5 0.035 12 0.005 0.03030
Neurophysiologic process 9 0.063 43 0.018 0.04820
Neurogenesis 9 0.063 46 0.020 0.07040
Neurotransmitter secretion 4 0.028 10 0.004 0.08710
Neuron development 7 0.049 33 0.014 0.09940
Neuron differentiation 7 0.049 36 0.015 0.11400
Regulation of neurotransmitter levels 4 0.028 14 0.006 0.14800
Other functions Membrane fraction 11 0.077 54 0.023 0.02340
System development 15 0.106 79 0.034 0.01020
Localization 44 0.310 487 0.209 0.09940
Gene Ontology (GO) terms significantly enriched in the top approximately 100 genes with the most significant central nervous system (CNS) tissue
specific alternative splicing (AS) levels, and the top approximately 200 genes with the most CNS specific transcript levels are shown. CNS counts
(number of times a GO term appears in the CNS tissue regulated group) and total counts (number of times a GO term appears in the total group of
microarray-profiled genes with sufficient expression across 15 tissues) are shown. Proportions in each group are also shown. FDR denotes the false
discovery rate of a GO term. This value represents the expected proportion of false positive GO terms out of all positive GO terms. Only GO terms
with a FDR below 0.15 are shown.
Table 2 (Continued)
Gene Ontology terms enriched in genes with CNS specific AS and transcript levels
R108.10 Genome Biology 2007, Volume 8, Issue 6, Article R108 Fagnani et al. />Genome Biology 2007, 8:R108
Many of the remaining (about 20%) of genes could reflect reg-
ulation of AS via co-transcriptional coupling or AS events that
are independently regulated at the AS and transcriptional
levels.
Coordination between AS events belonging to the
same genes
In addition to the detection of individual alternative exons
that display regulatory patterns associated with single tissues
or groups of physiologically related tissues, we investigated
whether pairs of alternative exons belonging to the same
genes display tissue coordinated AS levels. Previous studies of
EST/cDNA sequences identified a few cases in which differ-
ent alternative exons belonging to the same genes appear to
be coordinated [32,33]. However, these studies did not
address whether multiple exons in the same genes can be co-
regulated in a tissue-dependent manner, or the extent to
which coordination between alternative exons occurs in a
large number of genes. Approximately 500 of the 3,044 genes
represented on our microarray contain between two and five
alternative exons. The AS levels for all pair-wise combina-
tions of the alternative exons belonging to the same genes,
with sufficiently high transcript levels in 20 or more tissues,
were compared using both standard and partial Spearman
correlation. The statistical significance of observed correla-
tions was assessed by comparing the observed number of cor-
related pairs of exons at a given correlation level with the
average number of pairs at the same correlation level
obtained from 1,000 random samples of pairs of exons
belonging to different genes (Figure 2a; see Additional data
file 1 for details).
Approximately 15 of the pairs of alternative exons have signif-
icantly correlating (absolute standard Spearman correlation
≥ 0.70) inclusion levels across the tissues, with an expected
false-positive detection rate of one exon pair (Additional data
file 4; also see Additional data file 1 for details). However,
higher than expected numbers of exon pairs with correlated
AS levels are observed over a wide range of lower correlation
levels (Figure 2a). For example, 38 pairs of exons display an
absolute standard Spearman correlation of 0.60 or greater,
although with an expected false positive detection rate of six
to ten exons. Approximately 65% of the pairs of exons dis-
played tissue dependent changes in inclusion levels in the
same direction (positive correlation), whereas 35% of the
pairs displayed tissue specific AS level changes in the opposite
direction (negative correlation; Figure 2 and Additional data
file 4). Six pairs of exons with significantly correlating AS lev-
els were analyzed by RT-PCR assays in ten of the 27 tissues
(Figure 2 and Additional data file 1 [Figure 2]). In each case
the tissue RNA samples were selected for analysis on the basis
of availability and displaying a broad range of inclusion levels
for each exon in a coordinated pair. All six pairs displayed the
overall expected AS level differences between the tissues,
indicating that our predictions for correlated AS levels
between exons belonging to the same genes are accurate.
Exons with high positive correlation (at a standard Spearman
correlation ≥ 0.6) are mostly within one to four exons of each
other, with a median of two intervening exons (Additional
data file 1 [Figure 3]). In contrast, exon pairs with high nega-
tive correlation (at a standard Spearman correlation ≤ -0.60)
have a median of four intervening exons, and exon pairs that
are not highly correlated (with an absolute standard Spear-
man correlation < 0.6) have a median of four intervening
exons (Additional data file 1 [Figure 3]). The difference in
intervening exon numbers between the positively correlated
pairs of exons and pairs of exons that are not highly correlated
is statistically significant (P = 0.021, by Wilcoxon-Mann-
Whitney rank sum test). Consistent with these results, exon
pairs displaying positive correlation are also significantly
closer to each other in terms of nucleotide length, as com-
pared with pairs of exons with high negative correlation or
without high correlation (Additional data file 1 [Figure 3]). In
a few of the cases shown in Additional data file 4, pairs of
alternative exons with significant positive correlation are
adjacent to each other. One example is a pair of alternative
exons in the gene encoding Agrin, a proteoglycan that func-
tions in the aggregation of acetylcholine receptors in postsyn-
aptic membranes, which is a key step in neuromuscular
junction development. Consistent with our microarray data
indicating that this pair of exons has increased inclusion lev-
els in CNS tissues relative to the other profiled tissues, it has
been reported that the same pair of exons can be included in
nervous system tissues but are excluded in all other tissues
examined [34]. These results suggest the interesting possibil-
ity that proximal pairs of alternative exons, whether adjacent
or separated by at least one intervening exon, may positively
influence each other and thereby facilitate tissue specific
coordination of AS events belonging to the same genes.
As in the case of the pair of the positively correlated exons in
Agrin transcripts, the levels of inclusion of exons belonging to
a correlated pair are generally highly similar among the vari-
ous CNS tissues (Figure 2 and Additional data file 1 [Figure
2]). Consistent with this observation and the analyses
described above, about 50% of genes with significantly corre-
lated pairs of AS events are known to have neural specific
functions (Additional data file 4). In other examples, a pair of
positively correlated alternative exons with distinct neural
specific splicing levels is detected in transcripts from the
Exoc7/Exo70 gene (Figure 2b), and a pair of negatively corre-
lated alternative exons, with each exon also displaying dis-
tinct levels in CNS tissues, is detected in transcripts from the
Neogenin (Neo1) gene (Figure 2c). Exoc7/Exo70 is a compo-
nent of exocyst complex that is involved in vesicle-mediated
exocytosis and functions in membrane targeting of neuro-
transmitter receptors for γ-aminobutyric acid (GABA) and N-
methyl-D-aspartate [35-37], and Neo1 is a widely expressed
cell surface receptor that is involved in axon guidance and in
the regulation of neuronal survival [38,39]. Collectively, these
findings indicate that pairs of alternative exons belonging to
the same genes can be regulated in a coordinated manner in
Genome Biology 2007, Volume 8, Issue 6, Article R108 Fagnani et al. R108.11
comment reviews reports refereed researchdeposited research interactions information
Genome Biology 2007, 8:R108
different mouse tissues, and that many of these pairs of exons
are probably associated with CNS specific functions.
Different groups of functionally related genes display
CNS associated AS and transcript level regulation
Subsets of AS events regulated in a tissue dependent manner
may serve to coordinate specific biologic functions and there-
fore are of considerable interest. To assess more systemati-
cally the functions of the genes containing alternative exons
with CNS associated AS levels, and to address whether these
genes operate in common cellular processes and pathways,
we considered whether genes with the most significant CNS
associated AS level differences are enriched in Gene Ontology
(GO) terms. Enrichment was observed for terms including
the following: GTPase-based signaling, cell-cell signaling,
cytoskeletal organization and biogenesis, vesicular mediated
transport, transmission of nerve impulse, and neurophysio-
logic process (false discovery rate < 0.15; Table 2). Enrich-
ment of these terms appears to be specific to the group of
genes with CNS regulated AS events, because a group of about
100 genes from our data that contain alternative exons regu-
lated in non-CNS tissues are not enriched for the same terms
(data not shown). Approximately 30% of the genes in our list
were linked to one or more annotations associated with these
GO processes, as was also supported by independent infor-
mation provided by manual literature searching. Although
the genes associated with these GO processes are generally
widely expressed, most have documented nervous system
specific functions (Table 1). In addition, some of the genes are
known to encode proteins that physically interact or function
in the same biological pathways (see Additional data file 1 and
Conclusions [below] for more information).
Many of the genes containing CNS tissue regulated alterna-
tive exons encode factors belonging to Rho, Rap, Rab, and Arf
GTPase mediated signaling pathways. A subset of these genes
are associated with neural specific functions such as dendrite
morphogenesis, neurite growth, synapse formation, and axon
guidance (see Table 1 and Additional data file 1). CNS associ-
ated AS events were also detected in multiple members of the
mitogen-activated protein kinase and calmodulin kinase sig-
naling pathways, and in different phosphatases, some of
which are involved in signaling in the nervous system (Table
1 and Additional data file 1). CNS regulated AS events were
detected in multiple genes associated with actin, myosin, and
microtubule based cytoskeletal components. Genes among
this group have neural specific functions associated with
vesicular transport, axon pathfinding/neurite outgrowth,
glutamate receptor endocytosis, and neuroepithelial develop-
ment (Table 1; see Additional data file 1). A prominent feature
of the genes containing CNS associated AS events is their
functional association with different stages of vesicle traffick-
ing in neurons, such as synaptic vesicle endocytosis and exo-
cytosis. Other functional categories containing multiple CNS
specific events were mRNA processing, transcription factors,
tight junctions, and ion channels (Table 1). These observa-
tions support the conclusion that signaling pathways, the
cytoskeleton, and vesicular transport are highly regulated by
AS in the mouse CNS.
Interestingly, genes regulated in a CNS-specific manner at the
transcript level are enriched in an overlapping yet distinct set
of GO annotation terms compared with the genes with CNS
associated AS events (Table 2). These terms include synaptic
function, nerve impulse and transmission, nervous system
development, cytoskeletal organization and biogenesis, and
secretory pathways. This supports the conclusion that AS and
transcription are regulated in a CNS specific manner to coor-
dinate the activities of mostly distinct genes that operate in
partially overlapping processes and pathways.
Intronic and exonic motifs correlated with CNS-
regulated AS
We next aimed to identify cis-acting motifs, either known or
novel, that comprise the 'code' underlying the regulation of
CNS associated AS events. Previous studies conducted to
identify motifs associated with tissue-dependent regulation
of AS have largely focused on searches within regulated alter-
native exons or the immediate flanking intron sequences of
alternative exons [3,4]. However, regulation of AS can also
involve more distally acting cis elements located in introns or
in neighboring exons [22,40]. Also, it is possible that some cis
elements are not confined to a specific region but rather can
function from one of two or more locations, for example from
an intron location that is either upstream or downstream of a
regulated alternative exon. We therefore performed a system-
atic ab initio motif search covering the following sequences:
alternative exons, constitutive exons located directly
upstream and downstream of each alternative exon, and 150
nucleotides of intron sequence flanking each of these three
exons (see Figure 3 and Additional data file 1 for details). We
also searched different concatenations of these sequences in
order to detect motifs that may function from one of two pos-
sible locations.
The ab initio search was performed using a modified version
of the SeedSearcher algorithm [41] (see Additional data file 1
for details). This algorithm enabled us to identify motifs that
discriminate the sequences associated with the top approxi-
mately 100 CNS regulated AS events (summarized above)
from the corresponding sequences associated with non-CNS-
regulated AS events. Specifically, we searched for motifs that
best discriminate AS events belonging to groups that display
a significant increase in exon inclusion in CNS tissues, a sig-
nificant increase in exon exclusion in CNS tissues, or either an
increase or decrease in inclusion in CNS tissues, as compared
with the non-CNS tissues. Each search was performed for
motifs with a length of between five and 20 nucleotides and
with various degrees of sequence flexibility. The statistical
significance of each motif was computed and assigned a P
value that was corrected for multiple hypotheses testing, and
each motif was also compared against a database of previ-
R108.12 Genome Biology 2007, Volume 8, Issue 6, Article R108 Fagnani et al. />Genome Biology 2007, 8:R108
ously reported motifs associated with splicing (see Additional
data file 1 for details on motif scoring and comparison proce-
dures). Because sequence conservation reflects selection
pressure acting to preserve biologic activity, it can be used as
a proxy to assess the probable functional importance of
motifs. Accordingly, we also analyzed the relative conserva-
tion levels of the SeedSearcher motifs in the corresponding
intron and exon regions of the orthologous human genes, and
the statistical significance of detected conservation was deter-
mined (see Additional data file 1 for details).
All 39 of the SeedSearcher motifs found to be significantly
enriched in the CNS regulated AS events (corrected P < 0.05)
are shown in Additional data file 5, alongside any known sim-
ilar motifs. Of these motifs, 26 had at least 20 occurrences in
the three groups defined above, and this number of occur-
rences facilitated further analysis of these motifs for statisti-
cally significant, relative conservation levels. Seventeen of the
26 motifs were found to be significantly more conserved than
the surrounding regions (binomial P < 0.05; see Additional
data files 1 and 10 for details). Finally, we also directly
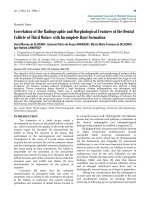
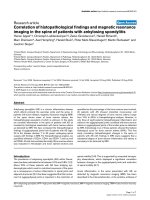
Detection of new motifs in exons and introns that correlate with CNS regulated AS eventsFigure 3
Detection of new motifs in exons and introns that correlate with CNS regulated AS events. Motifs correlating with central nervous system (CNS)
associated alternative splicing (AS) levels were detected in exon sequences (C1, A, C2) and intron sequences (I1, I2) using the SeedSearcher algorithm
[41]. Ab initio searches for motifs were performed in the individual exon and intron sequences, and in concatenations of intron/exon sequences. Motifs
enriched in these locations, as indicated by lines with arrowheads, are correlated with either increased inclusion (yellow boxes), increased exclusion (blue
boxes), or a change in inclusion (black boxes), respectively.
Motifs correlating with:
Inclusion
Exclusion
Inclusion or
exclusion
150 nt 150 nt150 nt150 nt
C1 A
C2
I1 I2
Genome Biology 2007, Volume 8, Issue 6, Article R108 Fagnani et al. R108.13
comment reviews reports refereed researchdeposited research interactions information
Genome Biology 2007, 8:R108
searched for enrichment of cis elements with a previously
described link to regulation of AS in the nervous system
(Additional data file 6). The results of this search, as well as
the ab initio search, are described in more detail below.
Figure 3 illustrates part of a putative code for CNS AS regula-
tion based on the results of our ab initio search. Apart from
interesting features of the motifs themselves, a number of
important general observations can be made. First, we note
that no motifs are found in the alternative exons, whereas sev-
eral motifs are located in the neighboring constitutive (C1 and
C2) exons and in the intron sequences flanking these and the
alternative exons. Second, some motifs are detected when
sequence regions were concatenated, indicating that they
could function in a spatially flexible manner and do not have
to reside within a specific exon or intron location. Third, there
is a high enrichment for variations of C/U-rich motifs. These
predominantly reside within the 150 nucleotide intron region
immediately upstream of alternative exons, although some C/
U-rich motifs are also found within the 150 nucleotide intron
region downstream of alternative exons. These motifs are
specific to these regions, because they are not significantly
enriched in the 150 nucleotide intron regions immediately
flanking the C1 and C2 exons. Moreover, none of the motifs
shown in Figure 3 and listed in Additional data file 5 were
enriched in exons or flanking intron regions of exons that are
upstream and downstream of the C1-A-C2 region (data not
shown). Finally, we note that the most significantly enriched
motifs, and the intronic C/U-rich motifs in particular, are
more often associated with alternative exons that display
preferential inclusion in CNS tissues, rather then preferential
exclusion.
The C/U-rich motifs resemble binding sites for nPTB and
PTB, which are known to function in the regulation of alter-
native exon inclusion in the nervous system (see
Introduction) [42,43]. In particular, consistent with the
observation that these motifs are more strongly associated
with increased inclusion of alternative exons in CNS tissues
relative to other profiled tissues, previous studies on the neu-
ral specific c-src N1 exon and an exon within the GABA(A)
receptor gamma2 pre-mRNA suggested that binding of nPTB
to pyrimidine-rich sequences adjacent to these exons can pro-
mote their inclusion [42,43].
Consistent with the results from the ab initio search, C/U-
rich motifs were also found to be the most significantly
enriched (hypergeometric P about 10
-6
) when directly search-
ing using subsequences of known motifs, including those
shown in previous experiments to directly bind nPTB and
PTB (Additional data file 6). Many of the C/U-rich motifs
identified in the directed searches resemble those identified
by the ab initio search. However, in both searches, the identi-
fied motifs are considerably shorter and more degenerate
than those inferred previously by experimental approaches
and, as such, could represent the core recognition sites for
nPTB/PTB or potentially other AS regulatory factors that spe-
cifically recognize pyrimidine-rich regions to regulate neural
specific splicing. The C/U-rich motifs that we detected are
different from the UGYUUUC motif that Sugnet and cowork-
ers [21] found to be enriched in the 150 nucleotide intron
flanks upstream of the alternative exons, which they scored as
having increased inclusion in nervous system tissues. These
authors did not observe enrichment of the sequence
CUCUCU, which is known to bind PTB/nPTB, when they
searched the intron flanks of their predicted nervous system-
regulated exons, whereas this sequence was found to be sig-
nificantly and specifically enriched in the sequences
upstream of alternative exons displaying increased inclusion
in CNS tissues in our data (Additional data files 6 and 7).
The differences between our findings and the results reported
by Sugnet and coworkers could be due to the different sets of
AS events analyzed (see above) as well as differences between
the motif search algorithms implemented in the two studies.
To investigate the latter possibility, we employed the Impro-
bizer algorithm described by Sugnet and coworkers to iden-
tify and score motifs enriched in our set of CNS regulated AS
events. The Improbizer searches resulted in detection of 20
statistically significant (P ≤ 0.05; see Additional data file 1 for
details) position-specific scoring matrix (PSSM) based motifs
(Additional data file 9). Consistent with the results obtained
with SeedSearcher, Improbizer detected enrichment of sev-
eral C/U-rich motifs in the intron regions flanking the regu-
lated alternative exons, and only one motif was detected in
the regulated alternative exons, although this motif barely
passed the score threshold. There are obvious similarities
between many of the 20 Improbizer PSSM motifs and the 39
SeedSearcher motifs, and in some cases combinations of mul-
tiple SeedSearcher motifs appear to be similar to individual
Improbizer PSSMs (but not necessarily vice versa). It is also
noteworthy that although the UGYUUUC motif previously
reported by Sugnet and coworkers was not detected in intron
sequences flanking the CNS regulated exons in our data,
Improbizer did report another motif (UUUSYUU) that
matched one of the SeedSearcher motifs (UUUGYUU; see
Additional data file 5). Our comparative results thus indicate
that both differences in the sets of AS events analyzed as well
as in the motif search procedures probably account for differ-
ences between the numbers and types of motifs detected in
the two studies.
In addition to the detection of strong enrichment of C/U-rich
motifs, the directed searches on our dataset revealed a
relatively modest enrichment (P about 10
-4
) of motifs corre-
sponding to the binding sites for Fox-1/2 and Nova-1/2
motifs. This is not surprising because, as mentioned before,
Nova proteins probably regulate about 7% of neural specific
AS events [10], and Fox proteins are known to regulate AS in
several cell and tissue types in addition to nervous system tis-
sues [15]. The detection of these and the C/U-rich motifs in
expected regions (see Additional data file 7) indicates that our
R108.14 Genome Biology 2007, Volume 8, Issue 6, Article R108 Fagnani et al. />Genome Biology 2007, 8:R108
microarray data and search procedures are reliable and prob-
ably result in the identification of functionally relevant cis-
acting sequences associated with CNS tissue regulated AS.
Importantly, the ab initio searches resulted in the detection of
many motifs that are more highly enriched than those found
in the directed searches, and several of these motifs appear to
be novel (Figure 3 and Additional data files 5 and 8). For
example, two closely related motifs with the sequences ANU-
CAGNA (where N represents a position where any base may
occur) and ANUCNGAA are enriched in C1 exon and C1-C2
concatenation, and are associated with increased CNS tissue
specific exclusion of the adjacent alternative exon. Another
motif with the sequence CUAAUNC is enriched in the C2I2
intron sequence and C1I1-C2I2 concatenation and is associ-
ated with CNS tissue specific inclusion of the adjacent alter-
native exons. These motifs could correspond to the
recognition sites for as yet unidentified CNS tissue specific
splicing factors that function by binding to constitutive exons
and intron sequences flanking constitutive exons, respec-
tively. It is interesting to note in this regard that recent evi-
dence suggests that Nova dependent regulation of alternative
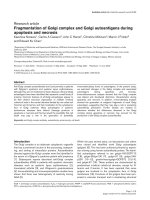
Network diagram comprising genes and functional processes associated with regulated AS events in the CNSFigure 4
Network diagram comprising genes and functional processes associated with regulated AS events in the CNS. Experimental evidence supporting
interactions, pathway and functional relationships among genes with microarray detected central nervous system (CNS) specific alternative splicing (AS)
events was retrieved from the literature and from the Online Predicted Human Interaction Database [45], and used to construct a network diagram using
the Osprey program [46]. Yellow nodes denote cytoskeletal pathways/genes, green nodes denote vesicle-mediated transport pathways/genes, red nodes
denote signaling pathways/genes, and blue nodes denote CNS functions. Red edges denote protein-protein interactions, black edges denote gene-pathway
associations, blue edges denote gene-CNS function associations, and gray edges denote pathway-pathway or pathway-CNS function associations. Pathways
and CNS functions are in bold letters. Gene names are the NCBI Entrez Gene standard gene symbols.
Rap1gds1
Rap1ga1
Tmod2
Plcb4
Opa1
Snap23
Rab6ip2
Map3k4
Vav2
Camk2d
Ppm1f
Syngr1
Sgip1
Rab3ip
Git2
Dnm1
Epb4.9
Clasp1
Arhgef7
Syne1
Myo5a
Dst
Ablim1
Camk2g
Ptprf
Ptprk
Mapkapk3
Map4k6
Rap1gef6
Rap1gef4
Kifap3
Dlgh4
Exoc7
Pacsin2
Myo6
Arfgap1
Genome Biology 2007, Volume 8, Issue 6, Article R108 Fagnani et al. R108.15
comment reviews reports refereed researchdeposited research interactions information
Genome Biology 2007, 8:R108
splicing involves clusters of Nova binding sites, some of which
are located in proximal constitutive exons, as well as in the
intron regions flanking these constitutive exons [22].
In summary, our findings suggest a previously unanticipated
and widespread role for C/U-rich motifs bound by AS regula-
tors such as nPTB and PTB in CNS specific AS. In addition,
our data suggest that CNS specific AS involves many new
motifs and as yet unidentified factors that bind to these
motifs. Many of these new regulatory elements are predicted
to function from the proximal constitutively spliced exons
and their flanking intron sequences.
Conclusion
Using a new AS microarray applied to the profiling of 27
diverse mouse cell and tissue types, we detected a large
number of new examples of tissue dependent differential reg-
ulation of AS. Most of these regulated AS events were
observed in CNS tissues, and approximately two-thirds have
not previously been reported in the literature. At least 3% of
pairs of alternative exons belonging to the same genes appear
to be spliced in a coordinated manner across the profiled cells
and tissues, with many exon pairs displaying the most distinct
inclusion level differences in nervous system tissues. Pairs of
alternative exons that are spliced in a positively correlated
manner across mouse cells and tissues tend to be relatively
close to one another (often separated by a single intervening
exon), and this implies that coordination between AS events
belonging to the same genes may involve communication
between splicing factors assembled at proximally located
splicing signals.
Approximately half of the genes containing single and pairs of
exons that are differentially spliced in CNS tissues have
known neural specific functions. The CNS associated AS
events we have detected by microarray profiling are signifi-
cantly enriched in genes with GO terms related to GTPase
based signaling, vesicular transport and cytoskeletal func-
tions, as well as nervous system specific GO terms. Similar to
the proposed role for Nova proteins in the coordinated regu-
lation of alternative exons belonging to genes associated with
functions at the synapse [11,22] (see Introduction, above), our
results suggest a more widespread role for coordinated AS
events to modify the proteins of widely expressed genes, such
that these proteins can operate in multiple different CNS
associated functions and pathways. Based on documented
experimental evidence (see Additional data file 1), we have
constructed a network illustrating possible connections
between many of the GO enriched genes and their associated
nervous system specific functions (Figure 4). This network
highlights the nature of the possible interactions between
widely expressed genes that have CNS regulated AS events
(see the legend to Figure 4 for additional information).
New and known motifs were identified that correlate strongly
with the CNS regulated AS events. Our results thus provide a
large number of new CNS regulated AS events, many of which
are associated with functionally related genes, as well as
detailed information on sequence motifs that are predicted to
regulate these CNS-associated AS events. These motifs prob-
ably comprise part of the sequence 'code' underlying the reg-
ulation of CNS tissue specific AS. As such, the data resulting
from our analyses should provide a valuable resource for
establishing molecular mechanisms by which the neural spe-
cific functions of widely expressed genes are regulated and
coordinated at the level of AS.
Materials and methods
Identification of AS events in mouse transcripts
The detection of AS events was performed essentially as pre-
viously described [23,30].
Microarray hybridization, image processing, and data
analysis
Microarray design, hybridization and data analysis for 3,707
mouse cassette AS events from 3,044 UniGene clusters (rep-
resented on a single 44 K microarray manufactured by Agi-
lent Technologies, Inc., Santa Clara, CA 95051, USA) was
performed essentially as described previously [23,24,44].
Information on AS events represented on the mouse
microarray, and GenASAP estimates for percentage exon
exclusion levels for the cassette AS events in 27 mouse tissues
are provided in Additional data file 1. Methods for detection
and analysis of single tissue regulated AS events, and corre-
lated pairs of alternative exons, are described in Additional
data file 1.
Motif detection and analysis
Detection of motifs enriched in exon and intron sequences
associated with CNS regulated AS events was performed
using a variant of the SeedSearcher algorithm [41]. Details on
methods for motif searches, the assessment of statistical sig-
nificance of individual motifs, and comparisons of Seed-
Searcher detected motifs with previously identified motifs are
provided in Additional data file 1.
RT-PCR assays
RT-PCR reactions were carried out as described previously
[25].
Additional data files
The following additional data are available with the online
version of this paper. Additional data file 1 provides supple-
mental information on genes with microarray detected tissue
specific AS levels, additional details regarding the materials
and methods used, and additional illustrations. Additional
data file 2 provides information on tissue specific AS events.
Additional data file 3 provides information on CNS regulated
R108.16 Genome Biology 2007, Volume 8, Issue 6, Article R108 Fagnani et al. />Genome Biology 2007, 8:R108
AS events. Additional data file 4 provides information on cor-
related pairs of AS events belonging to the same genes. Addi-
tional data file 5 summarizes motifs associated with CNS
specific AS events detected from ab initio searches. Addi-
tional data file 6 summarizes experimentally defined
sequences/motifs associated with neural specific AS used for
searches. Additional data file 7 summarizes experimentally
defined motifs/subsequences significantly enriched in exons
and introns associated with CNS regulated AS events identi-
fied in the AS microarray data. Additional data file 8 provides
the number and statistical significance of ab initio motifs
detected at each exonic and intronic location, and in each
group. Additional data file 9 summarizes motifs associated
with CNS specific AS events detected by searching with the
Improbizer program. Additional data file 10 summarizes con-
servation levels of motifs associated with CNS specific AS
events detected from ab initio searches. Additional data file 11
shows GenASAP values and C1-A-C2 exon sequences for
3,707 AS events profiled in 27 mouse tissues.
Additional data file 1Supplementary informationProvided is supplemental information on genes with microarray detected tissue specific AS levels, additional details on Materials and Methods, and additional Figures (1-5).Click here for fileAdditional data file 2Tissue specific AS eventsProvided is information on tissue specific AS events.Click here for fileAdditional data file 3CNS regulated AS eventsProvided is information on CNS regulated AS events.Click here for fileAdditional File 4Correlated pairs of AS events belonging to the same genesProvided is information on correlated pairs of AS events belonging to the same genes.Click here for fileAdditional data file 5Motifs associated with CNS specific AS events (ab initio searches)Summarized are motifs associated with CNS specific AS events detected from ab initio searches.Click here for fileAdditional data file 6Experimentally defined sequences/motifs associated with neural specific ASSummarized are experimentally defined sequences/motifs associ-ated with neural specific AS used for searchesClick here for fileAdditional data file 7Experimentally defined motifs/subsequences significantly enriched in exons and introns associated with CNS regulated AS eventsSummarized are experimentally defined motifs/subsequences sig-nificantly enriched in exons and introns associated with CNS regu-lated AS events identified in the AS microarray data.Click here for fileAdditional data file 8Number and statistical significance of ab initio motifsSummarized are the number and statistical significance of ab initio motifs detected at each exonic and intronic location, and in each group.Click here for fileAdditional data file 9Motifs associated with CNS specific AS events (Improbizer)Summarized are motifs associated with CNS specific AS events detected by searching with the Improbizer program.Click here for fileAdditional data file 10Conservation levels of motifs associated with CNS specific AS eventsShown are conservation levels of motifs associated with CNS spe-cific AS events detected from ab initio searches.Click here for fileAdditional data file 11GenASAP values and C1-A-C2 exon sequencesProvided are GenASAP values and C1-A-C2 exon sequences for 3,707 AS events profiled in 27 mouse tissues. Additional microar-ray data has been deposited in GEO under accession GSE8081.Click here for file
Acknowledgements
Many thanks to Rick Collins, Zhaolei Zhang, Jim Ingles, John Calarco, and
Mathieu Gabut for helpful comments and suggestions on the manuscript.
We also thank Igor Jurisica and Kevin Brown for their assistance in con-
structing the network diagram in Figure 4. Tommy Kaplan, Naomi Habib,
and Nir Friedman are thanked for their help with motif comparisons, and
we are also grateful to Jim Kent for providing the Improbizer software. ALS
acknowledges support from an NSERC PGS Award. Our research was
funded by grants from the Canadian Institutes of Health Research (to BJB
and BJF), the National Cancer Institute of Canada (to BJB), and from Infra-
structure Grants from the Canadian Foundation for Innovation (to BJB, BJF,
TRH, and others). This work was also funded in part by a grant from
Genome Canada (to BJB, BJF, TRH, and others) through the Ontario
Genomics Institute.
References
1. Smith CW, Valcarcel J: Alternative pre-mRNA splicing: the
logic of combinatorial control. Trends Biochem Sci 2000,
25:381-388.
2. Graveley BR: Alternative splicing: increasing diversity in the
proteomic world. Trends Genet 2001, 17:100-107.
3. Matlin AJ, Clark F, Smith CW: Understanding alternative splic-
ing: towards a cellular code. Nat Rev Mol Cell Biol 2005,
6:386-398.
4. Blencowe BJ: Alternative splicing: new insights from global
analyses. Cell 2006, 126:37-47.
5. Lareau LF, Green RE, Bhatnagar RS, Brenner SE: The evolving roles
of alternative splicing. Curr Opin Struct Biol 2004, 14:273-282.
6. Lee C, Roy M: Analysis of alternative splicing with microar-
rays: successes and challenges. Genome Biol 2004, 5:231.
7. Johnson JM, Castle J, Garrett-Engele P, Kan Z, Loerch PM, Armour
CD, Santos R, Schadt EE, Stoughton R, Shoemaker DD: Genome-
wide survey of human alternative pre-mRNA splicing with
exon junction microarrays. Science 2003, 302:2141-2144.
8. Modrek B, Resch A, Grasso C, Lee C: Genome-wide detection of
alternative splicing in expressed sequences of human genes.
Nucleic Acids Res 2001, 29:2850-2859.
9. Yeo G, Holste D, Kreiman G, Burge CB: Variation in alternative
splicing across human tissues. Genome Biol 2004, 5:R74.
10. Ule J, Ule A, Spencer J, Williams A, Hu JS, Cline M, Wang H, Clark T,
Fraser C, Ruggiu M, et al.: Nova regulates brain-specific splicing
to shape the synapse. Nat Genet 2005, 37:844-852.
11. Forch P, Valcarcel J: Splicing regulation in Drosophila sex
determination. Prog Mol Subcell Biol 2003, 31:
127-151.
12. Dulac C: Sex and the single splice. Cell 2005, 121:664-666.
13. Ladd AN, Cooper TA: Finding signals that regulate alternative
splicing in the post-genomic era. Genome Biol 2002,
3:reviews0008
14. Black DL: Mechanisms of alternative pre-messenger RNA
splicing. Annu Rev Biochem 2003, 72:291-336.
15. Nakahata S, Kawamoto S: Tissue-dependent isoforms of mam-
malian Fox-1 homologs are associated with tissue-specific
splicing activities. Nucleic Acids Res 2005, 33:2078-2089.
16. Barreau C, Paillard L, Mereau A, Osborne HB: Mammalian CELF/
Bruno-like RNA-binding proteins: molecular characteristics
and biological functions. Biochimie 2006, 88:515-525.
17. Pascual M, Vicente M, Monferrer L, Artero R: The Muscleblind
family of proteins: an emerging class of regulators of devel-
opmentally programmed alternative splicing. Differentiation
2006, 74:65-80.
18. Cooper TA: Use of minigene systems to dissect alternative
splicing elements. Methods 2005, 37:331-340.
19. Jensen KB, Musunuru K, Lewis HA, Burley SK, Darnell RB: The
tetranucleotide UCAY directs the specific recognition of
RNA by the Nova K-homology 3 domain. Proc Natl Acad Sci USA
2000, 97:5740-5745.
20. Ule J, Jensen KB, Ruggiu M, Mele A, Ule A, Darnell RB: CLIP identi-
fies Nova-regulated RNA networks in the brain. Science 2003,
302:1212-1215.
21. Sugnet CW, Srinivasan K, Clark TA, O'Brien G, Cline MS, Wang H,
Williams A, Kulp D, Blume JE, Haussler D, et al.: Unusual intron
conservation near tissue-regulated exons found by splicing
microarrays. PLoS Comput Biol 2006, 2:e4.
22. Ule J, Stefani G, Mele A, Ruggiu M, Wang X, Taneri B, Gaasterland T,
Blencowe BJ, Darnell RB: An RNA map predicting Nova-
dependent splicing regulation.
Nature 2006, 444:580-586.
23. Pan Q, Shai O, Misquitta C, Zhang W, Saltzman AL, Mohammad N,
Babak T, Siu H, Hughes TR, Morris QD, et al.: Revealing global reg-
ulatory features of mammalian alternative splicing using a
quantitative microarray platform. Mol Cell 2004, 16:929-941.
24. Shai O, Morris QD, Blencowe BJ, Frey BJ: Inferring global levels of
alternative splicing isoforms using a generative model of
microarray data. Bioinformatics 2006, 22:606-613.
25. Pan Q, Saltzman AL, Kim YK, Misquitta C, Shai O, Maquat LE, Frey BJ,
Blencowe BJ: Quantitative microarray profiling provides evi-
dence against widespread coupling of alternative splicing
with nonsense-mediated mRNA decay to control gene
expression. Genes Dev 2006, 20:153-158.
26. Kornblihtt AR, de la Mata M, Fededa JP, Munoz MJ, Nogues G: Mul-
tiple links between transcription and splicing. RNA 2004,
10:1489-1498.
27. Minovitsky S, Gee SL, Schokrpur S, Dubchak I, Conboy JG: The
splicing regulatory element, UGCAUG, is phylogenetically
and spatially conserved in introns that flank tissue-specific
alternative exons. Nucleic Acids Res 2005, 33:714-724.
28. Siepel A, Bejerano G, Pedersen JS, Hinrichs AS, Hou M, Rosenbloom
K, Clawson H, Spieth J, Hillier LW, Richards S, et al.: Evolutionarily
conserved elements in vertebrate, insect, worm, and yeast
genomes. Genome Res 2005, 15:1034-1050.
29. Baek D, Green P: Sequence conservation, relative isoform fre-
quencies, and nonsense-mediated decay in evolutionarily
conserved alternative splicing. Proc Natl Acad Sci USA 2005,
102:12813-12818.
30. Pan Q, Bakowski MA, Morris Q, Zhang W, Frey BJ, Hughes TR, Blen-
cowe BJ: Alternative splicing of conserved exons is frequently
species-specific in human and mouse. Trends Genet 2005,
21:73-77.
31. Le K, Mitsouras K, Roy M, Wang Q, Xu Q, Nelson SF, Lee C:
Detecting tissue-specific regulation of alternative splicing as
a qualitative change in microarray data.
Nucleic Acids Res 2004,
32:e180.
32. Xing Y, Resch A, Lee C: The multiassembly problem: recon-
structing multiple transcript isoforms from EST fragment
mixtures. Genome Res 2004, 14:426-441.
33. Fededa JP, Petrillo E, Gelfand MS, Neverov AD, Kadener S, Nogues
G, Pelisch F, Baralle FE, Muro AF, Kornblihtt AR: A polar mecha-
nism coordinates different regions of alternative splicing
within a single gene. Mol Cell 2005, 19:393-404.
34. Bezakova G, Ruegg MA: New insights into the roles of agrin. Nat
Rev Mol Cell Biol 2003, 4:295-308.
35. Kee Y, Yoo JS, Hazuka CD, Peterson KE, Hsu SC, Scheller RH: Sub-
unit structure of the mammalian exocyst complex. Proc Natl
Acad Sci USA 1997, 94:14438-14443.
36. Farhan H, Korkhov VM, Paulitschke V, Dorostkar MM, Scholze P,
Genome Biology 2007, Volume 8, Issue 6, Article R108 Fagnani et al. R108.17
comment reviews reports refereed researchdeposited research interactions information
Genome Biology 2007, 8:R108
Kudlacek O, Freissmuth M, Sitte HH: Two discontinuous seg-
ments in the carboxyl terminus are required for membrane
targeting of the rat gamma-aminobutyric acid transporter-1
(GAT1). J Biol Chem 2004, 279:28553-28563.
37. Gerges NZ, Backos DS, Rupasinghe CN, Spaller MR, Esteban JA:
Dual role of the exocyst in AMPA receptor targeting and
insertion into the postsynaptic membrane. EMBO J 2006,
25:1623-1634.
38. Keeling SL, Gad JM, Cooper HM: Mouse Neogenin, a DCC-like
molecule, has four splice variants and is expressed widely in
the adult mouse and during embryogenesis. Oncogene 1997,
15:691-700.
39. Matsunaga E, Tauszig-Delamasure S, Monnier PP, Mueller BK, Stritt-
matter SM, Mehlen P, Chedotal A: RGM and its receptor neo-
genin regulate neuronal survival. Nat Cell Biol 2004, 6:749-755.
40. Martinez-Contreras R, Fisette JF, Nasim FU, Madden R, Cordeau M,
Chabot B: Intronic binding sites for hnRNP A/B and hnRNP F/
H proteins stimulate pre-mRNA splicing. PLoS Biol 2006, 4:e21.
41. Barash Y, Bejerano G, Friedman N: A simple hyper-geometric
approach for discovering putative transcription factor bind-
ing sites. Lecture Notes Computer Sci 2001, 2149:278-293.
42. Ashiya M, Grabowski PJ: A neuron-specific splicing switch medi-
ated by an array of pre-mRNA repressor sites: evidence of a
regulatory role for the polypyrimidine tract binding protein
and a brain-specific PTB counterpart. RNA 1997, 3:996-1015.
43. Markovtsov V, Nikolic JM, Goldman JA, Turck CW, Chou MY, Black
DL: Cooperative assembly of an hnRNP complex induced by
a tissue-specific homolog of polypyrimidine tract binding
protein. Mol Cell Biol 2000, 20:7463-7479.
44. Zhang W, Morris QD, Chang R, Shai O, Bakowski MA, Mitsakakis N,
Mohammad N, Robinson MD, Zirngibl R, Somogyi E, et al.: The func-
tional landscape of mouse gene expression. J Biol 2004, 3:21.
45. Brown KR, Jurisica I: Online predicted human interaction
database. Bioinformatics 2005, 21:2076-2082.
46. Breitkreutz BJ, Stark C, Tyers M: Osprey: a network visualization
system. Genome Biol 2003, 4:R22.