Báo cáo y học: "GC- and AT-rich chromatin domains differ in conformation and histone modification status and are differentially modulated by Rpd3" doc
Bạn đang xem bản rút gọn của tài liệu. Xem và tải ngay bản đầy đủ của tài liệu tại đây (970 KB, 14 trang )
Genome Biology 2007, 8:R116
comment reviews reports deposited research refereed research interactions information
Open Access
2007DekkerVolume 8, Issue 6, Article R116
Research
GC- and AT-rich chromatin domains differ in conformation and
histone modification status and are differentially modulated by
Rpd3p
Job Dekker
Address: Program in Gene Function and Expression and Department of Biochemistry and Molecular Pharmacology, University of
Massachusetts Medical School, Plantation Street, Worcester, MA 01605-4321, USA. Email:
© 2007 Dekker; licensee BioMed Central Ltd.
This is an open access article distributed under the terms of the Creative Commons Attribution License ( which
permits unrestricted use, distribution, and reproduction in any medium, provided the original work is properly cited.
GC- and AT-rich chromatin domain differences<p>GC-rich and AT-rich chromatin domains display distinct chromatin conformations and are marked by distinct patterns of histone mod-ifications, and the histone deacetylase Rpd3p is an attenuator of these differences.</p>
Abstract
Background: Base-composition varies throughout the genome and is related to organization of
chromosomes in distinct domains (isochores). Isochore domains differ in gene expression levels,
replication timing, levels of meiotic recombination and chromatin structure. The molecular basis
for these differences is poorly understood.
Results: We have compared GC- and AT-rich isochores of yeast with respect to chromatin
conformation, histone modification status and transcription. Using 3C analysis we show that, along
chromosome III, GC-rich isochores have a chromatin structure that is characterized by lower
chromatin interaction frequencies compared to AT-rich isochores, which may point to a more
extended chromatin conformation. In addition, we find that throughout the genome, GC-rich and
AT-rich genes display distinct levels of histone modifications. Interestingly, elimination of the
histone deacetylase Rpd3p differentially affects conformation of GC- and AT-rich domains. Further,
deletion of RPD3 activates expression of GC-rich genes more strongly than AT-rich genes. Analyses
of effects of the histone deacetylase inhibitor trichostatin A, global patterns of Rpd3p binding and
effects of deletion of RPD3 on histone H4 acetylation confirmed that conformation and activity of
GC-rich chromatin are more sensitive to Rpd3p-mediated deacetylation than AT-rich chromatin.
Conclusion: We find that GC-rich and AT-rich chromatin domains display distinct chromatin
conformations and are marked by distinct patterns of histone modifications. We identified the
histone deacetylase Rpd3p as an attenuator of these base composition-dependent differences in
chromatin status. We propose that GC-rich chromatin domains tend to occur in a more active
conformation and that Rpd3p activity represses this propensity throughout the genome.
Background
Chromosomes are characterized by regions that differ in base
composition [1,2]. These so-called isochores correspond to
functionally distinct domains that are cytologically visible as
R- and G-bands [2-4]. Functional differences between the
two types of regions include higher and lower levels of tran-
scription and meiotic recombination and earlier and later fir-
ing of replication origins.
Isochores in the yeast Saccharomyces cerevisiae range in size
from 5-90 kb [5-9]. Clear evidence that isochores are corre-
lated with functional domains comes from studies of meiotic
Published: 18 June 2007
Genome Biology 2007, 8:R116 (doi:10.1186/gb-2007-8-6-r116)
Received: 13 February 2007
Accepted: 18 June 2007
The electronic version of this article is the complete one and can be
found online at />R116.2 Genome Biology 2007, Volume 8, Issue 6, Article R116 Dekker />Genome Biology 2007, 8:R116
phenomena in yeast. Programmed double strand break for-
mation and loading of axial structure proteins are much more
prominent in GC-rich isochores [7,8,10]. Moreover, when a
meiotic recombination hotspot from a GC-rich isochore is
inserted into an AT-rich isochore domain, the site adopts the
lower recombination activity characteristic of its new envi-
ronment [11]. This important experiment implies that iso-
chores exert domain-wide control over genes and elements
located within them.
GC- and AT-rich isochores differ in chromatin structure, with
more open and more compact chromatin in the two types of
regions, respectively [12,13]. Additionally, studies of yeast
isochores by 3C (chromosome conformation capture) analy-
sis have revealed important structural differences [14]. Chro-
matin in AT-rich isochores has a longer apparent persistence
length than that in GC-rich isochores, suggesting that AT-rich
chromatin is less flexible than GC-rich chromatin.
A key feature that affects conformation and activity of chro-
matin is the histone modification state. For example, telom-
eres and sub-telomeric regions are regulated by distinct
histone deacetylases, Sir2p and Hda1p, respectively [15,16].
However, very little is known about the underlying features
that control isochores. Up to now no factors have been iden-
tified that act in an isochore-dependent fashion along chro-
mosome arms.
Here, we present evidence that suggests that GC-rich chroma-
tin is in a more extended conformation than AT-rich chroma-
tin and that GC-rich genes on average tend to be more active,
thereby extending the analogies between yeast and mamma-
lian isochores. Interestingly, we find that GC-rich and AT-rich
regions are marked by distinct levels of a subset of histone
modifications. We then show that the histone deacetylase
Rpd3p has a novel, base composition-dependent effect on
chromatin conformation and gene expression. Comparisons
between wild-type and rpd3
Δ
mutant cells with respect to
chromatin conformation and transcriptional activity, com-
bined with analysis of the Rpd3p binding pattern in the wild
type, led to a model that Rpd3p-dependent histone deacetyla-
tion of GC-rich genes directly promotes a more compact chro-
matin conformation, with a corresponding effect on
transcription. We propose that Rpd3p activity attenuates
more active GC-rich chromatin throughout the genome.
Results
GC-rich isochores have a more extended chromatin
conformation than AT-rich isochores
We analyzed conformation of GC- and AT-rich isochores
along yeast chromosome III using the 3C methodology. 3C is
used to detect the relative frequencies of interaction for dif-
ferent pairs of genomic loci. 3C data can be used to determine
the overall spatial conformation of chromosomes and chro-
mosomal sub-domains [14,17-20]. This approach, as previ-
ously described in detail [21-23], involves three steps. First,
formaldehyde cross-linking is used to trap pairs of interacting
chromatin segments (via protein/protein/DNA cross-links).
Second, cross-linked chromatin is solubilized and then
digested and ligated at low concentration so that cross-linked
segments will be preferentially joined. Third, ligation prod-
ucts are detected and quantified by PCR using pairs of prim-
ers specific to each pair of interacting loci. Relative levels of
different PCR products correspond to the relative interaction
frequencies of the various locus pairs.
We chose to analyze isochore domains along chromosome III
because of their relatively large size (up to 90 kb), which
allows detailed 3C analysis. Our previous analysis of these
isochores revealed structural differences but did not address
whether these differences in interaction frequencies could
reflect differences in chromatin compaction [14]. Here we
addressed this issue in detail. Nuclei were isolated from
alpha-factor arrested (G1) haploid wild-type yeast cells and
3C was performed. Interaction frequencies for pairs of sites
located within the GC- and AT-rich domains along the right
arm of chromosome III (positions 100-190 kb and 190-280
kb, respectively) were measured. When these frequencies are
plotted against the distance between the loci of each pair (the
genomic site separation) an inverse relationship between
interaction frequency and genomic distance is observed.
Moreover, sites located in the GC-rich isochore domain inter-
act less frequently than sites located in the AT-rich isochore
domain (Figure 1a).
We next determined whether the difference in interaction fre-
quencies was simply due to lower levels of formaldehyde
cross-linking in the GC-rich isochore compared to the AT-rich
isochore. We reasoned that formaldehyde cross-linking dur-
ing the 3C procedure would reduce restriction enzyme diges-
tion efficiency due to cross-linking of proteins to restriction
sites and that any differences in cross-linking in GC- and AT-
rich domains should be detectable as differences in their sus-
ceptibilities to restriction enzyme digestion. We first used a
PCR based method that detects partially digested chromatin
to confirm that digestion efficiency is inversely proportional
to the level of cross-linking (Additional data file 2). We then
assessed the digestion efficiencies for several sites located in
the GC-rich and AT-rich regions. The fraction of protected
restriction sites, and thus the level of cross-linking, in the GC-
rich regions was slightly higher than, but not significantly dif-
ferent from, that observed in the AT-rich domain (Additional
data file 1 and 2). Similar previous 3C analyses have also
shown that digestion and cross-linking efficiency is relatively
constant throughout large chromosomal regions [19,24,25].
These results imply that the two types of domains have under-
gone very similar levels of cross-linking and thus that the dif-
ference in interaction frequencies in GC- and AT-rich
domains as detected by 3C reflects a difference in spatial
conformation.
Genome Biology 2007, Volume 8, Issue 6, Article R116 Dekker R116.3
comment reviews reports refereed researchdeposited research interactions information
Genome Biology 2007, 8:R116
Interaction frequencies are proportional to the local concen-
tration of the loci and, therefore, differences in interaction
frequencies within the GC-rich and AT-rich domains are most
straightforwardly attributable to a difference in effective vol-
ume between these domains, with the GC-rich isochore occu-
pying a larger volume per kb of DNA (that is, being less
compact).
Further details of differences in compaction between GC- and
AT-rich domains are provided by analysis of 3C data using a
suitable polymer model [14,26-28]. The model used here
(equation 1) is the same as that used previously [14,26,29],
but is slightly re-arranged in order to allow assessment of
chromatin compaction by including a parameter L that
reflects chromatin compaction:
This model describes chromatin in terms of three key fea-
tures: flexibility, apparent circularity and level of compaction
(expressed in nm/kb). The parameter s is the genomic site
separation between two loci (in kb) and X(s) is the interaction
frequency. The parameter S is the length of the Kuhn's statis-
tical segment in kb, which corresponds to two times the per-
sistence length and is a measure for the flexibility of the
chromatin fiber. The parameter c is the apparent circle size of
the fiber (in kb). In the case of a fiber engaged in an uncon-
strained random walk, c will be infinitely large, in which case
β
equals s/S; any other value of c implies the presence of con-
straints on the path of the chromatin fiber. The parameter k is
the efficiency of cross-linking [14]. Finally, L is the contour
length (in nm) of 1 kb of chromatin, referred to as the mass
density, and is a measure for the level of compaction of the
chromatin fiber. Fitting interaction frequencies to equation 1
yields values for S, c and for [k × L
-3
]. Values for the individual
parameters k and L cannot be directly obtained from this
analysis and the combined parameter [k × L
-3
] will be referred
to as the apparent compaction factor. However, if k is known
to be constant, as appears to be the case in the present study
(above), variations in this combined parameter can be inter-
preted as differences in the value of L.
When interaction frequencies for the GC- and AT-rich
domains, from three independent cultures were fitted to
equation 1 (Figure 1a; Table 1), significant differences
between the two types of domains become apparent. First,
chromatin in the GC-rich domain is significantly more flexi-
ble than chromatin in the AT-rich domain (that is, S is
smaller, P < 0.05). Second, the GC-rich domain appears to be
in a circular conformation, with an apparent circle size of
around 200 kb reflecting the presence of constraints on the
chromatin path, consistent with our previous findings [14].
For the AT-rich domain, in contrast, we had to assume (for
two out of three cultures) that c is infinitely large in order to
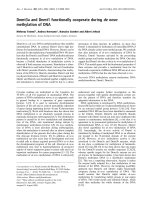
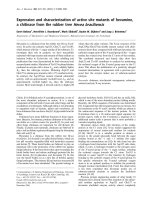
Isochore domains along chromosome III differ in conformation and activityFigure 1
Isochore domains along chromosome III differ in conformation and
activity. (a) Interaction frequencies (the average of three measurements)
between loci located within the AT-rich isochore (positions 100-190 kb)
of chromosome III (filled circles) or within the GC-rich isochore domain
on the right arm of chromosome III (positions 190-280 kb; open circles)
were determined in G1-arrested wild-type cells and plotted against
genomic distance that separates each pair of loci. Error bars are standard
error of the mean (SEM). Dotted and solid lines indicate fits of the data to
equation 1 (Table 1). (b) Yeast genes were grouped in six groups
dependent on the average base composition of the 4 kb region centered
on the start site of the gene is (see Materials and methods). For each
group the average steady state transcript level in wild-type cells was
determined using data obtained by Bernstein et al. [30]. The genome-wide
average transcript level was set at zero. The difference between the most
GC-rich group and the most AT-rich group is statistically significant (P <
0.001). Error bars indicate SEM.
(Log) Transcript level compared
to genome-wide average
(a)
Base composition %G+C
(b)
GC
AT
0 20406080100
Interaction frequency
Site separation (kb)
-0.10
-0.05
0.00
0.05
0.10
<36.6
36.6-37.4
37.5-38.3
38.4-39.2
39.3-40.4
>40.4
0.0
0.2
0.4
0.6
0.8
1.0
1.2
1.4
1.6
Xs k L S() ( ) . exp
/
=× × × × −
⎛
⎝
⎜
⎜
⎞
⎠
⎟
⎟
×
−− −332
2
3
053
2
β
β
nm
with
3
mol
liter
ββ
=×−
⎛
⎝
⎜
⎞
⎠
⎟
s
S
s
c
1
(1)
R116.4 Genome Biology 2007, Volume 8, Issue 6, Article R116 Dekker />Genome Biology 2007, 8:R116
obtain a good fit, implying the apparent lack of such
constraints. Third, an approximately three-fold lower value
for the apparent compaction factor [k × L
-3
] was obtained for
the GC-rich domain than for the AT-rich domain (P < 0.01).
The difference in the value of [k × L
-3
] for the GC- and AT-rich
domain (Table 1) could reflect differences in cross-linking
efficiency (k) or compaction (L). Since no difference in cross-
linking efficiency between GC- and AT-rich domains could be
detected, this analysis indicates that there is a 2.5-fold differ-
ence in the value of L
-3
(average of three independent yeast
cultures) and thus an approximately 1.4-fold difference in the
value of L. In other words, the contour length of 1 kb of chro-
matin in the GC-rich isochore region is approximately 40%
larger than the contour length of 1 kb of chromatin in the AT-
rich isochore.
GC-rich genes are more highly expressed
We next examined functional differences between GC- and
AT-rich isochores by determining the relationship between
base composition of genes and their transcriptional activity
throughout the genome in wild-type yeast cells. First, genes
were divided into categories based on the average base com-
position of the surrounding 4 kb region (that is, the average
base composition of a gene was determined using a 4 kb win-
dow centered around the transcription start site). Genes were
then divided into six groups, approximately equal in size,
based on regional base composition (Figure 1b). Genes
located within 30 kb of telomeres were omitted because these
genes are under epigenetic control due to their close proxim-
ity to telomeric heterochromatin. Excluding such genes, the
final dataset comprised 5,568 open reading frames.
Next we determined average steady-state mRNA levels of
genes in each group. The transcriptional activity of each gene
is known from data obtained by Bernstein et al. [30]. Using
their dataset, we find that expression levels of individual
genes within each group vary widely, but that the most GC-
rich genes as a group are, on average, significantly more tran-
scriptionally active than the most AT-rich isochore group
(Figure 1b). Previously, Marin et al. [31] reported a similar
positive correlation between mRNA levels and GC content of
genes in yeast.
GC-rich and AT-rich chromatin domains are marked
by different levels of histone acetylation
Histone modifications can affect the conformation of chro-
matin fibers and are correlated with gene expression (for
example, [32-35]). Given the differences in chromatin confor-
mation and transcriptional activity of GC- and AT-rich chro-
matin domains, we hypothesized that these domains may also
display differences in histone modification status. We used a
genome-wide dataset of histone modification levels in wild-
type yeast cells obtained by Kurdistani et al. [36] to determine
average histone modification levels of GC- and AT-rich
regions.
Table 1
Analysis of 3C data reveals significant differences between AT- and GC-rich chromatin in wild-type cells as well as significant effects of
deletion of RPD3 on [k × L
-3
] in GC-rich chromatin
Experiment 1 Experiment 2Experiment 3 Average
k × L
-3
Scr
2
k × L
-3
Scr
2
k × L
-3
Scr
2
k × L
-3
Sc
(M
-1
nm
-3
kb
3
)(kb)(kb) (M
-1
nm
-3
kb
3
)(kb)(kb) (M
-1
nm
-3
kb
3
)(kb)(kb) (M
-1
nm
-3
kb
3
)(kb)(kb)
WT-GC 309 3.6 202 0.92 528 4.3 ND 0.71 576 4.9 171 0.96 471 ± 82 4.26 ± 0.38 190
rpd3
Δ
-GC 240 3.7 186 0.9 314 3.9 ND 0.83 171 3.1 155 0.94 241 ± 41 3.6 ± 0.24 171
WT-AT 1,026 4.9 ND 0.89 1,425 5.8 ND 0.64 1,256 6.2 738 0.9 1,235 ± 111 5.6 ± 0.38 738
rpd3
Δ
-AT 1,281 5.5 ND 0.9 1,370 5.8 ND 0.74 1,094 5.3 ND 0.82 1,248 ± 81 5.53 ± 0.15 ND
rpd3
Δ
-AT, AT-rich chromatin in rpd3
Δ
cells; rpd3
Δ
-GC, GC-rich chromatin in rpd3
Δ
cells; WT-AT, AT-rich chromatin in wild-type cells; WT-GC,
GC-rich chromatin in wild-type cells.
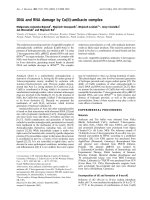
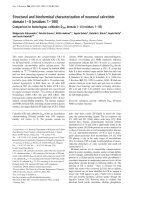
GC-rich and AT-rich genes differ in levels of acetylation of specific histone tail residues in wild-type cellsFigure 2 (see following page)
GC-rich and AT-rich genes differ in levels of acetylation of specific histone tail residues in wild-type cells. Genes were grouped in six groups dependent on
the average base composition of the 4 kb region centered on the start site of the gene. For each group average levels of acetylation of different histone tail
residues were determined using a dataset obtained by Kurdistani and co-workers [36]. (a-d) GC-rich genes display higher levels of H4K8, H4K12, H3K9
and H3K18 acetylation compared to AT-rich genes. (e) Comparison of the average levels of 11 histone modifications for GC-rich genes (GC > 40.4%) and
AT-rich genes (GC < 36.6%). H3 and H4 acetylation is higher for GC-rich genes, whereas H2A and H2B acetylation is not different for the two types of
isochore domains.
Genome Biology 2007, Volume 8, Issue 6, Article R116 Dekker R116.5
comment reviews reports refereed researchdeposited research interactions information
Genome Biology 2007, 8:R116
Figure 2 (see legend on previous page)
-0.09
-0.06
-0.03
0.00
0.06
0.09
0.12
Base composition %G+C
<36.6
36.6-37.4
37.5-38.3
38.4-39.2
39.3-40.4
>40.4
0.03
-0.12
-0.15
Histone modification level
compared to genome-wide average
H4K8
Base composition %G+C
<36.6
36.6-37.4
37.5-38.3
38.4-39.2
39.3-40.4
>40.4
-0.09
-0.06
-0.03
0.00
0.06
0.09
0.12
0.03
-0.12
Histone modification level
compared to genome-wide average
-0.15
H4K12
Base composition %G+C
<36.6
36.6-37.4
37.5-38.3
38.4-39.2
39.3-40.4
>40.4
-0.15
-0.09
-0.06
-0.03
0.00
0.06
0.09
0.12
0.03
-0.12
Histone modification level
compared to genome-wide average
H3K9
Base composition %G+C
<36.6
36.6-37.4
37.5-38.3
38.4-39.2
39.3-40.4
>40.4
-0.15
-0.09
-0.06
-0.03
0.00
0.06
0.09
0.12
0.03
-0.12
Histone modification level
compared to genome-wide average
H3K18
-0.15
-0.10
-0.05
0.00
0.05
0.10
0.15
Histone modification level
compared to genome-wide average
H4K8
H2BK16
H2BK11
H2AK7
H3K27
H3K23
H3K18
H3K14
H3K9
H4K16
H4K12
(a) (b)
(c) (d)
(e)
GC < 36.6%
GC > 40.4%
R116.6 Genome Biology 2007, Volume 8, Issue 6, Article R116 Dekker />Genome Biology 2007, 8:R116
We again divided all genes into six groups based on their base
composition, exactly as described above. For each group we
determined the average level of each of 11 histone modifica-
tions (Figure 2a-d; Additional data file 3). We found that 4 out
of 11 modifications (histone H4 Lys8 (H4K8) and Lys12
(H4K12), and histone H3 Lys9 (H3K9) and Lys18 (H3K18))
are enriched in GC-rich chromatin and depleted in AT-rich
chromatin. The levels of the remaining seven modifications
were not clearly correlated with base composition (histone
H4 Lys16 (H4K16), histone H3 Lys14 (H3K14), LysK23
(H3K23) and Lys27 (H3K27), histone H2A Lys7 (H2AK7),
and histone H2B Lys11 (H2BK11) and Lys16 (H2BK16); Addi-
tional data file 3). Interestingly, modifications of both H3 and
H4 are correlated with base-composition, whereas
modifications of H2A and H2B are not. These results demon-
strate that GC- and AT-rich chromatin domains display dis-
tinct levels of H3 and H4 acetylation (Figure 2e) and provide
additional evidence for structural and functional differences
of isochore domains in yeast.
Deletion of RPD3 exaggerates the difference in
chromatin conformation of GC- and AT-rich domains
The histone deacetylase Rpd3p acts as a repressor of a
number of specific target genes throughout the genome [37-
39]. In addition, Rpd3p has been shown to affect the global
pattern of histone acetylation, over and above its specific
effects at target promoters [40]. This global activity is weak,
affecting histone acetylation levels only up to two-fold. The
significance of these more global weak effects on chromatin
structure and gene expression is not well understood. We
were interested in the possibility that the global effects of
Rpd3p may modulate structural and functional differences
between GC- and AT-rich chromatin. To test this, we used 3C
to analyze changes in chromatin conformation of GC- and AT-
rich domains along chromosome III in an rpd3
Δ
mutant.
Interaction frequencies between sites located in the GC- and
AT-rich isochore domains of chromosome III were deter-
mined and plotted against genomic site separation, as
described above for wild-type cells (Figure 3a-c). As in the
wild type, the GC-rich domain exhibits lower interaction fre-
quencies than the AT-rich domain. However, the magnitude
of the difference in interaction frequencies between the two
domains is greater in the rpd3
Δ
mutant than in the wild type
(compare Figures 3a and 1a; Table 1). This effect can be seen
most clearly by normalizing both datasets to the interaction
frequencies observed in one of the two domains, for example,
the AT-rich domain (see Materials and methods). Such a
comparison reveals that all interaction frequencies in the GC-
rich domain are approximately 25% lower in the rpd3
Δ
mutant than in the wild type (Figure 3b-d). This effect is sta-
tistically significant (P < 0.001; Figure 3d) and was observed
in three independent rpd3
Δ
cultures (Table 1). We also ana-
lyzed a set of interactions along the right arm of chromosome
VI, which is characterized by a high GC-content, and found a
similar significant decrease in interaction frequencies (Figure
3d).
As discussed above, a difference in interaction frequency
between GC- and AT-rich domains could result either from a
difference in chromatin compaction or a difference in cross-
linking efficiency, and the two possibilities can be distin-
guished by assessing the efficiency of restriction digestion.
When such analysis was performed for rpd3
Δ
cells, we again
found, as for wild-type cells, no significant difference in diges-
tion efficiency between GC- and AT-rich isochore domains
(Additional data file 2). We conclude that Rpd3p differen-
tially affects the conformation of these GC-rich and AT-rich
domains, which results in further exaggeration of their differ-
ence in conformation. These observations are important for
two reasons. First, they reveal a previously unrecognized
base-composition-sensitive effect of this histone deacetylase.
Second, they suggest that Rpd3p normally acts to keep the
two types of isochore domains from being even more different
in conformation than they would otherwise tend to be.
To more fully characterize chromatin conformation in rpd3
Δ
cells, interaction frequencies were fitted to equation 1 (Figure
3a-c; Table 1). Flexibility and apparent circularity of chroma-
tin did not significantly change in rpd3
Δ
cells compared to
wild-type cells (Table 1). However, the statistically significant
reduction in interaction frequencies in the GC-rich isochore
compared to the AT-rich isochore resulted in a five-fold dif-
ference in apparent compaction factor [k × L
-3
] compared to
a 2.5-fold difference observed in wild-type cells. Analysis of
data from three wild-type cultures and three rpd3
Δ
cultures
shows that this effect on the fold difference in [k × L
-3
] is
reproducible and significant (P < 0.05). Application of the
restriction digestion assay described above further reveals
that, as for wild-type cells, this difference is not ascribable to
a differential change in efficiency of cross-linking efficiency
(k) (Additional data file 2).
We conclude that the difference in relative compaction L of
the chromatin fiber in the GC- and AT-rich isochores has
changed in rpd3
Δ
cells. Specifically, in rpd3
Δ
cells, the value
of L is 1.7-fold higher, and compaction correspondingly lower,
in the GC-rich isochore compared to the AT-rich isochore.
Deletion of RPD3 most strongly activates transcription
of GC-rich genes
Our results suggest that Rpd3p activity differentially affects
GC-rich and AT-rich chromatin. We next tested whether this
effect was also reflected in differential modulation of expres-
sion of GC- and AT-rich genes throughout the yeast genome.
This question was addressed using a genome-wide dataset
generated in Tsukiyama's laboratory [37] that describes the
effects of deletion of RPD3 on transcription throughout the
yeast genome.
Genome Biology 2007, Volume 8, Issue 6, Article R116 Dekker R116.7
comment reviews reports refereed researchdeposited research interactions information
Genome Biology 2007, 8:R116
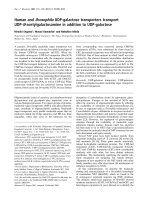
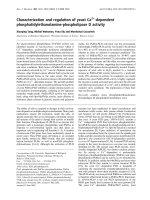
Deletion of RPD3 differentially affects conformation of AT- and GC-rich isochore domainsFigure 3
Deletion of RPD3 differentially affects conformation of AT- and GC-rich isochore domains. (a) Interaction frequencies (the average of three
measurements) between loci located within the AT-rich isochore of chromosome III (filled circles) or within the GC-rich isochore domains on the right
arm of chromosome III (open circles) were determined in G1-arrested rpd3
Δ
cells. Error bars are standard error of the mean. Dotted and solid lines
indicate fits to equation 1 (Table 1). (b) Interaction frequencies between loci located in the AT-rich isochore of chromosome III obtained in rpd3
Δ
cells
(open squares) and wild type cells (filled squares). Data were normalized such that the average Log of the fold difference between wild-type (WT) cells and
rpd3
Δ
cells was zero. Solid and dotted lines indicate fits of the data to equation 1. (c) Interaction frequencies between loci located in the GC-rich isochore
of the right arm of chromosome III obtained in rpd3
Δ
cells (open squares) and WT cells (filled squares) after normalization. Solid and dotted lines indicate
fits of the data to equation 1. (d) Interaction frequencies in the GC-rich isochore on the right arm of chromosomes III and VI (GC (III) and GC (VI)) are
significantly reduced compared to interaction frequencies in the AT-rich isochore on chromosome III (AT (III)). Data from two biological repeats are
shown.
GC
AT
0.0
0.2
0.4
0.6
0.8
1.0
1.2
1.4
0 20406080100
Interaction frequency
Site separation (kb)
(c)
(a) (b)
0 20406080100
Site separation (kb)
rpd3Δ
WT
0 20406080100
Site separation (kb)
-0.20
-0.15
-0.10
-0.05
0.00
0.05
AT (III)
GC (VI)
GC (III)
**
***
Change in interaction frequency
Log(rpd3D/WT)
P<0.001
P<0.01
Interaction frequency
Interaction frequency
(d)
***
P<0.001
AT (III)
GC (III)
Experiment 2Experiment 1
0.0
0.2
0.4
0.6
0.8
1.0
1.2
1.4
1.6
AT-rich isochore
0.0
0.2
0.4
0.6
0.8
rpd3Δ
WT
GC-rich isochore
R116.8 Genome Biology 2007, Volume 8, Issue 6, Article R116 Dekker />Genome Biology 2007, 8:R116
First, we examined whether the genes in the relatively large
90 kb GC-rich and AT-rich isochores along chromosome III
are differentially affected by deletion of RPD3. We calculated
the average change in transcription in rpd3
Δ
versus wild-type
cells along chromosome III as a function of gene position
along the chromosome. Comparison of average base compo-
sition with average global change in transcription shows that
deletion of RPD3 had little effect on transcription of the cen-
tral AT-rich isochore domain. In contrast, transcription in the
GC-rich isochore domains was significantly more increased
(Figure 4a; P < 0.001).
Next we analyzed whether deletion of RPD3 has a general dif-
ferential effect on expression levels of GC- and AT-rich genes
throughout the genome. We calculated the effect of deletion
of RPD3 on expression of the same six groups of genes with
different base compositions as described above (Figure 1b).
We found that all six groups exhibit increased average levels
of transcription in the rpd3
Δ
mutant (genome-wide average
Log(rpd3
Δ
/WT) = 0.08) but that the magnitude of this effect
varies in proportion to GC content. More GC-rich genes are
significantly more up-regulated in rpd3
Δ
cells than more AT-
rich genes (Figure 4b). These data confirm that elimination of
Rpd3p affects most regions of the genome [15,38] and, in
addition, reveal a previously unappreciated fact that base
composition is an important feature in determining the mag-
nitude of this effect.
The base composition-dependent effect of rpd3
Δ
is
independent of gene expression level
To characterize the base-composition sensitive effect of dele-
tion of RPD3 in more detail, we analyzed whether it was
related to the level of expression of genes in wild-type cells.
First, we determined the general relationship between mRNA
levels of genes in wild-type cells and the fold change in
expression in rpd3
Δ
cells. We found that deletion of RPD3
most strongly activated genes that are expressed at relatively
low levels in wild-type cells (Figure 4c), as expected for dele-
tion of a transcriptional repressor. Next we analyzed whether
this relationship is different for GC- and AT-rich genes. Inter-
estingly, for both the most GC-rich and AT-rich groups of
genes we found a similar negative correlation between
transcript level in wild-type cells and increase in transcription
in rpd3
Δ
cells. Importantly, however, for all levels of tran-
scription, GC-rich genes are more up-regulated upon deletion
of RPD3 than AT-rich genes that are expressed at similar lev-
els in wild-type cells (Figure 4d). These observations reveal
that Rpd3p mediates transcriptional control via two inde-
pendent effects. At one level, Rpd3p-mediated inhibition is
correlated with steady-state expression levels of genes. At the
second level, Rpd3p inhibits transcription in a GC content-
dependent manner. The GC content-dependent activity is not
correlated with the steady-state expression level of genes.
These observations suggest that the base composition-
dependent activity of Rpd3p is not dependent on local and
gene-specific control of promoter activity, but instead may be
related to more general features of chromatin conformation
in GC-rich regions of the genome. In that case, we predict that
the base composition-dependent activity of Rpd3p will be
independent of local targeting to specific target genes. To test
this we analyzed the effects of deletion of UME6. Ume6p
recruits Rpd3p to many of its specific target promoters and
the effects of deletion of UME6 display many similarities to
those observed upon deletion of RPD3 [41]. We used a dataset
obtained by Fazzio et al. [37] to determine whether deletion
of UME6 differentially affects GC- and AT-rich genes. Inter-
estingly, we did not find significant base composition-
dependent changes in gene expression (Figure 5). Therefore,
Ume6p-dependent recruitment does not appear to be
involved in base composition-dependent activity of Rpd3p.
We propose that the non-targeted global activity of Rpd3p
affects transcription and chromatin conformation in a base
composition-dependent manner.
Rpd3p binding and Rpd3p-mediated histone
deacetylation are stronger for GC-rich genes
To determine whether the base composition-dependent
effects of Rpd3p are direct and not due to indirect effects of
altered expression of a downstream target gene, we analyzed
the patterns of Rpd3p binding and Rpd3p-mediated histone
H4 deacetylation. Relative levels of Rpd3p-binding through-
out the yeast genome have been determined by Humphrey et
al. [42]. Using these data, we determined the relative average
levels of Rpd3p binding to genes in each of the six base-com-
position-based groups defined above (Figure 1b). We found
that the level of bound Rpd3p is significantly higher for the
most GC-rich genes than for the rest of the genome (P < 0.01;
Figure 6a).
For analysis of Rpd3p-mediated histone H4 acetylation, we
employed a dataset of Bernstein et al. [30], who analyzed H4
acetylation levels in intergenic regions throughout the
genome in wild-type and rpd3
Δ
cells. We found that elimina-
tion of Rpd3p increases H4 acetylation of GC-rich genes more
strongly than that of AT-rich genes (Figure 6b). These
observations imply that Rpd3p binds more strongly to GC-
rich genes, resulting in lower levels of histone acetylation and,
thereby, directly affects chromatin conformation and expres-
sion level of GC-rich genes.
Base-composition-dependent modulation of gene
expression requires histone deacetylase activity and is
specific for Rpd3p
To determine whether the base composition-dependent effect
of rpd3
Δ
is due to loss of histone deacetylase activity, we
investigated the effect of treatment with the histone deacety-
lase inhibitor trichostatin A (TSA) on expression of GC- and
AT-rich genes in wild-type cells. Bernstein and co-workers
[41] have analyzed genome-wide changes in gene expression
at various time points after addition of TSA. We have ana-
lyzed their data in the same way as described above to deter-
Genome Biology 2007, Volume 8, Issue 6, Article R116 Dekker R116.9
comment reviews reports refereed researchdeposited research interactions information
Genome Biology 2007, 8:R116
mine whether TSA treatment differentially affects expression
of GC-rich and AT-rich genes. We found that after 30 and 60
minutes of exposure to TSA, GC-rich genes are more activated
than AT-rich genes, whereas no such effect was observed after
15 minutes (Figure 7a-c). This result confirms that histone
deacetylation plays an important role in differentially modu-
lating GC- and AT-rich genes. We do note that the base com-
position-dependent effect of TSA treatment occurs more
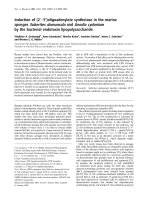
Rpd3p displays base composition-dependent activityFigure 4
Rpd3p displays base composition-dependent activity. (a) Patterns of base composition (line) and gene activation (gray area) in rpd3
Δ
cells along
chromosome III as determined by sliding window analysis using a window size of 30 kb and the transcription start sites as midpoints (step size 1 open
reading frame). The genome-wide dataset describing the effect of deletion of RPD3 was produced by Fazzio et al. [37]. (b) Genes were grouped in six
groups dependent on the average base composition of the 4 kb region centered on the start site of the gene. For each group the average Log of the fold
change in transcription in an rpd3
Δ
mutant compared to wild type was calculated. More GC-rich genes are more activated than more AT-rich genes (P <
10
-13
for the difference between the most GC-rich genes and the most AT-rich genes). (c) The moving average (window size 200, step size 1 open reading
frame) of the Log of the fold change in transcript level in rpd3
Δ
is plotted against transcript level in wild type. (d) A similar analysis as in (c) is performed
with genes that are in the most GC-rich group and in the most AT-rich group (window size of 100 genes). GC-rich genes are more up-regulated in rpd3
Δ
cells.
0.00
0.05
0.10
0.15
-2.0 -1.5 -1.0 -0.5 0.0 0.5 1.0 1.5
Relative transcript level in wild type
Relative transcript level in wild type
GC-rich
AT-rich
(c) (d)
(a)
Base composition %G+C
(b)
%G+C (30 kb window)
0 50 100 150 200 250 300
Position (kb)
-0.05
0.00
0.05
0.10
0.15
0.20
0.25
0.35
0.36
0.37
0.38
0.39
0.40
0.41
0.42
%GC
Change in
transcription
0.43
-0.04
-0.03
-0.02
-0.01
0.00
0.01
0.02
0.03
<36.6
36.6-37.4
37.5-38.3
38.4-39.2
39.3-40.4
>40.4
-0.05
0.00
0.05
0.10
0.15
0.20
-1.5 -1.0 -0.5 0.0 0.5 1.0
Change in expression Log(rpd3Δ/WT)
Change in expression Log(rpd3Δ/WT)
Change in expression Log(rpd3Δ/WT)
Change in expression Log(rpd3Δ/WT)
R116.10 Genome Biology 2007, Volume 8, Issue 6, Article R116 Dekker />Genome Biology 2007, 8:R116
slowly than up-regulation of specific Rpd3p target genes,
which is already observed after 15 minutes of TSA treatment
[41].
TSA inhibits not only Rpd3p, but also another globally acting
histone deacetylase, Hda1p. Therefore, to determine whether
the base composition-dependent effect of TSA treatment is a
result of inhibition of Rpd3p as well as Hda1p, or is
specifically due to inhibition of Rpd3p only, we analyzed the
effects of deletion of HDA1. Using an expression dataset
obtained by Bernstein et al. [41], we found that deletion of
HDA1 does not result in base composition-dependent
changes in gene expression (Figure 7d). This result suggests
that base-composition sensitive activity is specific for the his-
tone deacetylase activity of Rpd3p.
Discussion
We show that yeast isochores share characteristics with those
found in higher eukaryotes in addition to those described
before. Our results indicate that GC-rich and AT-rich
domains are both structurally and functionally distinct. First,
interaction frequencies within GC-rich chromatin tend to be
lower than those in AT-rich chromatin, which is in agreement
with a more extended chromatin conformation, as observed
in higher eukaryotes [12,13]. Second, similar to mammalian
isochores, genes located in the most GC-rich regions of the
yeast genome are, on average, more highly expressed (for
example, [4]). Importantly, we found that GC-rich genes dis-
play higher levels of H3 and H4 acetylation compared to more
AT-rich genes. Finally, we identify Rpd3p as a molecular
component involved in base composition-dependent control
of chromatin structure and function. This role of Rpd3p may
be conserved in higher eukaryotes as it is also associated with
less condensed interbands in Drosophila [43]. This activity
Deletion of UME6 does not differentially affect GC- and AT-rich genesFigure 5
Deletion of UME6 does not differentially affect GC- and AT-rich genes.
Average change in gene expression levels in ume6
Δ
cells compared to wild
type for each of the six groups of genes with increasing GC content.
Expression data are from Fazzio et al. [37].
-0.03
-0.02
-0.01
0.00
0.01
0.02
0.03
Base composition %G+C
<36.6
36.6-37.4
37.5-38.3
38.4-39.2
39.3-40.4
>40.4
Change in expression in ume6D
Log(ume6Δ/WT)
Rpd3p binding in wild-type and histone acetylation in rpd3
Δ
cells in AT-rich and GC-rich isochorsFigure 6
Rpd3p binding in wild-type and histone acetylation in rpd3
Δ
cells in AT-
rich and GC-rich isochors. (a) Average levels of Rpd3p binding to each of
the six groups of genes with increasing GC content. Rpd3p binding data
are from Humphrey et al. [42]. (b) Average change in H4 acetylation of
the upstream region of each of the six groups of genes with increasing GC
content. Acetylation data were obtained by Bernstein et al. [30].
(a)
(b)
-0.03
-0.02
-0.01
0.00
0.01
0.02
0.03
0.04
0.05
(Log) Relative Rpd3p binding
compared to genome-wide average
Base composition %G+C
<36.6
36.6-37.4
37.5-38.3
38.4-39.2
39.3-40.4
>40.4
-0.03
-0.02
-0.01
0.00
0.01
0.02
Base composition %G+C
<36.6
36.6-37.4
37.5-38.3
38.4-39.2
39.3-40.4
>40.4
Change in H4-Acetylation Log(rpd3Δ/WT)
compared to genome-wide average
Genome Biology 2007, Volume 8, Issue 6, Article R116 Dekker R116.11
comment reviews reports refereed researchdeposited research interactions information
Genome Biology 2007, 8:R116
Inhibition of the histone deacetylase activity of Rpd3p results in base composition-dependent gene activationFigure 7
Inhibition of the histone deacetylase activity of Rpd3p results in base composition-dependent gene activation. The dataset describing changes in gene
expression upon TSA treatment was obtained from Bernstein et al. [41]. Genes were divided into six groups dependent upon their base composition (as
in Figure 1b) and per group the average change in gene expression upon TSA treatment was determined. Error bars are standard error of the mean. Cells
were treated for (a) 15 minutes, (b) 30 minutes and (c) 60 minutes with TSA. (d) Average change in gene expression levels in hda1
Δ
cells for each of the
six groups of genes with increasing GC content. Expression data are from Bernstein et al. [41].
-0.02
-0.01
0.00
0.01
0.02
Base composition %G+C
<36.6
36.6-37.4
37.5-38.3
38.4-39.2
39.3-40.4
>40.4
Base composition %G+C
<36.6
36.6-37.4
37.5-38.3
38.4-39.2
39.3-40.4
>40.4
Base composition %G+C
<36.6
36.6-37.4
37.5-38.3
38.4-39.2
39.3-40.4
>40.4
Change in transcript level
(Log(treated/untreated))
15 minutes TSA 30 minutes TSA
60 minutes TSA
-0.03
-0.02
-0.01
0.00
0.01
0.02
0.03
Change in expression Log(hda1Δ/WT)
Base composition %G+C
<36.6
36.6-37.4
37.5-38.3
38.4-39.2
39.3-40.4
>40.4
(d)
-0.02
-0.01
0.00
0.01
0.02
Change in transcript level
(Log(treated/untreated))
-0.02
-0.01
0.00
0.01
0.02
Change in transcript level
(Log(treated/untreated))
hda1
Δ
(b)(a)
(c)
R116.12 Genome Biology 2007, Volume 8, Issue 6, Article R116 Dekker />Genome Biology 2007, 8:R116
appears to be specific for Rpd3p as we did not detect a base
composition-dependent activity of another globally acting
histone deacetylase, Hda1p.
Rpd3p has been shown to have two distinct modes of action.
First, Rpd3p is recruited to specific target genes to modulate
their expression. Second, Rpd3p acts in a global and non-tar-
geted fashion to deacetylate bulk chromatin. We propose that
the base composition-dependent effects of Rpd3p are related
to its global activities. First, the magnitudes of these GC-con-
tent dependent effects are subtle, similar to the previously
described effects of Rpd3p on global histone acetylation [40].
Second, deletion of Ume6p, a protein involved in recruitment
of Rpd3p to many of its specific target genes [38], does not
result in up-regulation of GC-rich genes, indicating that
Rpd3p interacts with GC-rich genes in a Ume6p-independent
manner. Third, the GC content-dependent effects are not
correlated with the steady-state expression of genes, and thus
seem unrelated to local promoter controls.
We favor the model that the global and untargeted activity of
Rpd3p acts predominantly and/or has the largest effect on
GC-rich chromatin. First, Rpd3p binds GC-rich genes more
prominently than AT-rich genes. Second, deletion of RPD3
results in increased H4 acetylation, particularly of GC-rich
genes. Finally, treatment of wild-type cells with the histone
deacetylase inhibitor TSA activates GC-rich genes more
strongly than AT-rich genes. However, we did observe that
TSA induced activation of GC-rich genes requires more time
than induction of many direct target Rpd3p genes. This rela-
tively slow effect could be interpreted to mean that the base
composition-dependent effects of deletion of RPD3 are indi-
rect and are due to altered expression of a specific Rpd3p tar-
get gene that, in turn, encodes a protein that acts in a GC
content-dependent fashion. Alternatively, and consistent
with the Rpd3p localization and acetylation data, Rpd3p does
directly affect expression of GC-rich genes, but this more glo-
bal and non-targeted process occurs at a longer time scale or
requires passage through a specific phase of the cell cycle.
An alternative or additional molecular explanation of the
observed phenomena is related to potential base composi-
tion-dependent differences in wrapping of DNA around his-
tones. AT-rich DNA may be more flexibly and more easily
wrapped around nucleosomes than GC-rich DNA [44]. This
physical model implies intrinsic differences in nucleosome
organization dependent on base composition and does not
require that histone modifying enzymes act in a base compo-
sition-dependent fashion per se. In this model, histone
modifying enzymes recognize differences in intrinsic confor-
mation of GC- and AT-rich chromatin. Rpd3p may preferen-
tially act on the nucleosome organization of GC-rich
chromatin. Similarly, acetyl transferases may preferentially
modify GC-rich domains in wild type, resulting in higher lev-
els of histone H3 and H4 acetylation, as we observed here.
Based on these considerations, we predict the presence of his-
tone acetyl transferases that act most prefentially on GC-rich
chromatin.
In light of these observations, we can interpret our 3C analy-
sis more precisely. The 3C results show that deletion of RPD3
differentially affected the conformation of GC- and AT-rich
isochore domains along chromosome III, but did not allow
determination of which of the two types of domains, or both,
displayed an altered conformation. When Rpd3p activity
affects GC-rich genes most prominently, the most parsimoni-
ous explanation of our 3C data is that deletion of RPD3 most
strongly affects the conformation of the GC-rich domain,
resulting in a more extended and transcriptionally active
chromatin conformation, consistent with predicted relation-
ships between transcription, histone acetylation and chroma-
tin conformation.
GC-rich chromatin displays lower interaction frequencies, as
detected by 3C, than AT-rich chromatin. Analysis of cross-
linking efficiency suggests that both types of domains are
cross-linked with similar frequencies (Additional data file 2)
and, therefore, have similar protein densities. Histones are
the most abundant chromatin proteins, and thus our results
suggest that GC-rich and AT-rich regions have similar levels
of histone binding. Consistent with this hypothesis, Nagy et
al. [45] found no correlation between base composition and
regions depleted in nucleosomes. Previously, we found a
decrease in interaction frequencies upon activation of the
FMR1 gene in human cells [19], similar to the observed
changes in rpd3
Δ
cells described here, suggesting that
reduced 3C interaction frequencies may be a general charac-
teristic of active chromatin.
The base composition-dependent effect of Rpd3p activity
affects expression of genes independent of their steady state
level of expression. Genes with the same steady state expres-
sion level in wild type are more strongly repressed by Rpd3p
when they are GC-rich than when they are AT-rich. This
implies that GC-rich genes are intrinsically more active, con-
sistent with higher steady state levels of H3 and H4 acetyla-
tion, as we observed here, and that Rpd3p acts as an
attenuator of these genes. Based on these considerations, we
propose that chromatin status is regulated through a homeo-
static and highly dynamic mechanism involving counteract-
ing activating and repressing activities. A similar model of
dynamic global acetylation and deacetylation has been pro-
posed by Katan-Khaykovich and Struhl [46] and by Clayton et
al. [47].
Conclusion
The findings described here uncover novel GC content-
dependent differences in chromatin conformation, regula-
tion, histone modification status and transcription. These
findings are significant from four perspectives. First, they
provide new information about the nature and functional
Genome Biology 2007, Volume 8, Issue 6, Article R116 Dekker R116.13
comment reviews reports refereed researchdeposited research interactions information
Genome Biology 2007, 8:R116
significance of base composition variation along chromo-
somes. Second, they show that GC-rich chromatin is most
acetylated and is attenuated by the histone deacetylase
Rpd3p, thus providing a first clue as to how regions with dif-
ferent base-compositions are differentially regulated. Third,
they show that the roles of Rpd3p can be separated into inde-
pendent components, with a GC-content-dependent global
activity layered on top of its targeted and gene specific effects.
Finally, they suggest that functional and structural differ-
ences between GC- and AT-rich regions are determined in
part by balances between activating and repressing activities.
Materials and methods
Strains
Yeast strains were derived from SK1. The genotype of the
wild-type strain (NKY2997) is: MATa, ho::LYS2, lys2, ura3,
nuc1::LEU2. The genotype of the rpd3
Δ
strain (JDY172) is
MATa, ho::LYS2, lys2, ura3, nuc1::LEU2, rpd3::KanMX4.
The RPD3 gene was deleted using a standard PCR based gene
disruption strategy [48].
3C analysis
Nuclei were isolated from G1-arrested cells and 3C analysis
was performed as described previously [14]. A control PCR
template was generated by digestion and random ligation of
purified yeast genomic DNA (NKY2997). All templates were
titrated to determine the linear range of PCR. PCR products
were quantified on 1.5% agarose gels in the presence of ethid-
ium bromide. Interaction frequencies were calculated in trip-
licate by determination of the ratio of the amount of PCR
product obtained with the 3C template divided by the amount
of PCR product obtained with the control template [14].
Reproducibility was confirmed by analysis of three independ-
ent wild-type cultures and three rpd3
Δ
cultures. Data from
wild-type cells and rpd3
Δ
cells was normalized so that the
average Log of the fold difference in interaction frequencies in
rpd3
Δ
cells compared to wild-type cells for loci in the AT-rich
domain of chromosome III was zero.
Sliding window analysis and generation of isochore
groups
The chromosomal position of each open reading frame was
defined as its 5' start site. Base composition was determined
using EMBOSS Isochore [49] with a window size of 4 kb and
a step size of 1 kb. As a result, base composition values are
assigned every 1 kb. To determine the regional base composi-
tion of each gene, the base composition value determined for
the position closest to its 5' start site was chosen.
Analysis of microarray data
For each open reading frame the fold change in transcription
in an rpd3
Δ
mutant compared to wild type was obtained from
a dataset generated by Fazzio and co-workers [37] and log-
transformed. Sliding window analysis was used to plot
regional effects of deletion of RPD3 along chromosomes III
(Figure 4a). A window of 30 kb was selected. The step size was
1 open reading frame.
Steady-state transcription levels in exponentially growing
wild-type cells were obtained by Bernstein and co-workers
[30]. Histone acetylation levels in wild-type cells were deter-
mined by Kurdistani and co-workers [36]. Rpd3p binding to
intergenic regions was determined using data obtained by
Humphrey and co-workers [42]. The change in the level of
histone H4 acetylation of intergenic regions in rpd3
Δ
cells
was determined using data obtained by Bernstein et al. [30].
Rpd3p binding and change in acetylation levels were assigned
to a downstream open reading frame as described in [30,42].
Datasets describing the effect of TSA treatment on gene
expression were obtained by Bernstein et al. [41]. Data were
log-transformed and zero-centered.
Additional data files
The following additional data are available with the online
version of this paper. Additional data file 1 describes the
methodology used to quantify cross-linking efficiency in GC-
and AT-rich domain in wild-type and rpd3
Δ
cells. Additional
data file 2 is a figure showing the relationship between the
level of cross-linking and the efficiency with which chromatin
is digested. This figure also displays the digestion efficiencies
of GC- and AT-rich chromatin in wild-type and rpd3
Δ
cells.
Additional data file 3 displays the level of seven histone mod-
ifications in relation to base composition.
Additional data file 1Methodology used to quantify cross-linking efficiency in GC- and AT-rich domains in wild-type and rpd3
Δ
cellsMethodology used to quantify cross-linking efficiency in GC- and AT-rich domains in wild-type and rpd3
Δ
cells.Click here for fileAdditional data file 2Relationship between the level of cross-linking and the efficiency with which chromatin is digested and the digestion efficiencies of GC- and AT-rich chromatin in wild-type and rpd3
Δ
cellsRelationship between the level of cross-linking and the efficiency with which chromatin is digested and the digestion efficiencies of GC- and AT-rich chromatin in wild-type and rpd3
Δ
cells. For details see Additional data file 1.Click here for fileAdditional data file 3Level of seven histone modifications in relation to base compositionLevel of seven histone modifications in relation to base composition.Click here for file
Acknowledgements
Nancy Kleckner is gratefully acknowledged for support and advice. Marian
Walhout, Jason Perry and members of the Dekker lab are acknowledged
for discussions and careful reading of the manuscript. This work relied on
all those who have made their genome-wide datasets publicly available. Ini-
tial experiments were performed in the laboratory of Nancy Kleckner and
were directly supported by grants from the National Institutes of Health
(GM25326 and GM44794) to Nancy Kleckner. Most of this work was sup-
ported by grants from the National Institutes of Health (HG003143) and
the Medical Foundation to JD.
References
1. Bernardi G: Isochores and the evolutionary genomics of
vertebrates. Gene 2000, 241:3-17.
2. Holmquist GP: Chromosome bands, their chromatin flavors,
and their functional features. Am J Hum Genet 1992, 51:17-37.
3. Hurst LD, Pal C, Lercher MJ: The evolutionary dynamics of
eukaryotic gene order. Nat Rev Genet 2004, 5:299-310.
4. Versteeg R, van Schaik BD, van Batenburg MF, Roos M, Monajemi R,
Caron H, Bussemaker HJ, van Kampen AH: The human transcrip-
tome map reveals extremes in gene density, intron length,
GC content, and repeat pattern for domains of highly and
weakly expressed genes. Genome Res 2003, 13:1998-2004.
5. Dujon B: The yeast genome project: what did we learn? Trends
Genet 1996, 12:263-270.
6. Sharp PM, Lloyd AT: Regional base composition variation along
yeast chromosome III: evolution of chromosome primary
structure. Nucleic Acids Res 1993, 21:179-183.
7. Baudat F, Nicolas A: Clustering of meiotic double-strand
breaks on yeast chromosome III. Proc Natl Acad Sci USA 1997,
94:5213-5218.
8. Gerton JL, DeRisi J, Shroff R, Lichten M, Brown PO, Petes TD: global
R116.14 Genome Biology 2007, Volume 8, Issue 6, Article R116 Dekker />Genome Biology 2007, 8:R116
mapping of meiotic recombination hotspots and coldspots in
the yeast Saccharomyces cerevisiae. Proc Natl Acad Sci USA 2000,
97:11383-11390.
9. Bradnam KR, Seoighe C, Sharp PM, Wolfe KH: G+C content vari-
ation along and among Saccharomyces cerevisiae chromo-
somes. Mol Biol Evol 1999, 16:666-575.
10. Blat Y, Protacio RU, Hunter N, Kleckner N: Physical and func-
tional interactions among basic chromosome organizational
features govern early steps of meiotic chiasma formation.
Cell 2002, 111:791-802.
11. Borde V, Wu TC, Lichten M: Use of a recombination reporter
insert to define meiotic recombination domains on chromo-
some III of Saccharomyces cerevisiae. Mol Cell Biol 1999,
19:4832-4842.
12. Yokota H, Singer MJ, van den Engh GJ, Trask BJ: Regional differ-
ences in the compaction of chromatin in human G0/G1 inter-
phase nuclei. Chromosome Res 1997, 5:157-166.
13. Gilbert N, Boyle S, Fiegler H, Woodfine K, Carter NP, Bickmore WA:
Chromatin architecture of the human genome; gene-rich
domains are enriched in open chromatin fibers. Cell 2004,
118:555-566.
14. Dekker J, Rippe K, Dekker M, Kleckner N: Capturing chromo-
some conformation. Science 2002, 295:1306-1311.
15. Robyr D, Suka Y, Xenarios I, Kurdistani S, Wang A, Suka N, Grunstein
M: Microarray deacetylation maps determine genome-wide
functions for yeast histone deacetylases. Cell 2002,
109:437-446.
16. Rusche LN, Kirchmaier AL, Rine J: The establishment, inherit-
ance, and function of silenced chromatin in Saccharomyces
cerevisiae. Annu Rev Biochem 2003, 72:481-516.
17. Dekker J: A closer look at long-range chromosomal
interactions. Trends Biochem Sci 2003, 28:277-280.
18. Dekker J: The 3 C's of chromosome conformation capture:
controls, controls, controls. Nat Methods 2006, 3:17-21.
19. Gheldof N, Tabuchi TM, Dekker J: The active FMR1 promoter is
associated with a large domain of altered chromatin confor-
mation with embedded local histone modifications. Proc Natl
Acad Sci USA 2006, 103:12463-12468.
20. Dostie J, Richmond TA, Arnaout RA, Selzer RR, Lee WL, Honan TA,
Rubio EH, Krumm A, Lamb J, Nusbaum C, et al.: Chromosome con-
formation capture carbon copy (5C): a massively parallel
solution for mapping interactions between genomic
elements. Genome Res 2006, 16:1299-1309.
21. Miele A, Gheldof N, Tabuchi TM, Dostie J, Dekker J: Mapping chro-
matin interactions by chromosome conformation capture
(3C). In Current Protocols in Molecular Biology Issue supplement 74
Edited by: Ausubel FM, Brent R, Kingston RE, Moore DD, Seidman JG,
Smith JA, Struhl K. Hoboken, NJ: John Wiley and Sons; 2006:21.11-
1-21.11-20.
22. Dostie J, Dekker J: Mapping networks of physical interactions
between genomic elements using 5C technology. Nat Protoc
2007, 2:988-1002.
23. Splinter E, Grosveld F, de Laat W: 3C technology: analyzing the
spatial organization of genomic loci in vivo. Methods Enzymol
2004, 375:493-507.
24. Palstra RJ, Tolhuis B, Splinter E, Nijmeijer R, Grosveld F, de Laat W:
The beta-globin nuclear compartment in development and
erythroid differentiation. Nat Genet 2003, 35:190-194.
25. Vakoc C, Letting DL, Gheldof N, Sawado T, Bender MA, Groudine M,
Weiss MJ, Dekker J, Blobel GA: Proximity among distant regu-
latory elements at the beta-globin locus requires GATA-1
and FOG-1. Mol Cell 2005, 17:453-462.
26. Rippe K: Making contacts on a nucleic acid polymer. Trends Bio-
chem Sci 2001, 26:733-740.
27. van den Engh G, Sachs R, Trask BJ:
Estimating genomic distance
from DNA sequence location in cell nuclei by a random walk
model. Science 1992, 257:1410-1412.
28. Sachs RK, van den Engh G, Trask B, Yokota H, Hearst JE: A random-
walk/giant-loop model for interphase chromosomes. Proc
Natl Acad Sci USA 1995, 92:2710-2714.
29. Ringrose L, Chabanis S, Angrand PO, Woodroofe C, Stewart AF:
Quantitative comparison of DNA looping in vitro and in vivo:
chromatin increases effective DNA flexibility at short
distances. EMBO J 1999, 18:6630-6641.
30. Bernstein BE, Humphrey EL, Erlich RL, Schneider R, Bouman P, Liu JS,
Kouzarides T, Schreiber SL: Methylation of histone H3 Lys 4 in
coding regions of active genes. Proc Natl Acad Sci USA 2002,
99:8695-8700.
31. Marin A, Gallardo M, Kato Y, Shirahige K, Gutierrez G, Ohta K, Aguil-
era A: Relationship between G+C content, ORF-length and
mRNA concentration in Saccharomyces cerevisiae. Yeast 2003,
20:703-711.
32. Tse C, Sera T, Wolffe AP, Hansen JC: Disruption of higher-order
folding by core histone acetylation dramatically enhances
transcription of nucleosomal arrays by RNA polymerase III.
Mol Cell Biol 1998, 18:4629-4638.
33. Jenuwein T, Allis CD: Translating the histone code. Science 2001,
293:1074-1080.
34. Hansen JC: Conformational dynamics of the chromatin fiber
in solution: determinants, mechanisms, and functions. Annu
Rev Biophys Biomol Struct 2002, 31:361-392.
35. Shogren-Knaak M, Ishii H, Sun JM, Pazin MJ, Davie JR, Peterson CL:
Histone H4-K16 acetylation controls chromatin structure
and protein interactions. Science 2006, 311:844-847.
36. Kurdistani SK, Tavazoie S, Grunstein M: Mapping global histone
acetylation patterns to gene expression. Cell 2004,
117:721-733.
37. Fazzio TG, Kooperberg C, Goldmark JP, Neal C, Basom R, Delrow J,
Tsukiyama T:
Widespread collaboration of Isw2 and Sin3-Rpd3
chromatin remodeling complexes in transcriptional
repression. Mol Cell Biol 2001, 21:6450-6460.
38. Kurdistani SK, Robyr D, Tavazoie S, Grunstein M: Genome-wide
binding map of the histone deacetylase Rpd3 in yeast. Nat
Genet 2002, 31:248-254.
39. Robert F, Pokholok DK, Hannett NM, Rinaldi NJ, Chandy M, Rolfe A,
Workman JL, Gifford DK, Young RA: Global position and recruit-
ment of HATs and HDACs in the yeast genome. Mol Cell 2004,
16:199-209.
40. Vogelauer M, Wu J, Suka N, Grunstein M: Global histone
acetylation and deacetylation in yeast. Nature 2000,
408:495-498.
41. Bernstein BE, Tong JK, Schreiber SL: Genomewide studies of his-
tone deacetylase function in yeast. Proc Natl Acad Sci USA 2000,
97:13708-13713.
42. Humphrey EL, Shamji AF, Bernstein BE, Schreiber SL: Rpd3p reloca-
tion mediates a transcriptional response to rapamycin in
yeast. Chem Biol 2004, 11:295-299.
43. Pile LA, Wassarman DA: Chromosomal localization links the
SIN3-RPD3 complex to the regulation of chromatin conden-
sation, histone acetylation and gene expression. EMBO J 2000,
18:6131-6140.
44. Vinogradov AE: Noncoding DNA, isochores and gene expres-
sion: nucleosome formation potential. Nucleic Acids Res 2005,
33:559-563.
45. Nagy PL, Cleary ML, Brown PO, Lieb JD: Genomewide demarca-
tion of RNA polymerase II transcription units revealed by
physical fractionation of chromatin. Proc Natl Acad Sci USA 2003,
100:6364-6369.
46. Katan-Khaykovich Y, Struhl K: Dynamics of global histone
acetylation and deacetylation in vivo: rapid restoration of
normal histone acetylation status upon removal of activa-
tors and repressors. Genes Dev 2002, 16:743-752.
47. Clayton AL, Hazzalin CA, Mahadevan LC: Enhanced histone
acetylation and transcription: a dynamic perspective.
Mol Cell
2006, 23:289-296.
48. Wach A, Brachat A, Pohlmann R, Philippsen P: New heterologous
modules for classical or PCR-based gene disruptions in Sac-
charomyces cerevisiae. Yeast 1994, 10:1793-1808.
49. Rice P, Longden I, Bleasby A: EMBOSS: the European Molecular
Biology Open Software Suite. Trends Genet 2000, 16:276-277.