Báo cáo y học: "Impacts of yeast metabolic network structure on enzyme evolution" ppt
Bạn đang xem bản rút gọn của tài liệu. Xem và tải ngay bản đầy đủ của tài liệu tại đây (150.9 KB, 4 trang )
Genome Biology 2007, 8:407
Correspondence
Impacts of yeast metabolic network structure on enzyme evolution
Chenqi Lu*, Ze Zhang
†
, Lindsey Leach
‡
, MJ Kearsey
‡
and ZW Luo*
‡
A comment on D Vitkup, P Kharchenko and A Wagner: Influence of metabolic network structure and function on enzyme
evolution. Genome Biol 2006, 7:R39.
Addresses: *Laboratory of Population and Quantitative Genetics, School of Life Sciences, Institute of Biostatistics, Fudan University,
Shanghai 200433, China.
†
The Key Sericultural Laboratory of the Agricultural Ministry, Southwest University, Chongqing 400716, China.
‡
School of Biosciences, University of Birmingham, Edgbaston, Birmingham B15 2TT, UK.
Correspondence: ZW Luo. Email:
Published: 9 August 2007
Genome Biology 2007, 8:407 (doi:10.1186/gb-2007-8-8-407)
The electronic version of this article is the complete one and can be
found online at />© 2007 BioMed Central Ltd
Recently, Vitkup et al. [1] investigated
the influence of the yeast metabolic
network structure and function on
enzyme evolution. They calculated
connectivity for each enzyme as the
number of other metabolic enzymes
that produce or consume its products or
reactants and used it as its centrality
measure in the network. They found
that highly connected enzymes evolve
more slowly than less connected
enzymes, are less likely to be essential
compared to less connected enzymes,
and are more likely to retain duplicates
in evolution.
Metabolic networks exhibit a
hierarchical modular structure in which
some enzymes perform very specific
local functions, relevant only within a
particular pathway, whereas others may
possess a global high-level role, perhaps
acting as mediators of distinct pathways
[2]. In the graph theory, the between-
ness centrality measure of a node is
defined as the number of shortest paths
going through that node and is more
appropriate for measuring the relative
importance of a node in a network with
hierarchical structure, such as a
metabolic network [3].
We first investigated whether signifi-
cant modularity existed in the yeast
metabolic network and found that the
most likely modularity parameter Q was
estimated to be 0.31, suggesting a
significant modular structure in the
network (Figure 1). Q will take an
expected value of zero in any random
network without modular structure. We
calculated the Q values for each of
1,000 simulated random networks with
the same size as the yeast network but
without any modular structure. The
maximum value of Q observed in these
simulations was 0.12, indicating the
presence of significant modularity in
the real network.
We observed only a modest correlation
between betweenness and connectivity
values for each node in the metabolic
network of the yeast Saccharomyces
cerevisae (r = 0.46, P < 0.0001) as
illustrated in Additional data file 4. To
interpret the poor correlation, we
simulated a random scale-free network
based on the parameters defining the
yeast metabolic network, but without
considering its hierarchical structure,
using the Pajek tool [4,5]. We calculated
the correlation coefficient between the
two measures in the simulated network
and found it to be highly significant (see
Additional data file 4, r = 0.95, P Х 0).
These findings suggest that the connec-
tivity is not a good approximation for
the betweenness as a measure of
centrality for enzymes in the yeast
metabolic network.
We calculated the correlation between
the betweenness and the K
a
/K
s
ratio
(the ratio of nonsynonymous to synony-
mous substitutions) for each enzymatic
gene in the metabolic network. The
K
a
/K
s
values were computed using
orthologous sequences of the yeasts S.
cerevisiae and S. paradoxus from Kellis
et al. [6] and were used as an estimate
of evolutionary constraint. Additional
data file 5 demonstrates a statistically
significant negative correlation between
K
a
/K
s
and betweenness of an enzyme
(Spearman’s rank correlation r = -0.18,
P < 0.002), providing clear evidence
that high-betweenness enzymes evolve
slowly. In the same dataset, we also
observed a significantly negative corre-
lation between connectivity and evolu-
tionary constraint of an enzyme (Spear-
man’s rank correlation r = -0.13,
P < 0.02, Additional data file 5) as in
[1]. Furthermore, partial correlation
analyses indicate that while there is a
significant correlation between evolu-
tionary constraint and betweenness
after controlling for connectivity (Spear-
man’s partial correlation r = -0.14,
P < 0.02), no such correlation is seen
between the constraint and connectivity
after controlling for betweenness
(r = -0.03, P = 0.59).
It is noteworthy that the proportion of
variation in the evolutionary constraint
of the genes attributable to the network
parameter is limited (R
2
= 3.24%).
There are probably at least two reasons
for this limited explanatory power.
First, many factors may affect the
evolutionary constraint of a gene in
general (see below). Second, when the
metabolic network was analyzed as a
graph all genes in the network were
equally treated without considering
differences in their functions. Neverthe-
less, the present study reveals that the
structural feature of genes in a bio-
logical network is one of the significant
and independent determinants for their
evolution. It is well known that the
evolutionary constraint of a protein can
be affected by many factors, among
which, variation in expression (mRNA)
level is the dominant factor that
explains variation in the evolutionary
constraint of yeast proteins [7]. Using
the gene-expression datasets [8], we
found a significant correlation between
betweenness and expression level
among the enzymatic genes (Spearman’s
rank correlation r = 0.14, P < 0.002).
Moreover, a partial correlation analysis
controlling variation in gene expression
still supports the negative correlation
between betweenness and evolutionary
constraint (Spearman’s partial correla-
tion r = -0.15, P < 0.01).
We divided the enzymatic genes into
essential and nonessential groups
according to Giaever et al. [9,10], and
found that the essential enzymatic
genes had significantly higher
betweenness than the nonessential
enzymatic genes (nonparametric Mann-
Whitney U test, P < 0.0004, Figure 2a).
In other words, the relative structural
importance of an enzymatic gene in the
yeast metabolic network can partially
explain its functional essentiality. In
sharp contrast, the essential enzymatic
genes had significantly smaller values of
connectivity than the nonessential
group (nonparametric Mann-Whitney
U test, P < 0.04, Figure 2a) as conclu-
ded in [1].
We found that the mean betweenness of
duplicated enzymatic genes is 0.0038,
and for non-duplicated enzymatic genes
the mean is 0.0050 (nonparametric
Mann-Whitney U test, P < 0.00002,
Figure 2b). This indicates that enzyme-
coding genes with low betweenness are
more likely to retain duplicates in the
407.2 Genome Biology 2007, Volume 8, Issue 8, Article 407 Lu et al. />Genome Biology 2007, 8:407
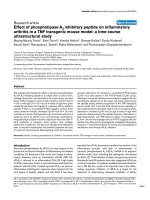
Figure 1
Plot of the modularity and a dendrogram for enzymatic genes in the yeast metabolic network. (a) A
plot of the modularity against the number of branches. The peak (red line) in the modularity was
used to identify the communities. (b) A dendrogam for enzymatic genes in the network constructed
on the basis of the Q statistic. The numbers on the right of the dendrogram denote the number of
nodes linked by each tip.
Modularity
0.30
0.20
0.25
1
1
1
1
1
1
1
4
144
1
1
1
1
2
1
1
1
2
1
1
1
1
1
1
1
3
1
1
1
24
3
1
1
54
1
1
1
118
2
2
4
2
1
1
1
2
5
5
6
8
4
6
12
4
4
3
1
21
5
3
1
135
1
1
1
(a)
(b)
evolution of yeast. Analysis with
connectivity shows that the mean
connectivity for the duplicate enzymatic
genes is 26.89, whereas the mean
becomes 18.36 for the non-duplicated
enzymatic genes (nonparametric Mann-
Whitney U test, P < 0.0002, Figure 2b).
We calculated the clustering coefficient
(CC), another measure for network
characteristics, for every enzyme gene
in the yeast metabolic network according
to the method [11] and list the estimates
in Additional data file 3. This measure
is closely correlated with connectivity
(r = 0.83, P ≈ 0), as expected from the
definitions of the two measures, but is
poorly correlated with betweenness
(r = 0.16, P < 0.001). These findings
make it clear that betweenness depicts
largely different characteristics of the
metabolic network from the other two
network statistics.
In general, the current analysis stresses
the need to consider the global impact of
an enzymatic gene in the complex meta-
bolic network and demonstrates that use
of betweenness has led to an opposing
interpretation of the enzymes’ evolution-
ary characteristics. Although the obser-
vations made in the present study are
quite different from those in [1], it must
be noted that the difference does not
necessarily mean that one method has
greater validity than the other.
Additional data files
Additional data are available online
with this paper. Additional data file 1
contains Materials and methods for the
analyses carried out. Additional data
file 2 describes the method for the
creation of a directed enzyme network
from a metabolic network that was used
in this study. Additional data file 3
provides original data of network and
evolutionary parameters for 580
enzymatic genes in the yeast network.
Additional data file 4 contains a figure
depicting the correlation between
enzyme connectivity and betweenness
in the yeast metabolic network and a
random scale-free network. Additional
data file 5 contains a figure illustrating
the relationship between K
a
/K
s
and
both the betweenness and the
connectivity.
Acknowledgements
We are grateful for the criticisms and comments
made by two anonymous reviewers, which have
helped improve the paper greatly. This study is
supported by China’s National Natural Science
Foundation (30430380) and the Basic Research
Program of China (2004CB518605). Z.W.L. is
also supported by research grants from BBSRC
and NERC of the United Kingdom.
Dennis Vitkup, Peter Kharchenko and
Andreas Wagner respond:
Lu et al. present a nice analysis that
directly supports our conclusion that
the structure and function of metabolic
networks influence enzyme evolution.
We demonstrated this fact for several
different evolutionary mechanisms (for
example, accepted mutations, gene
duplication, null mutations) and
network parameters (for example,
degree, centrality, physiological flux
distributions). Lu et al. reproduce our
results and suggest, in addition, that
betweenness also affects the evolution
and essentiality of the network
enzymes. This is not unexpected (see
previous studies [12-14]); it is likely that
many other network parameters will
correlate with various evolutionary
properties. Studies exploring these
correlations will contribute to the
developing area of evolutionary systems
biology [15].
Genome Biology 2007, Volume 8, Issue 8, Article 407 Lu et al. 407.3
Genome Biology 2007, 8:407
Figure 2
Relationship of network characteristics and gene properties in a metabolic network. (a) The
relationship between the essentiality of enzyme-coding genes in a yeast metabolic network and their
network characteristics (betweenness and connectivity). (b) The relationship between gene
duplication and the network characteristics. The standard errors in each bin are also shown.
0.008
25
30
0.000
0.002
0.004
0.006
Betweenness
Nonessential genes
Essential genes
0
5
10
15
20
Connectivity
(a)
0.008
25
30
0.000
0.002
0.004
0.006
Betweenness
Non-duplicate genes
Duplicate genes
0
5
10
15
20
(b)
Connectivity
BetweennessBetweenness
ConectivityConectivity
Correspondence should be sent to:
Dennis Vitkup, Center for Computational
Biology and Bioinformatics, Department
of Biomedical Informatics, Columbia
University, Russ Berrie Pavilion, St
Nicholas Avenue, New York, NY 10032,
USA. Email:
References
1. Vitkup D, Kharchenko P, Wagner A: Influ-
ence of metabolic network structure
and function on enzyme evolution.
Genome Biol 2006, 7:R39.
2. Ravasz E, Somera AL, Mongru DA, Oltvai
ZN, Barabasi A-L: Hierarchical organi-
zation of modularity in metabolic net-
works. Science 2002, 297:1551-1555.
3. Joy MP, Brock A, Ingber DE, Huang S:
High-betweenness proteins in the
yeast protein interaction network. J
Biomed Biotechnol 2005, 2:96-103.
4. Batagelj V, Mrvar A: Pajek - analysis and
visualization of large networks. Connec-
tions 1998, 21:47-57.
5. Pennock DM, Flake GW, Lawrence S,
Glover EJ, Giles CL: Winners don’t take
all: characterizing the competition for
links on the web. Proc Natl Acad Sci USA
2002, 99:5207-5211.
6. Kellis M, Patterson N, Endrizzi M, Birren B,
Lander ES: Sequencing and comparison
of yeast species to identify genes and
regulatory elements. Nature 2003, 423:
241-254.
7. Drummond DA, Raval A, Wilke CO: A
single determinant dominates the
rate of yeast protein evolution. Mol Biol
Evol 2006, 23:327-337.
8. Holstege FC, Jennings EG, Wyrick JJ, Lee
TI, Hengartner CJ, Green MR, Golub TR,
Lander ES, Young RA: Dissecting the
regulatory circuitry of a eukaryotic
genome. Cell 1998, 95:717-728.
9. Giaever G, Chu AM, Ni L, Connelly C,
Riles L, et al.: Functional profiling of the
Saccharomyces cerevisiae genome.
Nature 2002, 418:387-391.
10. Dwight SS, Balakrishnan R, Christie KR,
Costanzo MC, Dolinski K, Engel SR, Feier-
bach B, Fisk DG, Hirschman J, Hong EL, et
al.: Saccharomyces genome database:
underlying principles and organiza-
tion. Brief Bioinform 2004, 5:9-22.
11. Watts DJ, Strogatz S: Collective dynam-
ics of small-world networks. Nature
1998, 393:440-442.
12. Lemke N, Herédia F, Barcellos CK, Does
Reis AN, Mombach JC: Essentiality and
damage in metabolic networks. Bioin-
formatics 2004, 20:115-119.
13. Joy MP, Brock A, Ingber DE, Huang S:
High-betweenness proteins in the
yeast protein interaction network. J
Biomed Biotechnol 2005, 2:96-103.
14. Yu H, Kim PM, Sprecher E, Trifonov V,
Gerstein M: The importance of bottle-
necks in protein networks: correla-
tion with gene essentiality and
expression dynamics. PLoS Comput Biol
2007, 3:e59.
15. Koonin EV, Wolf YI: Evolutionary
systems biology: links between gene
evolution and function. Curr Opin
Biotechnol 2006, 17:481-487.
407.4 Genome Biology 2007, Volume 8, Issue 8, Article 407 Lu et al. />Genome Biology 2007, 8:407