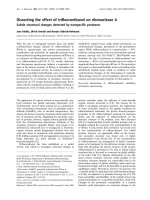
Báo cáo y học: "Quantifying the major mechanisms of recent gene duplications in the human and mouse genomes: a novel strategy to estimate gene duplication rates" docx
Bạn đang xem bản rút gọn của tài liệu. Xem và tải ngay bản đầy đủ của tài liệu tại đây (441.07 KB, 11 trang )
Genome Biology 2007, 8:R158
comment reviews reports deposited research refereed research interactions information
Open Access
2007Pan and ZhangVolume 8, Issue 8, Article R158
Research
Quantifying the major mechanisms of recent gene duplications in
the human and mouse genomes: a novel strategy to estimate gene
duplication rates
Deng Pan and Liqing Zhang
Address: Department of Computer Science, Virginia Tech, Torgerson Hall, Blacksburg, Virginia 24061-0106, USA.
Correspondence: Liqing Zhang. Email:
© 2007 Pan et al.; licensee BioMed Central Ltd.
This is an open access article distributed under the terms of the Creative Commons Attribution License ( which
permits unrestricted use, distribution, and reproduction in any medium, provided the original work is properly cited.
Gene duplication rates<p>By studying two mechanisms of gene duplication, unequal crossover and retrotranspostion, and looking at both small gene families and the entire genome, a new estimate for the rate of gene duplication is made which is more accurate for both small and large gene families.</p>
Abstract
Background: The rate of gene duplication is an important parameter in the study of evolution,
but the influence of gene conversion and technical problems have confounded previous attempts
to provide a satisfying estimate. We propose a new strategy to estimate the rate that involves
separate quantification of the rates of two different mechanisms of gene duplication and subsequent
combination of the two rates, based on their respective contributions to the overall gene
duplication rate.
Results: Previous estimates of gene duplication rates are based on small gene families. Therefore,
to assess the applicability of this to families of all sizes, we looked at both two-copy gene families
and the entire genome. We studied unequal crossover and retrotransposition, and found that these
mechanisms of gene duplication are largely independent and account for a substantial amount of
duplicated genes. Unequal crossover contributed more to duplications in the entire genome than
retrotransposition did, but this contribution was significantly less in two-copy gene families, and
duplicated genes arising from this mechanism are more likely to be retained. Combining rates of
duplication using the two mechanisms, we estimated the overall rates to be from approximately
0.515 to 1.49 × 10
-3
per gene per million years in human, and from approximately 1.23 to 4.23 ×
10
-3
in mouse. The rates estimated from two-copy gene families are always lower than those from
the entire genome, and so it is not appropriate to use small families to estimate the rate for the
entire genome.
Conclusion: We present a novel strategy for estimating gene duplication rates. Our results show
that different mechanisms contribute differently to the evolution of small and large gene families.
Background
Gene duplication is among the major mechanisms providing
raw materials that give rise to new genes and functions [1,2].
The duplication of genes is thought to be a continual process
in evolution. However, despite numerous studies of gene
duplication, the fundamental issue of how frequently gene
duplication occurs is still unresolved.
To estimate the gene duplication rate, one must first deter-
mine how to distinguish young duplicated genes from old
Published: 2 August 2007
Genome Biology 2007, 8:R158 (doi:10.1186/gb-2007-8-8-r158)
Received: 1 June 2007
Revised: 11 July 2007
Accepted: 2 August 2007
The electronic version of this article is the complete one and can be
found online at />R158.2 Genome Biology 2007, Volume 8, Issue 8, Article R158 Pan and Zhang />Genome Biology 2007, 8:R158
ones. To solve this problem, two methods were proposed in
previous studies. The first method is to use K
s
(the synony-
mous distance) [3] or other neutral markers [4] as the time
proxy to define newly born duplicates. This method was first
used by Lynch and Conery [3] to estimate gene duplication
rates in the genomes of yeast, Drosophila, and
Caenorhabtidis elegans. However, the neutrality of K
s
was
questioned by later studies [4-7]. Accordingly, Gu and cow-
orkers [4] proposed that a combination of K
s
and other neu-
tral markers, such as intron and flanking regions, should be
used to estimate gene duplication rates. However, although
the marker is neutral and the molecular clock model holds,
the first method still has problems. One of these is that it can-
not distinguish true newly born duplicates from old dupli-
cates that appear to be young because of gene conversion.
Gene conversion is a homogenizing process between two
homologous DNA fragments that occurs during recombina-
tion by transferring DNA sequence information from one
fragment to another. Thus, the divergence between two DNA
fragments can decrease dramatically following gene conver-
sion. Because gene conversion occurs frequently in the
genome [8,9], this first method can yield inflated estimates of
rate.
To overcome this problem, Gao and Innan [10] proposed a
phylogeny-based method that does not rely on the molecular
clock model. This second method effectively eliminates erro-
neous detection of old duplicates as young ones and reduces
the influence of gene conversion. Consequently, the duplica-
tion rate in yeast estimated by Gao and Innan [10] is much
lower than that by Lynch and Conery [3]. However, the phyl-
ogeny-based method is not perfect either. One of its limita-
tions is that it is computationally difficult when it is applied to
large gene families, and it becomes even more so when gene
loss is taken into account. This is probably why Gao and
Innan [10] only studied two-copy gene families, which repre-
sent a small fraction of duplicated genes in the yeast genome.
In fact, Lynch and Conery [3] also limited their study to just
the families with fewer than five members in order to mini-
mize the influence of gene conversion. Can duplication rates
estimated from small gene families represent the rate for the
entire genome?
Here, we propose a new strategy to estimate the rate of gene
duplication. A major obstacle to the estimation is difficulty in
minimizing the effect of gene conversion while taking large
families into account. Both methods used in previous studies
consider gene duplication as a single entity, ignoring the fact
that gene duplication is actually achieved by multiple mecha-
nisms. Major mechanisms of gene duplication are unequal
crossover, retroposition, and genome duplication (including
large segmental duplication) [11]. It is known that genes gen-
erated by different duplication mechanisms have different
sensitivities to gene conversion. For instance, tandem dupli-
cations (generated by unequal crossover) in large gene fami-
lies are believed to have been extensively affected by gene
conversion [8], whereas those generated by retroposition are
not. This inspired us to estimate the total duplication rate by
considering the duplication rates achieved by the different
mechanisms. The new strategy has at least two advantages
over previous methods. First, we can estimate rates of gene
duplication for duplicated genes that are not sensitive to gene
conversion by using the neutral time proxies (such as K
s
)
directly, even for large gene families. Second, for the dupli-
cated genes that are highly sensitive to gene conversion, we
can take into account the specific features of the genes and
make adjustments to achieve better control over the influence
of gene conversion.
To implement our new strategy, we must know the relative
contributions made by each mechanism to gene duplication.
Unfortunately, despite numerous studies on gene duplica-
tion, almost all of the available studies focus on one mecha-
nism of duplication at a time. It is interesting that almost all
of these studies concluded that the focal mechanism is the
dominant one. Among the three well known major mecha-
nisms of gene duplication, genome duplication was first
emphasized by Ohno [1], who claimed that it is the main proc-
ess of gene duplication in vertebrates. His hypothesis finds
supports from the 2R hypothesis in vertebrates, which posits
that there might have been two rounds of genome duplication
in vertebrates [12-14]. However, this hypothesis was chal-
lenged by several recent genome-wide studies [15-18], in
which a large proportion of gene duplications in the human
and mouse genomes was found to be tandemly aligned and
unequal crossover appeared to be the driving force. Indeed,
our previous study [19] also indicated that tandemly arrayed
genes (TAGs) account for about 20% of all genes in mammals.
Because TAGs are among the primary products of unequal
crossover [20], it appears likely that unequal crossover is a
dominant mechanism of gene duplication. On the other hand,
retroposition is also thought to play an important role in gene
duplication [21,22]. Retroposition is an RNA-mediated proc-
ess that occurs through reverse transcribing the mRNA of a
gene and inserting the resulting cDNA into the genome. Once
a retrocopy recruits regulatory elements by chance after
insertion and acquires a new function, it becomes a retrogene.
A significant number of retrogenes have been reported in
many organisms [23-29]. It is evident that we must consider
various duplication mechanisms at the same time if we are to
understand their relative contributions to duplications in the
genome.
As a first step, we quantified the respective contributions
made by unequal crossover and retroposition to recently
duplicated genes. We focused on these two mechanisms
because for the following four reasons. First, no matter
whether the 2R hypothesis holds, the last possible genome
duplication in vertebrates occurred more than 400 million
years (MY) ago [30], and so its contribution to recent gene
duplications is negligible. Second, recent segmental duplica-
tions cover only about 2% of the mouse genome [31] and 4%
Genome Biology 2007, Volume 8, Issue 8, Article R158 Pan and Zhang R158.3
comment reviews reports refereed researchdeposited research interactions information
Genome Biology 2007, 8:R158
of the human genome [32], and usually do not contain genes
[33]. Third, small segmental duplications can also be gener-
ated by unequal crossover. Fourth, within some large seg-
mental duplication regions, there exist micro-duplications
that are generated by unequal crossover or retroposition
caused by the more frequent occurrence of unequal crossover
and retroposition than large segmental duplication. Also, the
genes generated by these micro-duplication events cannot be
regarded as contributions of large segmental duplication.
Therefore, the contribution of large segmental duplication to
recent gene duplications is expected to be small, and there-
fore we focus on the two remaining major mechanisms of
gene duplication.
In this study, we compared the relative contributions made by
unequal crossover and retroposition to duplications in the
human and mouse genomes, and estimated the respective
duplication rates of the two mechanisms. We conducted our
analysis in both two-copy gene families and in the entire
genome in order to test whether the rates estimated from two-
copy families can represent that for the entire genome. We
hope that the results of this study will further our understand-
ing of the mechanisms of gene duplication in mammals.
Results
In order to examine whether gene duplication rates estimated
from small gene families can be used to represent duplication
rates in the entire genome, we estimated rates using two sets
of data: all duplicated genes in the entire genome (denoted as
the ALL gene set) and only the duplicated genes in the two-
copy gene families (denoted as the FAM2 gene set). There-
fore, the FAM2 gene set is a subset of the ALL gene set (Addi-
tional data files 1 to 4 provide lists of genes in ALL and
FAM2).
We used K
s
as a proxy to time the duplication events. K
s
has
been criticized for not being strictly neutral in yeast, Dro-
sophila, and C. elegans, among other organisms [4]. This
should not be a critical problem in the present study for the
following reasons. First, comparison of human and chimp
orthologous genes indicates that although more than 90% of
the synonymous mutations are under very weak selection,
most of them are too weak to influence the substitution rate
[34]. Second, the effective population size of mammals is
believed to be much smaller than those of nonmammalian
species. Therefore, with small selective coefficients (s) and
small population sizes (N), most of the synonymous muta-
tions are expected to be effectively neutral (2Ns << 1). Wyck-
off and coworkers [35] showed that even for the very
conserved ribosomal protein genes, the K
s
between human
and mouse is essentially identical to the average K
s
of the
entire human-mouse orthologous gene set.
Relative contributions of unequal crossover and
retroposition to gene duplication
Theoretically, unequal crossover and retroposition are two
independent biologic processes, but this has not been tested
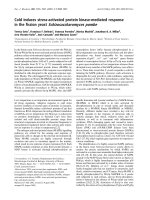
empirically in genome-wide studies. To address this issue, we
plotted the distribution of the percentage of genes that belong
to both TAGs and retroposed genes as a function of K
s
(Figure
1). For both species, even when the least stringent criteria are
used for TAG and retrogene identification, the percentages in
all K
s
bins are still no more than about 5% in both two-copy
families and the entire genome, indicating that the two proc-
esses are indeed independent.
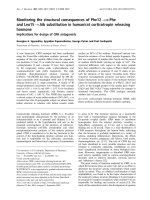
Because duplication by unequal crossover and that by retrop-
osition are largely independent of each other, we can compare
the relative contributions made by these two mechanisms to
gene duplication by simply calculating the ratio of TAGs to
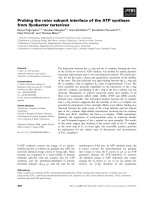
retroposition-related genes. The distribution of the ratio of
TAGs to retroposition-related genes as a function of K
s
(Fig-
ure 2) shows that, generally, the ratios in two-copy gene fam-
ilies (always <1) are much lower than those in the entire
genome (always >1) in both species, suggesting that unequal
crossover is more active in large gene families but less active
in small ones than retroposition. Figure 2 is based on the
stringent TAG definition and the lower limit of retrogene
numbers. Other criteria yield similar patterns. In a recent
study (unpublished data), we found that retroposition is not
directly correlated with the size of gene family. Interestingly,
in all cases, the ratios are very high initially and decrease
sharply as K
s
increases from 0 to about 0.05 to 0.1. This could
be caused by either an excess of young TAGs caused by gene
conversion or by a lack of retrogenes in small K
s
bins.
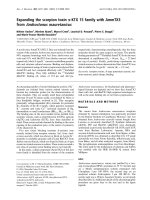
Duplicated genes belong to both TAGs and retrogenesFigure 1
Duplicated genes belong to both TAGs and retrogenes. The proportion of
shared genes is the proportion of duplicated genes that belong to both
tandemly arrayed genes (TAGs) and retroposed genes as a function of K
s
.
(percentage)
R158.4 Genome Biology 2007, Volume 8, Issue 8, Article R158 Pan and Zhang />Genome Biology 2007, 8:R158
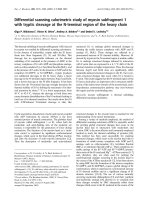
Gene duplications via unequal crossover
We plotted the cumulative distributions of the number of
TAGs as a function of K
s
(Figures 3a,b). We divided the curves
into two parts using K
s
= 0.25 as the cut-off and fitted linear
models to each part of the curves. The results are shown in
Table 1. The slopes of the linear functions are therefore the
estimates of gene duplication rates for the two types of dupli-
cation mechanisms. In both species, rates of TAG duplication
decrease at K
s
≥ 0.25 for both the FAM2 gene set and the ALL
gene set. According to Lynch and Cornery [3], gene loss
should have occurred extensively before K
s
= 0.25. However,
the distributions appear to imply that gene loss in TAGs does
not occur soon after duplication events, which means newly
generated TAGs are more likely to be preserved for a long
time.
Because it has been shown that TAGs are highly affected by
gene conversion, to explore the region where the true duplica-
tion rate in TAGs will be located, we determined recently
duplicated genes in two-copy families using a phylogeny-
based method similar to that used by Gao and Innan [10] (the
collection of these genes is denoted as the NEW gene set; see
Materials and methods, below, for detail and Additional data
files 5 and 6 for the gene list). Thus, genes in the NEW gene
set should truly be recently born in the human or mouse line-
age, rather than results of gene conversion on older dupli-
cates. About 94% of the human gene pairs and 91% of the
mouse gene pairs in the NEW gene set have K
s
≤ 0.25, which
confirms the recent duplications of these genes. The majority
of the gene pairs in the NEW gene set have K
a
/K
s
< 1, which
suggests that these genes are mostly under purifying selection
(see Additional data file 7). The cumulative distributions of
TAGs in the NEW gene set are plotted in Figure 3a. Because
most of the genes in the NEW gene set have K
s
≤ 0.25, we only
used these genes for curve fitting. It shows that the slopes of
the linear functions of the NEW gene set (H
n
and M
n
) are
located between the slopes of the two parts of the FAM2 gene
set (H
p1
and H
p2
in human; M
p1
and M
p2
in mouse), which
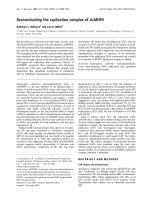
Relative contribution of unequal crossover and retropositionFigure 2
Relative contribution of unequal crossover and retroposition. 'TAG/Retro'
is the ratio of the cumulative number of tandemly arrayed genes (TAGs)
to retroposed genes as a function of K
s
.
Table 1
Parameter estimates for the linear functions (y = mx + b) in Figures 3 and 4
Species Mechanisms Gene set Functions Parameters
mb r
a
P value
Human TAG NEW H
n
50.46 12.88 0.94 7.0 × e
-12
FAM2 H
p1
105.62 15.43 0.97 4.0 × e
-15
H
p2
19.00 36.41 0.98 <2.2 × e
-16
ALL H
1
2,381.20 258.50 0.99 <2.2 × e
-16
H
2
722.30 691.50 0.99 <2.2 × e
-16
Retro FAM2 H
pr
730.00 6.90 0.99 9.5 × e
-04
ALL H
r
2,840.00 18.00 0.99 4.9 × e
-04
Mouse TAG NEW M
n
54.93 1.78 0.98 <2.2 × e
-16
FAM2 M
p1
109.77 6.13 0.99 <2.2 × e
-16
M
p2
13.09 30.71 0.93 <2.2 × e
-16
ALL M
1
5,717.80 343.10 0.99 <2.2 × e
-16
M
2
1,034.00 1548.00 0.99 <2.2 × e
-16
Retro FAM2 M
pr
1,000.00 14.60 0.98 2.9 × e
-03
ALL M
r
3,750.00 71.30 0.99 1.1 × e
-03
a
Pearson correlation coefficient. TAG, tandemly arrayed gene.
Genome Biology 2007, Volume 8, Issue 8, Article R158 Pan and Zhang R158.5
comment reviews reports refereed researchdeposited research interactions information
Genome Biology 2007, 8:R158
means that in two-copy gene families the real TAG duplica-
tion rate is located between the slopes of the two parts of the
curves.
Theoretically, we can perform a similar analysis for the ALL
gene set. In practice, however, it is extremely difficult to iden-
tify recently duplicated genes in large gene families using the
phylogeny-based method. However, we noticed that the pat-
terns of distributions of TAGs with respect to K
s
are very sim-
ilar between the two-copy families and the entire genome,
and in particular the K
s
divergence points for rate changes are
both around 0.25. Therefore, we believe that, for the entire
genome, the real TAG duplication rate is also located between
the slopes of the two parts of the curves. This is based on the
following reasoning. Let R
t
be the true gene duplication rate,
R
oi
the observed gene duplication rate, R
ci
the gene conver-
sion rate, and R
li
the gene loss rate, where I = 1 when K
s
≤ 0.25
and i = 2 when 0.25 < K
s
≤ 1. Then, R
oi
= R
t
+ R
ci
- R
li
. For the
first part of the curves, as shown above, the rates of gene loss
in TAGs should be low, especially immediately after the dupli-
cation events [3], but gene conversion in TAGs is supposedly
strong [8,9] and always in effect. So, we have R
c1
> R
l1
, and
then R
o1
> R
t
. For the second part of the curves, gene conver-
sion is greatly weakened because of high sequence diver-
gence; meanwhile, the net effect of gene loss is greater than
the first part of the curves, especially because of the fact that
many TAGs can become superficially lost (fail to be classified
as TAGs) as a result of various genome rearrangements [18].
So we have R
c2
< R
l2
and then R
o2
< R
t
. Thus, R
o1
> R
t
> R
o2
.
Also, because TAGs make a greater contribution to gene
duplication in large families than in small ones (Figure 2),
gene conversion should be more active in large gene families
than in small ones. It is therefore likely that R
t
for the entire
genome is closer to R
o2
than it is in two-copy gene families.
We converted the slopes of the linear functions to obtain
absolute rates. For the two-copy gene families, we used the
slopes for the NEW gene sets directly, whereas for the entire
genome we used the two slopes of the linear functions for the
ALL gene sets as the lower and upper estimates of the rates.
Assuming a synonymous substitution rate of 1 to 1.3 × 10
-9
per
site per year for human [36] and 2 to 2.6 × 10
-9
per site per
year for mouse [37], and 8,312 and 8,105 singleton genes in
the human and mouse genomes, respectively, we estimated
the rates of gene duplication in two-copy gene families to be
0.012 to 0.016 × 10
-3
per gene per MY in human and 0.027 to
0.035 × 10
-3
per gene per MY in mouse. For the entire
genome, assuming the same substitution rates, and 19,032 in
human and 20,453 in mouse to be the effective numbers of
genes before one duplication event per genome (see Materials
and methods, below), we estimated rates of duplication for
the entire genome to be 0.076 to 0.325 × 10
-3
per gene per MY
in human and 0.202 to 1.45 × 10
-3
per gene per MY in mouse.
Therefore, the rates estimated for the entire genome are
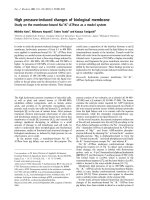
Gene duplication rate via unequal crossoverFigure 3
Gene duplication rate via unequal crossover. The rates are the slopes of the linear functions (colored lines) fitted to the curves of the cumulative
distributions of tandemly arrayed genes (TAGs). Parameter estimates of the linear functions are shown in Table 1. (a) TAGs in two-copy families. The
NEW gene set is plotted in bold broken lines, the linear functions of which are H
n
and M
n
(red). The FAM2 gene set was plotted in bold lines, the linear
functions of which are H
p1
and M
p1
(red) for the part with K
s
≤ 0.25, and H
p2
and M
p2
(green) for the part with K
s
> 0.25. (b) TAGs in the entire genome.
The linear functions are H
1
and M
1
(red) for the part with K
s
≤ 0.25, and H
2
and M
2
(green) for the part with K
s
> 0.25.
(a) (b)
R158.6 Genome Biology 2007, Volume 8, Issue 8, Article R158 Pan and Zhang />Genome Biology 2007, 8:R158
approximately 5 to 27 times faster than the rates estimated
for two-copy gene families in human, and 6 to 54 times faster
in mouse.
The above rates are all based on the stringent TAG definition,
which allows only up to one spacer gene in the array. If the
nonstringent TAG definition is used, then for the two-copy
gene families the rates are about 0.015 to 0.020 × 10
-3
per
gene per MY in human and 0.041 to 0.053 × 10
-3
in mouse; for
the entire genome, the rates are 0.083 to 0.406 × 10
-3
per
gene per MY in human and 0.217 to 1.71 × 10
-3
in mouse. The
rates are similar to those obtained under the stringent TAG
definition, showing that the results are not very sensitive to
the number of spacers allowed.
Gene duplications via retroposition
Retrogenes were screened for the two genomes. Because of
uncertainty regarding the number of multi-retroposition
events in large gene families, we determined upper and lower
limits for the number of retrogenes (see Materials and meth-
ods, below, for details). There are 585 putative parental-ret-
rogene pairs in human and 727 in mouse if one takes all of the
possible multi-retroposition events as one event for each
parental gene, or 700 putative parental-retrogene pairs in
human and 857 in mouse if one includes all of those possible
multi-retroposition events. The actual number of retrogenes
should be within these ranges. The cumulative distributions
of the numbers of retrogenes as a function of K
s
are shown in
Figures 4a,b.
Ezawa and coworkers [9] demonstrated that most of the gene
pairs that underwent gene conversion are linked on the same
chromosomes in mouse. Because most of the retrogenes in
our data are located on different chromosomes from their
parental genes (Table 2), we believe that gene conversion has
little influence on retrogenes. Thus, unlike the case for TAGs,
we simply used the retrogenes in the small K
s
regions (K
s
≤
0.05) to estimate the rate of gene duplication for retroposi-
tion. According to Lynch and Cornery [3], there should be no
apparent gene loss within K
s
= 0.05.
Using the same rate transformation procedures as for TAGs,
we estimated the retrogene formation rate to be 0.176 to
0.228 × 10
-3
per gene per MY in human and 0.393 to 0.642 ×
10
-3
per gene per MY in mouse for the two-copy gene families,
and 0.298 to 0.388 × 10
-3
per gene per MY in human and
0.733 to 0.953 × 10
-3
per gene per MY in mouse for the entire
genome. The rates estimated for two-copy gene families are
still about 1.3 to 2.2 times lower than those for the entire
genome in human and 1.1 to 1.9 times lower in mouse, but the
contrast between the rates for two-copy families and the rates
for the entire genome is much smaller than that of TAGs,
which is consistent with the observation that the retrogene
formation is more active in two-copy gene families than larger
families (Figure 2).
Recent gene duplication rates
Because unequal crossover and retroposition are independ-
ent, we can sum the two rates from these two mechanisms.
Gene duplication rate via retropositionFigure 4
Gene duplication rate via retroposition. The rates are the slopes of the linear functions (red lines) fitted to the curves of the cumulative distributions of
retrogenes. All of the linear functions are fitted to the part of the curves with K
s
≤ 0.05. Parameters of the linear functions are shown in Table 1. (a)
Retrogenes in two-copy families. The linear functions are H
pr
and M
pr
. (b) Retrogenes in the entire genome. The linear functions are H
r
and M
r
.
(a) (b)
Genome Biology 2007, Volume 8, Issue 8, Article R158 Pan and Zhang R158.7
comment reviews reports refereed researchdeposited research interactions information
Genome Biology 2007, 8:R158
Assuming mechanisms other than these two are also inde-
pendent, we can derive the overall gene duplication rates
using the following equation:
Where R
u
and R
r
are gene duplication rates caused by unequal
crossover and retroposition, respectively; and W is the total
percentage of the duplicated genes involved in these two
processes. Because R
u
and R
r
are estimated using different K
s
regions, the intersecting K
s
regions should be used to estimate
R. Because the influence of gene conversion is greatly reduced
when K
s
> 0.25, we used K
s
= 0.25 as the point at which to esti-
mate W and the range of K
s
< 0.25 for estimating R
u
and R
r
(Table 3). In fact, there is little change in W for 0.25 ≤ K
s
≤ 1.
All of the gene duplication rates estimated thus far are sum-
marized in Table 3. Recent tandem duplication rates are more
than ten times slower than retrogene formation rates for two-
copy families, but the contrast in rates of duplication for these
two mechanisms becomes less obvious for the entire genome.
The rates estimated using two-copy gene families are about
1.2 to 6 times lower than those using the whole genome in
both species. The duplication rates in mouse are much higher
than those in human.
Discussion
Gene duplication has been studied extensively. However,
most studies focus on one duplication mechanism at a time or
take all of the duplication mechanisms as a whole and do not
consider the differences between the various mechanisms. In
this study we considered the relative extent to which the var-
ious mechanisms contribute to recent gene duplications in
human and mouse, and we estimated the gene duplication
rate occurring via different duplication mechanisms. To
achieve our goals, we studied unequal crossover and retropo-
sition simultaneously. We quantitatively confirmed that these
two processes are independent and compared their respective
contributions to gene duplications. These results provide the
basis of our novel strategy for estimating gene duplication
rates.
In our new strategy, gene duplication rates are estimated sep-
arately for unequal crossover and retroposition, and later the
two rates are combined to estimate the overall gene duplica-
tion rate. Because gene conversion has minimal effect on the
divergence of retrogenes, we are confident that the estimates
Table 2
Chromosomal locations of parental-retrogene pairs
Species Types NEW FAM2 ALL
a
Human Intra-chromosomal 8 14 116
(29.6%) (9.9%) (19.8%)
Inter-chromosomal 19 128 469
(71.4%) (90.1%) (80.2%)
Mouse Intra-chromosomal 6 21 151
(11.8%) (12%) (20.8%)
Inter-chromosomal 45 154 576
(88.2%) (88%) (79.2%)
Percentages are given in parentheses.
a
Based on the lower limit of the number of retropositions; the upper limit provides similar results.
R
RR
W
ur
=
+
Table 3
Summary of duplication rates
Categories Human Mouse
Two-copy gene families Entire genome Two-copy gene families Entire genome
TAG rate (R
u
) 0.012 to 0.020 0.076 to 0.406 0.027 to 0.053 0.202 to 1.71
Retro rate (R
r
) 0.176 to 0.228 0.298 to 0.388 0.494 to 0.642 0.733 to 0.953
Total weight (W) 61.0% to 73.2% 53.3% to 72.6% 68.5% to 77.2% 62.9% to 76.3%
R
u
+ R
r
0.188 to 0.248 0.374 to 0.794 0.521 to 0.695 0.935 to 2.66
Gene duplication Rate (R) 0.257 to 0.407 0.515 to 1.49 0.675 to 1.01 1.23 to 4.23
The rates are expressed as × 10
-3
per gene per million years. The lower and upper limits are calculated through all combinations of different
tandemly arrayed gene (TAG) or retrogene identification criteria
R158.8 Genome Biology 2007, Volume 8, Issue 8, Article R158 Pan and Zhang />Genome Biology 2007, 8:R158
of rates of duplication by retroposition are reliable. In fact,
using the rates of duplication by retroposition alone to esti-
mate the overall rates of gene duplication also gives an esti-
mate that is of the same magnitude as the combined rate
estimates from the two duplication mechanisms. Also, by tak-
ing advantage of the fact that frequencies of gene conversion
reduce with the divergence of TAGs, we were able to control
the influence of gene conversion to a predictable range, even
for large gene families. Therefore, our new method appears
promising. However, there are still several issues that must be
addressed. First, as stated above, there might be some prob-
lems with K
s
as a time proxy in organisms with large popula-
tion size. We should therefore use other, more neutral
markers in the organisms with large population size if possi-
ble. Second, our screening method for retrogenes has limited
power to identify chimeric retrogenes, and it is therefore
likely that rates of duplication by retroposition are underesti-
mated in our study. Third, one may argue that, according to
our strategy, a similar estimate of overall rate could be
achieved by considering just one mechanism, combined with
knowledge of its relative contribution; however, the more
mechanisms used, the more robust will be the rate achieved.
We used the total weight W (the percentage of duplicated
genes that are either TAGs or retrogenes) to transform the
sum of R
u
and R
r
into the overall gene duplication rate R for
the genome. As shown in Table 3, even with the most strin-
gent criteria in the identification of TAGs and retrogenes, W
is more than 53%. On average, W is about 60% to 70% in
human and mouse, suggesting that unequal crossover and
retroposition are the major mechanisms for generating gene
duplications. The remaining duplicated genes may be gener-
ated by recent large segmental duplications, nonallelic
homologous recombination [38], and even mechanisms that
are yet to be identified. It is also possible that some of the
duplicated genes generated by unequal crossover and retrop-
osition were not detected by our screening method. Genes
generated by unequal crossover can be rearranged to differ-
ent chromosomes as a result of genome rearrangement, and
our method will not be able to identify them. Also, retrogenes
can gain new introns and exons and become multiple exon
genes, and our method will not be able to identify them either.
It should also be mentioned that our way of combining the
rate components through W is very simple and may be biased
if W is not correctly estimated. More sophisticated ways to
combine the components in the final rate should be studied in
the future.
Our final rate estimation of R is about 0.515 to 1.49 × 10
-3
per
gene per MY in human and about 1.23 to 4.23 × 10
-3
in mouse
(Table 3). These rates are in the range of the estimates
reported by Lynch and Conery [3] (2 to 20 × 10
-3
per gene per
MY), in which families with no more than five members were
used for estimation in fly, yeast, and worm. However, Gao
and Innan [10] proposed an estimate of the gene duplication
rate in yeast that is two orders of magnitude lower than that
estimated by Lynch and Conery [3]. Because Gao and Innan
used a phylogeny-based method to obtain the data, they
claimed that the lower rates are due to the removal of the
effect of gene conversion on the data. However, our results
show that most of the statistics in two-copy gene families
exhibit different behaviors from those in the whole genome,
and gene duplication rates estimated in two-copy gene fami-
lies are generally lower than those estimated from the entire
genome, even after taking gene conversion into account.
Therefore, the much lower rate proposed by Gao and Innan
[10] may in part be due to the usage of two-copy families.
However, because the species used in their study and ours are
different, more work should be done to test this hypothesis.
The comparison of different mechanisms enables us to gain
more insight into the relative importance of different mecha-
nisms of gene duplication and dynamics of duplicated genes
generated by these different mechanisms. Our results show
that genes generated by unequal crossover are more likely to
be preserved than retrotransposed copies. The K
s
cut-off for
the slowdown of the observed duplicated gene formation
rates in TAG (about 0.25) is much larger than that of retro-
genes (about 0.05). This phenomenon is largely because of
the influence of gene conversion.
Apart from duplication rates, we also compared the absolute
numbers of genes involved in unequal crossover and retropo-
sition with respect to K
s
divergence of duplicated genes. The
results show that unequal crossover generally contributes
more than retroposition to gene duplications in the entire
genome, and the difference will be larger as divergence
becomes larger (Figure 2). The longer half-life of TAGs
appears to ensure that more TAGs will be preserved in the
genome. However, the situation in two-copy families is differ-
ent. Retroposition-related genes generally occur more than
twice as frequently as TAGs in human, and more than three
times as frequently as in mouse. The excess of retroposition-
related genes in two-copy families indicates that retroposi-
tion plays a major role in generating two-copy gene families
from singleton genes. It also means that singleton genes are
less likely to change into a TAG of two-members, which may
be because unequal crossover is less likely to occur in a single
copy gene than in an existing TAG because of the lack of
sequence similarity. Note that small gene families can also
come from large gene families as a result of gene loss. Here,
we only consider the overall net effect.
The genomes of rodents change faster than those of primates
[31,39-41]. Accordingly, we also found that the gene duplica-
tion rates, either via unequal crossover or via retroposition,
are higher in mouse than in human, which probably reflects
the intrinsic difference between the two species. A recent
study [37] proposed a more important role of positive selec-
tion than for the duplication-degeneration-complementation
(DDC) model [42] in maintaining more gene duplications in
mouse than in human. However, the DDC model cannot be
Genome Biology 2007, Volume 8, Issue 8, Article R158 Pan and Zhang R158.9
comment reviews reports refereed researchdeposited research interactions information
Genome Biology 2007, 8:R158
used to explain duplications by retroposition. The higher
preservation rate of retrogenes in mouse may still be due to
adaptive evolution, because mouse has a much larger effec-
tive population size than human, which means natural selec-
tion in mouse is generally stronger than that in human.
However, this hypothesis requires testing in the future.
Materials and methods
Data compiling
We retrieved all data from Ensembl (version 41) using
BioMart. Altogether, there are 31,206 and 27,964 genes in the
human and mouse genomes, respectively. We focused on the
genes that are nuclear protein coding and for which the chro-
mosome location is known. We used the longest transcripts of
those genes having multiple spliced forms. We discarded
genes encoding proteins shorter than 50 amino acids to
ensure annotation quality and obtained 22,598 human genes
and 24,064 mouse genes. Of these, 8,312 in human and 8,105
in mouse are single-copy genes, and the remaining are clus-
tered by Ensembl into 3,538 families in human and 3,600
families in mouse.
We paired genes within each family and aligned the DNA
sequences of these gene pairs based on the corresponding
protein alignments using ClustalW [43]. We required the
overlapping percentage of the alignment in each gene pair to
be no less than 70%, and we obtained 88,423 gene pairs (con-
taining 12,782 genes) in human and 127,146 gene pairs (con-
taining 14,382 genes) in mouse. This is our entire dataset,
which represents all duplicated genes in the two genomes
denoted as the ALL gene set for clarity. Furthermore, we
retrieved genes from the ALL gene set that are in two-copy
gene families, denoted as the FAM2 gene set. There are 1,364
and 1,323 gene pairs in human and mouse, respectively, in the
FAM2 gene set.
In order to evaluate the influence of gene conversion in two-
copy families, we compiled a gene set (denoted NEW) from
the FAM2 gene set using a phylogeny-based method without
assuming the molecular clock model. We chose outgroup spe-
cies as reference points to identify recently duplicated genes.
We used five sequenced mammalian genomes: dog (Canis
familiaris), cattle (Bos Taurus), rat (Rattus norvegicus),
macaca (Macaca mulatta), and opossum (Monodelphis
domestica) as outgroups. (Also, human or mouse was used as
an outgroup, depending on which species was the focal spe-
cies.) We identified the gene pairs in human (or mouse) that
have at most one gene in the outgroup species belonging to
the same gene family (Ensembl families were defined based
on sequence similarity). There are 118 human gene pairs and
120 mouse gene pairs that satisfy this criterion. We then man-
ually examined each gene pair using the Ensembl Gene-
TreeView Browser to confirm the phylogeny and discarded
genes that are most likely false positives of recent duplica-
tions. Finally, we obtained 108 newly born duplicated gene
pairs in human and 108 pairs in mouse.
We computed K
a
(the number of nonsynonymous substitu-
tions per nonsynonymous site) and K
s
(the number of synon-
ymous substitutions per synonymous site) for all gene pairs
by a maximum likelihood method using PAML [44,45] and
performed subsequent analysis on all three datasets.
Screening TAGs
TAGs are tandemly arrayed genes that belong to the same
gene family. There are sometimes spacers within a TAG,
which are genes that do not belong to the same family as the
TAG members. Similar to work by Shoja and Zhang [19], we
used two TAG definitions: the stringent TAG definition with
0 ≤ S ≤ 1 and the nonstringent definition with 0 ≤ S ≤ 10, where
S is the number of spacer genes. Specifically, we sorted genes
by their chromosomes and indexed them in ascending order
based on their physical locations. Let d denote the absolute
difference in the indices between two genes on the same chro-
mosome. If d ≤ 2, then two genes belong to a TAG according
to the stringent definition; if d ≤ 11, then two genes belong to
a TAG according to the nonstringent definition. We then clus-
tered two-gene TAGs into larger TAGs by using a single link-
age cluster algorithm. We screened TAGs for each dataset
under each TAG definition in each of the species.
The distributions of the cumulative number of duplicated
genes in TAGs as a function of K
s
were plotted in R [46] in
both two-copy gene families and in the entire genome. The
interval of the data points in terms of K
s
of the curves is 0.01.
Because initially genes are singletons and the duplication
direction in TAGs is unknown, the number of duplicated
genes were calculated as the total number of genes in TAGs in
each case minus the number of initial singleton genes, which
can be estimated as one half of the number of genes in two-
copy gene families.
Screening retrogenes
We retrieved gene structure information from Ensembl and
merged introns shorter than 40 nucleotides [26]. We consid-
ered gene pairs with a multiple exon member (the parental
gene) and an intronless member (the derived retrogene) as
putative parental-retrogene pairs. Because intron loss or gain
seldom occurs in mammals [47], it is unlikely that the
putative retrogenes are due to intron loss and the parental
genes are due to intron gain. We ignored those pairs that have
intronless parental genes. However, this is a minor problem
because, for instance, in two-copy gene families there are only
seven gene pairs (about 3.4%) with K
s
≤ 0.25 in which both
members are intronless and located on different chromo-
somes (most of the retropositions occur inter-chromosoma-
lly; Table 2). Our screening method for retrogenes has limited
power to identify chimeric retrogenes, but that will not affect
our results very much because we are only interested in the
number of gene duplication events.
R158.10 Genome Biology 2007, Volume 8, Issue 8, Article R158 Pan and Zhang />Genome Biology 2007, 8:R158
Because of multiple mappings between putative parental
genes and retrogenes in large families, we picked out paren-
tal-retrogene pairs using the following procedures. First,
because a retrogene has only one parental gene, when an
intronless gene is paired with several multi-exon genes, we
selected the pair that has the smallest K
s
as the target pair and
obtained 700 pairs in human and 857 pairs in mouse. Of
these, there still exist gene pairs whose parental genes are
mapped to multiple retrogenes. Because the likelihood of
intron gain is low [47], these pairs can be the result of either
multiple retropositions (scenario 1), one retroposition fol-
lowed by multiple duplications of the retrogene (scenario 2),
or a mixture of these two scenarios. It is therefore very diffi-
cult to determine precisely the number of retrogene forma-
tion events. To be as broad as possible, we considered both
upper and lower limits: 700 in human and 857 in mouse (cor-
responding to scenario 1), and 585 in human and 727 in
mouse (corresponding to scenario 2). We obtained the lower
limits by keeping only the pair that has the smallest K
s
among
all of the gene pairs that share the same parental genes. The
number of retrogenes in human in this study is approximately
the same as that reported by Marques and coworkers [26].
Similarly, we also plotted the distribution of cumulative
number of retrogenes as a function of K
s
using R [46]. The
interval of the data points in terms of K
s
of the curves is 0.01.
Estimating rates
Cumulative distributions of the numbers of duplicated genes
generated by unequal crossover and retroposition were plot-
ted as a function of K
s
. Gene duplication rates were estimated
by curve fitting to a linear model. The slopes of the linear
models are essentially the estimates of observed gene dupli-
cation rates per genome per synonymous substitution, and
the intercepts are estimates of the numbers of duplicated
genes observed per genome when K
s
approaches 0. All of the
curve fitting and statistical tests were performed in R [46].
The curves of TAGs are separated into two parts using K
s
=
0.25 as a cutoff and linearly fitted separately. The K
s
cut-off at
0.25 is based on the distributions in Figure 3a,b. Unlike the
case of TAGs, we only used one line to fit retrogene curves
with K
s
≤ 0.05 because the influence of gene conversion on
retrogenes is minimal.
To convert duplication rates per genome to duplication rates
per gene, we must know the effective number of genes (N
g
)
before one duplication event per genome. For two-copy gene
families, N
g
is the number of singletons (8,312 in human and
8,105 in mouse). For families of all sizes, N
g
is calculated as
the total number of genes per genome minus the number of
gene families, which are 19,032 in human and 20,453 in
mouse.
Other analyses
All of the text parsing and processing procedures were per-
formed using a series of programs written in the OCAML lan-
guage [48]. Data were loaded into a MySQL database for
subsequent querying.
Additional data files
The following additional data are available with the online
version of this paper. Additional data file 1 provides the
human ALL gene set. Additional data file 2 provides the
mouse ALL gene set. Additional data file 3 provides the
human FAM2 gene set. Additional data file 4 provides the
mouse FAM2 gene set. Additional data file 5 provides the
human NEW gene set. Additional data file 6 provides the
mouse NEW gene set. Additional data file 7 provides the dis-
tribution of K
a
/K
s
to K
s
of the gene pairs in the NEW gene set.
Additional data file 1Human ALL gene set.Provided is the human ALL gene set.Click here for fileAdditional data file 2Mouse ALL gene set.Provided is the mouse ALL gene set.Click here for fileAdditional data file 3Human FAM2 gene set.Provided is the human FAM2 gene set.Click here for fileAdditional data file 4Mouse FAM2 gene set.Provided is the mouse FAM2 gene set.Click here for fileAdditional data file 5Human NEW gene set.Provided is the human NEW gene set.Click here for fileAdditional data file 6Mouse NEW gene set.Provided is the mouse NEW gene set.Click here for fileAdditional data file 7Distribution of K
a
/K
s
to K
s
of the gene pairs in the NEW gene set.Provided is the distribution of K
a
/K
s
to K
s
of the gene pairs in the NEW gene set.Click here for file
Authors' contributions
DP designed, analyzed and wrote the paper. LZ designed and
wrote the paper.
Acknowledgements
The authors thank Lenwood Heath and Mark Lawson for reading the man-
uscript. This work was supported by a VPI&SU ASPIRES (A Support Pro-
gram for Innovative Research Strategies) grant.
References
1. Ohno S: Evolution by Gene Duplication New York: Springer-Verlag;
1970.
2. Wolfe KH, Li WH: Molecular evolution meets the genomics
revolution. Nat Genet 2003, 33():255-265.
3. Lynch M, Conery JS: The evolutionary fate and consequences of
duplicate genes. Science 2000, 290:1151-1155.
4. Gu Z, Cavalcanti A, Chen FC, Bouman P, Li WH: Extent of gene
duplication in the genomes of Drosophila, nematode, and
yeast. Mol Biol Evol 2000, 19:256-262.
5. Long M, Thornton K: Gene duplication and evolution. Science
2001, 293:1551.
6. Sharp PM, Li WH: On the rate of DNA sequence evolution in
Drosophila. J Mol Evol 1989, 28:398-402.
7. Chamary JV, Parmley JL, Hurst LD: Hearing silence: non-neutral
evolution at synonymous sites in mammals. Nat Rev Genet
2006, 7:98-108.
8. Teshima KM, Innan H: The effect of gene conversion on the
divergence between duplicated genes. Genetics 2004,
166:1553-1560.
9. Ezawa K, OOta S, Saitou N: Proceedings of the SMBE Tri-
National Young Investigators' Workshop 2005. Genome-
wide search of gene conversions in duplicated genes of
mouse and rat. Mol Biol Evol 2006, 23:927-940.
10. Gao LZ, Innan H: Very low gene duplication rate in the yeast
genome. Science 2004, 306:1367-1370.
11. Zhang J: Evolution by gene duplication: an update. Trends Ecol-
ogy Evol 2003, 18:292-298.
12. Lundin LG: Evolution of the vertebrate genome as reflected in
paralogous chromosomal regions in man and the house
mouse. Genomics 1993, 16:
1-19.
13. Sidow A: Genome duplications in the evolution of early
vertebrates. Curr Opin Genet Dev 1996, 6:715-722.
14. Meyer A, Schartl M: Gene and genome duplications in verte-
brates: the one-to-four (-to-eight in fish) rule and the evolu-
tion of novel gene functions. Curr Opin Cell Biol 1999, 11:699-704.
15. Friedman R, Hughes AL: Pattern and timing of gene duplication
in animal genomes. Genome Res 2001, 11:1842-1847.
16. Hughes AL, da Silva J, Friedman R: Ancient genome duplications
did not structure the human Hox-bearing chromosomes.
Genome Biology 2007, Volume 8, Issue 8, Article R158 Pan and Zhang R158.11
comment reviews reports refereed researchdeposited research interactions information
Genome Biology 2007, 8:R158
Genome Res 2001, 11:771-780.
17. Friedman R, Hughes AL: The temporal distribution of gene
duplication events in a set of highly conserved human gene
families. Mol Biol Evol 2003, 20:154-161.
18. Friedman R, Hughes AL: Two patterns of genome organization
in mammals: the chromosomal distribution of duplicate
genes in human and mouse. Mol Biol Evol 2004, 21:1008-1013.
19. Shoja V, Zhang L: A roadmap of tandemly arrayed genes in the
genomes of human, mouse, and rat. Mol Biol Evol 2006,
23:2134-2141.
20. Graham G: Tandem genes and clustered genes. J Theor Biol
1995, 175:71-87.
21. Brosius J: Retroposons: seeds of evolution. Science 1991,
251:753.
22. Kazazian HH Jr: Mobile elements: drivers of genome evolution.
Science 2004, 303:1626-1632.
23. Betran E, Thornton K, Long M: Retroposed new genes out of the
X in Drosophila. Genome Res 2002, 12:1854-1859.
24. Long M, Betran E, Thornton K, Wang W: The origin of new genes:
glimpses from the young and old. Nat Rev Genet 2003,
4:865-875.
25. Emerson JJ, Kaessmann H, Betran E, Long M: Extensive gene traffic
on the mammalian X chromosome. Science 2004, 303:537-540.
26. Marques AC, Dupanloup I, Vinckenbosch N, Reymond A, Kaessmann
H: Emergence of young human genes after a burst of retrop-
osition in primates. PLoS Biol 2005, 3:e357.
27. Wang W, Zheng H, Fan C, Li J, Shi J, Cai Z, Zhang G, Liu D, Zhang J,
Vang S, et al.: High rate of chimeric gene origination by retro-
position in plant genomes. Plant Cell 2006, 18:1791-1802.
28. Vinckenbosch N, Dupanloup I, Kaessmann H: Evolutionary fate of
retroposed gene copies in the human genome. Proc Natl Acad
Sci USA 2006, 103:3220-3225.
29. Bai Y, Casola C, Feschotte C, Betran E: Comparative genomics
reveals a constant rate of origination and convergent acqui-
sition of functional retrogenes in Drosophila. Genome Biol 2007,
8:R11.
30. Makalowski W: Are we polyploids? A brief history of one
hypothesis. Genome Res 2001, 11:667-670.
31. Bailey JA, Church DM, Ventura M, Rocchi M, Eichler EE: Analysis of
segmental duplications and genome assembly in the mouse.
Genome Res 2004, 14:789-801.
32. Bailey JA, Gu Z, Clark RA, Reinert K, Samonte RV, Schwartz S, Adams
MD, Myers EW, Li PW, Eichler EE: Recent segmental duplica-
tions in the human genome. Science 2002, 297:1003-1007.
33. Zhang L, Lu HH, Chung WY, Yang J, Li WH: Patterns of segmental
duplication in the human genome. Mol Biol Evol 2005,
22:135-141.
34. Lu J, Wu CI: Weak selection revealed by the whole-genome
comparison of the X chromosome and autosomes of human
and chimpanzee. Proc Natl Acad Sci USA 2005, 102:4063-4067.
35. Wyckoff GJ, Malcom CM, Vallender EJ, Lahn BT: A highly unex-
pected strong correlation between fixation probability of
nonsynonymous mutations and mutation rate. Trends Genet
2005, 21:381-385.
36. Yi S, Ellsworth D, Li W: Slow molecular clocks in Old World
monkeys, apes, and humans. Mol Biol Evol 2002, 19:2191-2198.
37. Shiu SH, Byrnes JK, Pan R, Zhang P, Li WH: Role of positive selec-
tion in the retention of duplicate genes in mammalian
genomes. Proc Natl Acad Sci USA 2006, 103:2232-2226.
38. Bailey JA, Liu G, Eichler EE: An Alu transposition model for the
origin and expansion of human segmental duplications. Am J
Hum Genet 2003, 73:823-834.
39. Li WH, Ellsworth DL, Krushkal J, Chang BH, Hewett-Emmett D:
Rates of nucleotide substitution in primates and rodents and
the generation-time effect hypothesis. Mol Phylogenet Evol 1996,
5:182-187.
40. Waterston RH, Lindblad-Toh K, Birney E, Rogers J, Abril JF, Agarwal
P, Agarwala R, Ainscough R, Alexandersson M, An P, et al.: Initial
sequencing and comparative analysis of the mouse genome.
Nature 2002, 420:520-562.
41. Thomas JW, Touchman JW, Blakesley RW, Bouffard GG, Beckstrom-
Sternberg SM, Margulies EH, Blanchette M, Siepel AC, Thomas PJ,
McDowell JC, et al.: Comparative analyses of multi-species
sequences from targeted genomic regions. Nature 2003,
424:788-793.
42. Force A, Lynch M, Pickett FB, Amores A, Yan YL, Postlethwait J:
Preservation of duplicate genes by complementary, degen-
erative mutations. Genetics 1999, 151:1531-1545.
43. Thompson J, Higgins D, Gibson T: CLUSTAL W: improving the
sensitivity of progressive multiple sequence alignment
through sequence weighting, position-specific gap penalties
and weight matrix choice. Nucleic Acids Res 1994, 22:4673-4680.
44. Yang Z: PAML: a program package for phylogenetic analysis
by maximum likelihood. Comput Appl Biosci 1997, 13:555-556.
45. Yang Z, Nielsen R: Estimating synonymous and nonsynony-
mous substitution rates under realistic evolutionary models.
Mol Biol Evol 2000, 17:32-43.
46. R Development Core Team: R: a Language and Environment for Statis-
tical Computing Vienna, Austria: R Foundation for Statistical
Computing; 2006.
47. Coulombe-Huntington J, Majewski J: Characterization of intron
loss events in mammals. Genome Res 2007, 17:23-32.
48. The Caml Language []