Báo cáo y học: "Disruption and pseudoautosomal localization of the major" ppt
Bạn đang xem bản rút gọn của tài liệu. Xem và tải ngay bản đầy đủ của tài liệu tại đây (1.48 MB, 16 trang )
Genome Biology 2007, 8:R175
comment reviews reports deposited research refereed research interactions information
Open Access
2007Dohmet al.Volume 8, Issue 8, Article R175
Research
Disruption and pseudoautosomal localization of the major
histocompatibility complex in monotremes
Juliane C Dohm
*
, Enkhjargal Tsend-Ayush
†
, Richard Reinhardt
*
,
Frank Grützner
†
and Heinz Himmelbauer
*
Addresses:
*
Max Planck Institute for Molecular Genetics, Ihnestr. 63-73, 14195 Berlin, Germany.
†
School of Molecular and Biomedical Science,
The University of Adelaide, Adelaide 5005 SA, Australia.
Correspondence: Heinz Himmelbauer. Email:
© 2007 Dohm et al.; licensee BioMed Central Ltd.
This is an open access article distributed under the terms of the Creative Commons Attribution License ( which
permits unrestricted use, distribution, and reproduction in any medium, provided the original work is properly cited.
The major histocompatibility complex in monotremes<p>The characterization and chromosomal mapping of major histocompatibility complex (MHC)-containing BAC clones from platypus and the short-beaked echidna reveals new insights into the evolution of both the mammalian MHC and monotreme sex chromosomes.</p>
Abstract
Background: The monotremes, represented by the duck-billed platypus and the echidnas, are the
most divergent species within mammals, featuring a flamboyant mix of reptilian, mammalian and
specialized characteristics. To understand the evolution of the mammalian major histocompatibility
complex (MHC), the analysis of the monotreme genome is vital.
Results: We characterized several MHC containing bacterial artificial chromosome clones from
platypus (Ornithorhynchus anatinus) and the short-beaked echidna (Tachyglossus aculeatus) and
mapped them onto chromosomes. We discovered that the MHC of monotremes is not contiguous
and locates within pseudoautosomal regions of two pairs of their sex chromosomes. The analysis
revealed an MHC core region with class I and class II genes on platypus and echidna X3/Y3. Echidna
X4/Y4 and platypus Y4/X5 showed synteny to the human distal class III region and beyond. We
discovered an intron-containing class I pseudogene on platypus Y4/X5 at a genomic location
equivalent to the human HLA-B,C region, suggesting ancestral synteny of the monotreme MHC.
Analysis of male meioses from platypus and echidna showed that MHC chromosomes occupy
different positions in the meiotic chains of either species.
Conclusion: Molecular and cytogenetic analyses reveal new insights into the evolution of the
mammalian MHC and the multiple sex chromosome system of monotremes. In addition, our data
establish the first homology link between chicken microchromosomes and the smallest
chromosomes in the monotreme karyotype. Our results further suggest that segments of the
monotreme MHC that now reside on separate chromosomes must once have been syntenic and
that the complex sex chromosome system of monotremes is dynamic and still evolving.
Background
The major histocompatibility complex (MHC) is of central
importance for adaptive and innate immunity in vertebrates
[1]. Sequencing MHCs from several species of eutherian
mammals and human has led to the identification of approx-
imately 220 genes located within an interval of 3.5-4 Mbp
[2,3]. The MHC region contains genes encoding class I and
class II receptors that are involved in peptide display, genes
Published: 29 August 2007
Genome Biology 2007, 8:R175 (doi:10.1186/gb-2007-8-8-r175)
Received: 28 May 2007
Revised: 26 August 2007
Accepted: 29 August 2007
The electronic version of this article is the complete one and can be
found online at />R175.2 Genome Biology 2007, Volume 8, Issue 8, Article R175 Dohm et al. />Genome Biology 2007, 8:R175
that are responsible for peptide generation and transport, as
well as genes encoding complement factors or cytokines.
Many other genes with functions that are not related to
immunity and defense are also located within the MHC.
The eutherian MHC subdivides into a single class II region
followed by several class I regions, interlaced by framework
gene regions. The central framework gene region, located
between the class II region and the class I region that encodes
the HLA-B and HLA-C genes in human, is also known as the
class III region (flanked by the genes Btnl2 and Bat1/Mccd1;
Figure 1a). This genomic architecture of MHC regions is
remarkably well conserved in eutherian mammals. For
instance, the position of the human HLA-B,C class I gene
cluster matches rat RT1-CE, mouse H2-D,L,Q, swine SLA-
6,7,8 and ovine β [4-8]. In each of these species, this particu-
lar class I gene block is flanked by the Bat1/Mccd1 and Pou5f1
framework genes. The same is true for the three other human
class I gene clusters and their counterparts in other eutherian
genomes, all of which locate at the same position, that is, are
flanked by the same framework genes (see framework gene
numbering in Figure 1a), even though not all of them contain
active class I gene loci. The fact that only certain positions of
the MHC support 'homing' of class I genes has previously
been recognized and is known as the framework hypothesis
[9].
In contrast to the conserved MHC architecture, much plastic-
ity is observed within class I gene containing segments and, to
a lesser extent, in the class II region. Orthologous class I
genes are found in closely related species, for example,
human and chimpanzees. Class I gene orthology becomes less
apparent when more distantly related mammals are com-
pared. This is attributed to the ongoing process of new class I
genes arising by gene duplication and, at the same time, their
disappearance from the genome by mutational inactivation or
by deletion. For example, the sequences of the classical class
I genes from rat form a separate clade when compared to class
I genes from mouse, indicating species-specific evolution
since separation of the two lineages 20 million years (Myr)
ago [4].
In addition to comparative studies on eutherian mammals,
other species have been studied and compared to the euthe-
rians: recently, the sequence of a metatherian mammal (mar-
supial) MHC from the opossum (Monodelphis domestica)
was assembled, based on whole genome shotgun sequence
data [10]. Its annotation revealed a core MHC region, resem-
bling the eutherian class II region, that, unlike in eutherian
mammals, also encodes the class I genes. The opossum MHC
was found to be syntenic to a human MHC region of several
megabase pairs. Also in Xenopus tropicalis extensive synteny
with the eutherian MHC has been found. Ohta et al. [11] ana-
lyzed the scaffolds that were generated from assembling
Xenopus whole genome shotgun data for the presence of
MHC-encoded genes, including framework genes. They
found eight 200-900 kbp scaffolds that contained orthologs
to many of the genes in the eutherian MHC. The interpreta-
tion is that the syntenies of the MHC region are ancient and
predate the amphibian-mammalian split 350 Myr ago even
though it has not been shown that these scaffolds reside on a
single chromosome. In contrast, the MHC of the chicken, rep-
resenting a lineage that is closer to mammals than Xenopus
(distance aves-mammalia of 310 Myr [12]), is highly derived
and does not align well with the human MHC [13]. The
chicken MHC is remarkably different and contains only 19
genes within 92 kbp on chicken chromosome 16.
Monotremes are prototherian mammals, possessing fur and
mammary glands, but uniquely combining reptilian features,
for example, egg-laying with mammalian characteristics.
They are the earliest offshoot of the mammalian clade that
separated from theria (consisting of metatheria and eutheria,
or marsupials and placental mammals, respectively) over 160
Myr ago [14]. The only extant prototheria are the duck-billed
platypus (Ornithorhynchus anatinus), the short-beaked
echidna (Tachyglossus aculeatus) and three species of long-
beaked echidnas (Zaglossus sp.) [15]. The geographic range
of current monotremes is restricted to Australia and nearby
islands, including Papua New Guinea. In the following, when
mentioning echidna, we refer to the short-beaked echidna,
also known as the spiny anteater.
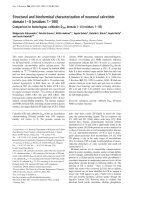
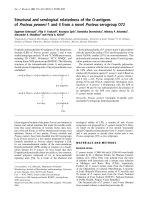
Comparative map of the mammalian MHC regionFigure 1 (see following page)
Comparative map of the mammalian MHC region. (a) Aligned MHC regions of human, rat, opossum [4,5,10] and the sequenced portions of the platypus
MHC. Intervals are color-coded: class I regions are shown in red; class II regions in blue; and framework regions including class III in yellow. Circled
numbers denote framework genes that typically flank these intervals: 1, Col11a2; 2, Btnl2; 3, Bat1/Mccd1; 4, Pou5f1; 5, Gnl1; 6, Flj22638; 7, Trim39; 8, Trim26;
9, Tctex4; 10, Mog. Dotted lines link orthologous positions defined by genes 1-10 in the four species. Tctex4 is missing from the MHC of opossum.
Question marks indicate that the borders of the class I/II region in platypus have not been cloned. Rat has three additional RT1-M gene blocks outside the
interval shown. (b) Comparison of the class II region of rat and human, and the opossum class I/II region to platypus based on annotation of platypus BAC
462c1. Genes are color-coded: framework genes are shown in green; class I genes in red; class II α chains in light blue; and class II β chains in dark blue (for
phylogenetic relations among class II genes, see Additional data file 2). Non-class I and non-class II genes or pseudogenes unique for a given species are
displayed in grey. Hatching between BTNL2 and BTNL5 in opossum and between DRB1 and DRB9 in the HLA indicates that further BTNL or DRB genes are
located within these intervals. Orthologous genes are linked by colored bars. (c) Detailed map of the Bat4 to Cdsn interval, including a class I gene block.
Genome Biology 2007, Volume 8, Issue 8, Article R175 Dohm et al. R175.3
comment reviews reports refereed researchdeposited research interactions information
Genome Biology 2007, 8:R175
Figure 1 (see legend on previous page)
R175.4 Genome Biology 2007, Volume 8, Issue 8, Article R175 Dohm et al. />Genome Biology 2007, 8:R175
Because of their unique phylogenetic position, monotremes
are ideal species to unravel the characteristics of the ancestral
mammalian MHC. So far, little is known about MHC genes in
monotremes and there are only two reports where individual
cDNA clones were identified as MHC class I or class II genes
[16,17].
The general importance of monotremes for understanding
the evolution and function of the mammalian genome is now
generally accepted and is reflected by the presently ongoing
efforts to sequence the platypus genome, with funding from
the National Institute of Health (NIH) [18].
The platypus karyotype consists of 21 pairs of autosomes and
10 sex chromosomes (X1Y1-X5Y5 in males and X1X1-X5X5 in
females). In addition, the platypus karyotype contains a
number of very small chromosomes that have been proposed
to be bird-like microchromosomes; however, the homology
between these chromosomes and chicken microchromo-
somes has been controversial and no homologies have been
identified to date [19,20]. The sex chromosomes assemble as
a chain at prophase I during male meiosis where they adopt
an XY alternating pattern, which ensures the segregation into
X1-X5 and Y1-Y5 bearing sperm [21,22]. Although XY shared
regions are required to ensure meiotic pairing, chromosome
painting could not identify pseudoautosomal regions on some
of the sex chromosomes so far. The echidna karyotype con-
tains 27 autosomes and 10 sex chromosomes in females and 9
sex chromosomes in males, which where determined by
counting the number of elements of the meiotic chain [23,24].
Very little is known about the gene content of both sex chro-
mosome systems.
Here we describe the identification and characterization of
genomic clones encompassing parts of the monotreme MHC.
The unexpected localization of MHC genes on sex chromo-
somes of platypus and echidna provides valuable information
about chromosomal homologies between aves, monotremes
and eutheria, as well as homologies between platypus and
echidna sex chromosomes.
Results
Identification of BAC clones from the platypus and
echidna MHC
We identified bacterial artificial chromosome (BAC) clones
from the platypus MHC by hybridization with oligonucleotide
probes designed from the platypus class I gene Oran2-1 [16],
the class II gene DZB [17], and from the MHC framework
genes Bat1 and Pou5f1 encoding a DEAD-Box helicase and a
stem cell transcription factor, respectively. Probes for the
framework genes were designed by aligning the chicken Bat1
and Pou5f1 mRNA sequences with the rat MHC [4]. A 36-mer
oligonucleotide probe for Bat1 corresponded to rat BAT1
amino acid residues 265-276, which are 100% conserved
between rat, chicken and zebrafish. A 37-mer oligonucleotide
probe was generated matching a segment of Pou5f1 whose
translation had 100% amino acid identity in rat, chicken and
zebrafish (rat POU5F1 residues 174-185).
Twenty-four platypus BACs positive with the class I probe
and ten clones positive with the class II probe were identified
in a BAC library with eleven-fold genome coverage. Based on
Southern blots, two clones (BACs 446c3 and 462c1) were pos-
itive with both class I and class II gene probes (data not
shown). More than 30 BAC clones were identified with the
Bat1 and Pou5f1 probes. These genes co-localized in platypus,
as several BACs hybridized with both probes. We sequenced
and annotated the following three platypus BAC clones: BAC
462c1 (GenBank EU030443
, class I and class II positive; Fig-
ure 2a); BAC 466a15 (GenBank EU030444
, containing Bat1
and Pou5f1; Figure 2b); and BAC 362a17 (GenBank
EU030442
, class I positive). In the following, these BACs will
be referred to as platypus BAC1, BAC2, and BAC3.
Using probes based on platypus MHC sequences, we searched
for BACs from the corresponding regions in the echidna
genome. A platypus Tap2 probe identified two positive clones
in echidna (BACs 48g5 and 287o10; Additional data file 1a).
Separate Southern blots prepared from these clones were
hybridized with the Oran2-1 probe [16] and with a pool of two
different class II gene oligonucleotide probes (Additional data
file 1b,c). Echidna BAC 48g5 was found to contain class I and
class II gene sequences, while BAC 287o10 contained class I
sequences but no class II genes. Shared restriction fragments
indicated that these two clones were from the same locus and
overlapped.
Further echidna BAC colony screens were done using oligo-
nucleotide probes designed on the platypus genes Bat1 and
Pou5f1. For each gene, three probes were synthesized and
pooled before labeling (one pool per gene). Echidna BAC
clones 107j4, 129j16, 152g23 and 268a21 could be confirmed
on Southern blots to contain both the Bat1 and Pou5f1 genes
(Additional data file 1d,e).
BAC sequence annotation
We generated reference gene models for the genes identified
within platypus BACs 1-3, combining the gene prediction pro-
grams Genscan [25] and Genewise [26] as tools and utilized
rat MHC protein sequences [4] as input for Genewise predic-
tions. The translation products from predictions with either
program were compared to each other and to the rat protein
as a reference by pairwise blast (Additional data file 7). In the
absence of monotreme expressed sequence tag (EST)
sequences for the majority of genes, the annotations covered
open reading frames (ORFs) and did not include untranslated
regions (UTRs). Genscan and Genewise complement each
other: The accuracy of Genewise is very good in coding
regions that are well conserved, while theoretical gene models
predicted by Genscan are exclusively based on signals and
content. In total, we annotated 25 genes and two pseudogenes
Genome Biology 2007, Volume 8, Issue 8, Article R175 Dohm et al. R175.5
comment reviews reports refereed researchdeposited research interactions information
Genome Biology 2007, 8:R175
in the three BAC sequences. Within 320,837 sequenced bases
in BAC1 and BAC2, one gene could be annotated with full
ORF plus UTRs (DZB gene), 20 genes were annotated with
their full ORFs only, two genes had missing 5' ends because of
low conservation and two genes were only partially contained
in the sequenced interval. One annotated feature was a non-
processed pseudogene fragment that lacked an intact ORF,
though partial reconstruction of the protein sequence was
possible. Only one single gene feature was discovered and
annotated as a pseudogene within BAC3 (see below).
Characterization of a processed class I pseudogene
containing platypus BAC clone
Platypus BAC3 was assembled to a finished sequence of
146,150 bp. Fluorescence in situ hybridization (FISH) map-
ping located BAC3 on the long arm of platypus chromosome
3 (data not shown). During annotation, no genes were identi-
fied with the exception of an intronless class I gene that con-
tained a non-interrupted ORF of 359 amino acids. This gene
showed 99% sequence identity to OranPS1-2, a class I
sequence previously described as a pseudogene [16]. The
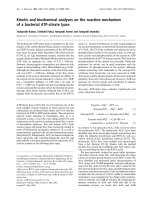
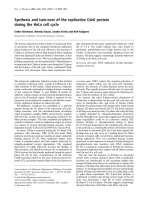
Platypus BACs and their gene contentFigure 2
Platypus BACs and their gene content. (a) BAC clone 462c1, referred to as "BAC1" in the Results section (b) BAC 466a15 ("BAC2" in Results). Colors
represent types of genes. Red: Class I genes; Blue: Class II genes; Green: Framework genes. Transcriptional orientation of genes is indicated by arrows.
Tap1
Tap2
DZB
DRA
OA_B _4 66a15
50 100
1500
Bat4
G4
Apom
Bat3
Bat2
Aif 1
Lst1
Ltb
Tnf
Lta
Nf kbil1
Atp6v 1g2
Bat1
194
Pou5f 1
Tcf 19
Hcr
Spr1
Cdsn
(a)
MHC Class I
ψ
OA_B _4 62c1
50 100
0
12650 100
0
126
Psmb8
MHC Class I - 2
MHC Class I - 1
Mccd1
(b)
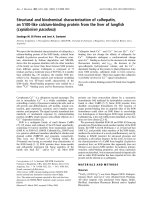
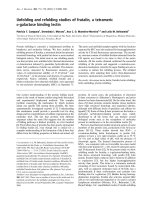
Phylogenetic analysis of class II α chain genesFigure 3 (see following page)
Phylogenetic analysis of class II α chain genes. Cafa, Canis familiaris (dog); Hosa, Homo sapiens (human); Bota, Bos taurus (bovine); Rano, Rattus norvegicus
(rat); Maru, Macropus rufogriseus (red-necked wallaby); Modo, Monodelphis domestica (opossum); Orcu, Oryctolagus cuniculus (rabbit); Eqca, Equus caballus
(horse); Cacr, Caiman crocodilus (spectacled caiman); Gaga, Gallus gallus (chicken); Oran, Ornithorhynchus anatinus (platypus); Xela, Xenopus laevis (African
clawed frog). The abbreviations used to describe taxonomic affiliation of each species in the tree are outlined in Figure 4a. A black diamond highlights
platypus DRA. Tree construction using the NJ method is outlined in Materials and methods. Numbers indicate bootstrap support in percent. Branch
lengths are proportional to number of substitutions. The scale bar indicates 20% substitutions per site. Sequences used and their accession numbers are
listed in Additional data file 10.
R175.6 Genome Biology 2007, Volume 8, Issue 8, Article R175 Dohm et al. />Genome Biology 2007, 8:R175
Figure 3 (see legend on previous page)
ELCa-CafaDOA
EEP-HosaDOA
ELCe-BotaDOA
EEG-RanoDOa
M-MaruDNA
M-ModoDNA1
M-ModoDNA2
M-ModoDQA1
M-ModoDQA2
EEG-OrcuDQA
EEG-RanoBa
ELP-EqcaDQA
ELCe-BotaDQA3
ELCe-BotaDQA2
ELCa-CafaDQA
EEP-HosaDQA2
EEP-HosaDQA1
EEG-OrcuDPA
EEG-RanoHa
EEP-HosaDPA
M-ModoDPA
SSAC-Cacr
SSAD-Gaga1
P-OranDRA
M-ModoDRA
M-MaruDRA
EEG-RanoDa
ELCe-BotaDRA
ELCa-CafaDRA
EEP-HosaDRA
AA-XelaDBA
AA-XelaDAA
AA-Xela1
SSAD-Gaga2
M-ModoDMA
EEG-Orc uDMA
EEG-RanoMa
EEP-HosaDMA
ELCe-BotaDMA
ELCa-CafaDMA
72
89
79
99
99
100
100
100
55
99
100
100
65
99
99
63
99
99
72
90
60
60
60
70
76
50
51
96
99
81
52
59
0.2
Genome Biology 2007, Volume 8, Issue 8, Article R175 Dohm et al. R175.7
comment reviews reports refereed researchdeposited research interactions information
Genome Biology 2007, 8:R175
class I homology was considered as the reason why the clone
had been positive in the BAC colony screen, even though the
clone was not MHC-derived.
Analysis of the platypus core MHC
In the finished sequence of platypus BAC1 (126,374 bp), seven
genes were identified, including two class II genes, two class I
genes and three framework genes. One of the two class II
genes has a sequence identity of 97% to the platypus class II β
chain gene DZB [17], and presumably represents a novel DZB
allele. The other class II locus encodes a class II α chain gene,
and phylogenetic analysis suggested orthology with the DRA
genes of the tammar wallaby (marsupial) and eutheria (Fig-
ure 3 and Additional data file 6). The classification of this
gene as a platypus DRA ortholog is supported by neighbor
joining (NJ) and maximum parsimony (MP) analysis. On
maximum likelihood (ML) trees, the branching of DRA
orthologs was not resolved (Additional data file 5). The
orthology of the α chain gene to DRA genes is surprising,
since DZB locates to a separate branch in phylogenetic analy-
ses and is non-orthologous to all other β chain subfamilies
[17].
The three framework genes were discovered as the platypus
orthologs of the immunoproteasome subunit Psmb8, as well
as Tap1 (only partially contained in the BAC sequence) and
Tap2, which encode for subunits of the antigen peptide trans-
porter. These genes are typically found in the class II region
of mammalian MHCs, even though they are involved in the
generation and transport of peptides for display by class I
molecules. However, in contrast to the MHCs of eutheria and
similar to the opossum MHC, platypus possesses an MHC
with class II and class I genes being co-localized (Figure 1a,b).
The two class I loci are tentatively named platypus class I-1
and class I-2 genes. We calculated phylogenetic trees includ-
ing class I genes from eutheria, marsupials, monotremes, rep-
tiles and birds, as well as amphibia. While for eutheria only
major lineages were represented in the tree (primates, car-
nivors, rodents, cetartiodactyls and so on), we included class
I sequences from all available marsupial taxons (presently
five species), and all monotreme class I sequences currently
in GenBank. In addition, the analysis encompassed class I
genes from two species of birds (chicken and duck) and four
species of reptiles. Amphibian class I genes served as out-
group (Figure 4). All monotreme sequences grouped at the
base of the mammalian subclade. Unexpectedly, echidna and
platypus class I sequences previously described by Miska and
co-workers [16] grouped together, whereas the novel platypus
class I-1 and class I-2 genes were in a separate branch (Figure
4; Additional data files 3 and 4). The divergence time between
echidna and platypus has been estimated to be approximately
20 Myr [27-29], a similar time span as the reported split
between the mouse and rat lineages [30]. It has been shown
in the two rodent species that class Ia genes are species-spe-
cific, while orthology exists among the more slowly evolving
Ib genes [4]. Following this reasoning, the two novel platypus
gene classes I-1 and I-2 could be classical class I genes (Ia)
and the loci that Miska et al. [16] identified in both echidna
and platypus correspond to non-classical (Ib) class I genes.
However, this hypothesis would need support from expres-
sion data.
Analysis of the platypus MHC Bat4-Cdsn interval
The sequence of BAC2 was assembled to a finished length of
194,463 bp. It contained 20 genes in a region that extended
from Bat4 to Cdsn (Figures 1c and 2b). Thus, this sequence
covers part of the class III region up to Bat1/Mccd1, spans a
segment that in the human MHC encodes the HLA-B and
HLA-C genes, and contains part of the adjacent framework
region distal to Pou5f1. The gene order and transcriptional
orientation of genes is the same as in other mammalian
MHCs. However, we could not identify Ncr3 in the platypus
sequence. Ncr3 encodes the natural cytotoxicity triggering
receptor 3 and has not been annotated in the opossum MHC
but was discovered in both the human HLA and rat RT1.
Human and rat NCR3 proteins evolve rapidly and share only
64% amino acid identity (Additional data file 7), which is
much lower than the average identity of 88% that has been
observed for protein orthologs in these species [31]. Thus,
similarity to a putative platypus Ncr3 gene may have been too
low for detection. Between Aif1 and Lst1 where Ncr3 is
located in human and rat, Genscan predicts a platypus gene
with correct position and orientation. This prediction could
not be verified by homology searches in the NCBI databases,
but might be a very diverged version of the Ncr3 gene. Alter-
natively, Ncr3 might have been deleted from the platypus
genome or might be eutheria specific.
Between platypus proteins and their orthologs in rat or
human we found an average of 61-62% amino acid identity
(Additional data file 7) and observed much variation in the
degree of sequence conservation (range: 27-99%). For
instance, BAT1, which is involved in mRNA splicing and
transport, was 99% conserved, showing that little innovation
in such processes has occurred over the past 160 Myr. In con-
trast, the framework gene Lst1, encoding a protein of
unknown function, had an identity of less than 30%.
The region between Bat1 and Pou5f1 harbors a class I gene
block in the MHC of placental mammals. In rat, this region
spans 340 kbp and contains 16 class I genes. In platypus, the
corresponding region is only 19 kbp in size and contains a
class I gene fragment (Oran-ps1) that consists of two exon
fragments encoding α2 and α3 domains that are separated by
a 283 bp intron. This suggests that the interval once encoded
at least one active class I gene in platypus. The sequence iden-
tity of the Oran-ps1 translation product to known and new
monotreme class I sequences is only 30-40%. We could not
find the active counterpart of Oran-ps1 by searching the
ENSEMBL platypus whole-genome assembly Oana-5.0 [32],
suggesting that Oran-ps1 was inactivated a long time ago. The
R175.8 Genome Biology 2007, Volume 8, Issue 8, Article R175 Dohm et al. />Genome Biology 2007, 8:R175
Figure 4 (see legend on next page)
EEP-Hosa5
EEP-Hosa6
EEP-Hosa1
EEP-Hosa2
EEP-Hosa3
EEP-Hosa4
ELP-Eqca2
ELP-Eqca1
ELCa-Cafa1
ELCa-Cafa2
EES-Tube1
EES-Tube2
EEG-Orcu1
EEG-Orcu2
EEG-Rano1
EEG-Rano2
M-Modo-UA1
M-Modo-UF
M-Modo-UG
M-Modo-UK
M-Isma2-1-3
M-Trvu
M-Maru1
M-Maeu
M-Maru3
M-Maru2
P-Oran-ps1
P-Oran-I-1
P-Oran-I-2
P-Oran-2-1
P-Oran-ps2
P-Taac1
P-Taac2
SSAD-Anpl2
SSAD-Anpl1
SSAD-Gaga1
SSAD-Gaga2
ST-Pesi
SSL-Amam2
SSL-Amam1
SSL-Nesi
SSL-Sppu1
SSL-Sppu2
AC-Amme1
AC-Amme2
AA-Rapi1
AA-Rapi2
AA-Xela
AA-Xetr
100
100
100
100
100
100
99
100
99
97
99
94
99
51
76
98
100
97
57
58
99
100
83
93
99
86
52
99
66
75
59
99
100
100
100
95
79
99
68
83
65
91
57
0.1
Tetrapoda
Amn iota
| Mammalia
| | Prototheria [P]
| | Theria
| | Eutheria
| | | Euar ch onto glir es
| | | | Glires [EEG]
| | | | Primates [EEP]
| | | | Scandentia [EES]
| | | Laurasiatheria
| | | Carnivora [ELCa]
| | | Cetartiodactyla [ELCe]
| | | Perissodactyla [ELP]
| | Metatheria [M]
| Sauropsida
| Sauria
| | Archosauria
| | | Crocodylidae [SSAC]
| | | Dinosauria, Aves [SSAD]
| | L ep ido saur ia [ SSL]
| Testudines [ST]
Amphibia
Batrachia
Anura [AA]
Caudat a [AC]
(a)
(b)
L
L
L
L
L
L
L
L
L
L
L
L
L
L
L
L
L
L
L
L
L
L
L
L
L
Genome Biology 2007, Volume 8, Issue 8, Article R175 Dohm et al. R175.9
comment reviews reports refereed researchdeposited research interactions information
Genome Biology 2007, 8:R175
283 bp intron within Oran-ps1 is not conserved in other class
I loci and cannot, therefore, be used for phylogenetic analysis
to date the age of the gene.
Chromosomal mapping of platypus MHC BAC clones
We determined the localization of the sequenced BAC clones
on platypus chromosomes using FISH. Surprisingly, the
results showed that the monotreme MHC is not contiguous,
and maps to pseudoautosomal regions (PARs) of two pairs of
sex chromosomes: BAC1 was localized on X3/Y3 and BAC2
mapped to Y4/X5 (Figure 5a).
FISH mapping of echidna MHC BACs
To investigate whether the pseudoautosomal location of the
MHC is unique to platypus or a common feature in
monotremes, we isolated and characterized MHC clones from
echidna (see above and Additional data file 1). Two sets of
echidna BAC clones were obtained. The first set of BACs cov-
ered an interval equivalent to platypus BAC1 and contained
the core MHC region with class I and class II genes. The sec-
ond set of BACs spanned the region encompassing Bat1 and
Pou5f1 (Additional data file 1). The FISH mapping results
revealed that the echidna MHC resides, similar to platypus,
on two different pairs of sex chromosomes (Figure 5b). The
selected BAC containing the core MHC region mapped to X3/
Y3, as in the platypus. The echidna BAC that contained Bat1
and Pou5f1 located to X4/Y4, different to the location in
platypus (Y4/X5). In meiotic chains, chromosomes X3, Y3,
X4, Y4, and X5 correspond to chain elements 5 to 9. Figure 6
shows the FISH mapping result of two echidna BACs onto
echidna male meiotic chains. In the chain, the two echidna
BACs map to elements 5, 6, 7, and 8, whereas the correspond-
ing BACs in platypus locate in elements 5, 6, 8 and 9. Thus,
platypus Y4X5 occupies a different position in the echidna sex
chromosome chain. Since the chromosome morphology of
platypus X5 appears to be identical to X4 in echidna, this indi-
cates that platypus X5 has changed its position in the echidna
chain.
Discussion
The platypus MHC is unusual when compared to MHCs from
eutherian mammals, because it contains a core region that
encodes both class I and class II genes, though such a com-
mon class I/II region has also been described in the opossum
[10]. The coincidence of compact class I/II regions in both a
monotreme and a marsupial supports the hypothesis that this
is the ancestral organization of the mammalian MHC. How-
ever, a platypus class I gene fragment, Oran-ps1, exists at a
position that contains a class I gene block in eutheria. Also,
the opossum MHC contains a class I-like MIC gene at this
position (Figure 1). Both findings contradict the strict concept
of a core MHC and indicate that early mammals already
encoded class I genes outside a common class I/II region at
positions equivalent to class I gene blocks in eutheria, embed-
ded between framework genes.
The intron-containing class I pseudogene Oran-ps1 and the
surrounding region that corresponds to the distal class III
region and beyond map to platypus chromosome Y4/X5. In
contrast, the core MHC locates to X3/Y3. In the eutherian
MHC, class I genes are distributed among several class I gene
clusters, separated by hundreds of kilobase-pairs of
intervening regions. Despite such distances, concerted evolu-
tion takes place between different class I blocks within a spe-
cies. For instance, the rat RT1-A and RT1-CE regions are more
than 1.2 Mbp apart and have a history of transposition events
that led to the presence of similar class I genes and shared
non-class I gene sequences (gene fragments) in both inter-
vals. Similar but unrelated transposition events were
observed within the mouse MHC region, showing that reor-
ganization across large genomic distances is fairly common
[4]. These distances seem to be large when considering linear
DNA but the regions may be actually juxtaposed in chroma-
tin, facilitating transposition. Oran-ps1 is flanked by Bat1 and
Pou5f1 and these framework genes also flank a class I gene
cluster in the eutherian MHC. Thus, Oran-ps1 may have been
generated during concerted evolution of class I genes in the
platypus MHC at a time when the distal class III region and
the core MHC were still on the same chromosome. However,
concerted evolution between MHC segments on different
platypus chromosomes could be still ongoing, by means of
trans-interaction of separate chromosomes [33].
We localized the monotreme MHC to PARs of sex chromo-
somes. This is the first time MHC genes have been mapped
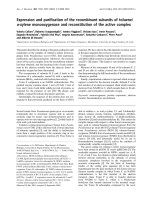
Phylogenetic analysis of platypus MHC class I genesFigure 4 (see previous page)
Phylogenetic analysis of platypus MHC class I genes. (a) Species tree of taxonomic entities represented in the trees shown in Figures 3 and 4b. (b) MHC
class I gene phylogenetic tree. Hosa, Homo sapiens (human); Eqca, Equus caballus (horse); Cafa, Canis familiaris (dog); Tube, Tupaia belangeri (Northern tree
shrew); Orcu, Oryctolagus cuniculus (rabbit); Rano, Rattus norvegicus (rat); Modo, Monodelphis domestica (opossum); Isma, Isoodon macrourus (Northern
brown bandicoot); Trvu, Trichosurus vulpecula (silver-grey brushtail possum); Maru, Macropus rufogriseus (red-necked wallaby); Maeu, Macropus eugenii
(tammar wallaby); Oran, Ornithorhynchus anatinus (platypus); Taac, Tachyglossus aculeatus (echidna); Anpl, Anas platyrhynchos (duck); Gaga, Gallus gallus
(chicken); Pesi, Pelodiscus sinensis (Chinese softshell turtle); Amam, Ameiva ameiva (lizard); Nesi, Nerodia sipedon (snake); Sppu, Sphenodon punctatus
(tuatara); Amme, Ambystoma mexicanum (axolotl); Rapi, Rana pipiens (Northern leopard frog); Xela, Xenopus laevis (African clawed frog); Xetr, Xenopus
tropicalis (Western clawed frog). Black diamonds highlight platypus class I sequences identified in this study. The marsupial Isoodon (Isma2-1-3) is
represented by an artificial class I sequence that we generated from three separate overlapping class I sequence entries for this species. Tree construction
using the NJ method was as described in Materials and methods. Numbers indicate bootstrap support in percent. Branch lengths are proportional to
number of substitutions. The scale bar indicates 10% substitutions per site. Sequences used and their accession numbers are listed in Additional data file
11.
R175.10 Genome Biology 2007, Volume 8, Issue 8, Article R175 Dohm et al. />Genome Biology 2007, 8:R175
onto sex chromosomes in any mammal or vertebrate. In all
mammals investigated so far, the MHC region is located on a
single autosome, and in most cases without interruptions.
Exceptions are the swine leukocyte antigen (SLA) complex,
where the centromere of chromosome 7 separates the class II
region from the other parts of the MHC [34] and the recently
described class I genes of the tammar wallaby, which were
found to be dispersed in the wallaby genome [35].
The multiple sex chromosomes in platypus and echidna pair
at the first meiotic division and form a sex chromosome chain
during prophase I. PARs are necessary to ensure pairing and
segregation of most mammalian sex chromosomes. The ten
sex chromosomes of platypus, therefore, would require nine
PARs to connect the sex chromosomes at meiosis. The extent
of XY homology (that is, the size of PARs; see below) is clearly
different among the sex chromosomes. While some PARs are
large enough and could easily be identified by chromosome
painting, other PARs seem to be much smaller and did not
show XY homology using whole chromosome paints [21,22].
We found that MHC genes reside on two of these small PARs
in platypus. BAC2 was mapped to the PARs of Y4 and the
short arm of X5. This fits with the orientation of X5 in the
chain where the short arm lies towards Y4 [21]. Together with
the fact that chromosome painting could not detect these
PARs, it shows that the Y4X5 shared region is much smaller
than the extensive homology found between, for example, X1
and Y1.
PAR sizes vary widely. For instance, the human PAR regions
PAR1 and PAR2 differ eight-fold with respect to their sizes,
and in the mouse, PAR1 is almost four-fold smaller than in
human [36]. The small size of PARs and an obligatory
crossover to ensure proper segregation at meiosis results in a
high recombination frequency in mammalian PARs [37]. It is
therefore interesting to note that the MHC, which is one of the
recombination hotspots in the human genome, resides within
the PAR, another recombination hotspot.
Another special feature of the monotreme karyotype is the
presence of several tiny chromosomes. Initially they where
regarded similarly to reptilian microchromosomes [38,39],
which was later disputed on the basis of even distribution of
chromosome size in the monotreme karyotype [19].
Microchromosomes have long been regarded as heterochro-
matic elements but have been shown recently to represent the
gene rich regions of the chicken genome [40]. The identifica-
tion of the ten sex chromosomes in platypus revealed that
some distinctively small chromosomes are not autosomes,
but part of the sex chromosome system (Y3, X4, Y4). The
mapping of MHC genes (class I, class II, Tap1, Tap2) on X3Y3
provides the first evidence for homology to the MHC bearing
chicken microchromosome 16. Likewise, five of the MHC
framework genes that map on Y4X5 (Bat2, Aif1, Tnf/Lta,
Atp6v1g2) locate to chicken microchromosome 17, establish-
ing another novel synteny link between the genomes of
monotremes and birds.
Chromosomal localization of MHC genes in platypus and echidnaFigure 5
Chromosomal localization of MHC genes in platypus and echidna. (a) Platypus BAC clones 466a15 (green) and 462c1 (red) hybridized to male platypus
metaphase spreads. Signals were identified on the pseudoautosomal regions of chromosomes Y4X5 and Y3X3. (b) FISH mapping of echidna BAC clones
287o10 (green) and clone 268a21 (red) on male echidna metaphase spreads. Signals were detected on the pseudoautosomal regions of Y3X3 and Y4X4.
(a) (b)
Genome Biology 2007, Volume 8, Issue 8, Article R175 Dohm et al. R175.11
comment reviews reports refereed researchdeposited research interactions information
Genome Biology 2007, 8:R175
Why do MHC-bearing sex chromosomes of platypus and
echidnas occupy different positions in male meiotic chains?
This work as well as a recent study using chromosome paint-
ing and gene mapping has discovered differences in hom-
ology and order of the platypus and echidna sex chromosome
chains (Rens W., O'Brien P.C.M., Grützner F., Clarke O.,
Graphodatskaya D., Tsend-Ayush E., Trifonov V., Skelton H.,
Wallis M., Veyrunes F., Graves J. A. M., Ferguson-Smith M.
A., personal communication). Here we present a model that
explains the position of MHC BACs in the sex chromosome
Chromosomal localization of echidna MHC BAC clones in male meiotic metaphase I preparationsFigure 6
Chromosomal localization of echidna MHC BAC clones in male meiotic metaphase I preparations. (a) BAC 48g5 (green) on Y3X3. (b) DAPI inverted
picture. The elements of the chain are indicated by the bold lines; the elements containing MHC genes are shown in green. (c) Hybridization of BAC
268a21 on the meiotic chain. Chromosome telomeres are highlighted by hybridization of a telomere repeat (red). In (d) DAPI inverted picture. The
elements at the end of the chain are indicated by the bold lines.
(a)
(c)
(b)
(d)
R175.12 Genome Biology 2007, Volume 8, Issue 8, Article R175 Dohm et al. />Genome Biology 2007, 8:R175
chins of platypus and echidna. The key feature is a rearrange-
ment between elements of the chain, which explains the dif-
ferent positioning of the MHC bearing sex chromosomes in
platypus and echidna as well as the change of orientation of
platypus X5 in echidna. We propose that three events led to
the observed similarities and differences between platypus
and echidna sex chromosome chains (Figure 7). Firstly, an X-
autosome translocation captured the MHC-bearing chromo-
some into the sex chromosome system in a common platy-
pus/echidna ancestor. In a second step, synteny of the MHC
was disrupted by recruitment of a pair of autosomes into the
chain. In echidna, we propose a further reciprocal transloca-
tion between two sex chromosomes, leading to the observed
differences in the echidna sex chromosome chain and the
positions of the MHC chromosomes contained therein.
The comparative mapping of the MHC in echidna and platy-
pus provides evidence for homology between the sex chromo-
some systems in platypus and echidna. Our results support
the idea that an originally syntenic MHC has been disrupted
as a result of the evolution of the platypus and echidna mei-
otic sex chromosome chain. Following an initial X-autosome
translocation in a common platypus/echidna ancestor, subse-
quent translocations resulted in the differences observed in
echidna and platypus sex chromosome systems.
Materials and methods
BAC colony arrays, probe design and labeling, and
hybridization
Macroarrays and clones were obtained from the CUGI BAC/
EST resource centre (Clemson, SC, USA) for the platypus BAC
library OA_B and from the AGI BAC/EST resource centre
(Tuscon, AZ, USA) for the echidna BAC library TA_Ba. Platy-
pus colony arrays were hybridized with the following oligonu-
cleotide probes: Bat1-Gga/Rno, 5'-
TACTACGTGAAACTGAAGGACAACGAGAAGAACCGG-3';
Pou5f1-Gga/Rno, 5'-CAGACAACCATCTGCCGCTTCGAG-
GCCCTGCAGCTCA-3'; probe Oan-class I, 5'-AGGACGT-
CAGCCTGCGGTGCCGGGCCCTCGGCTTC-3', designed from
the α3-domain of platypus class I gene Oran2-1 (AY112715);
and platypus class II gene probe Oan-class II, 5'-CAGGGAAT-
GGAGCGGCCCATCCTCCCCATGTTGAA-3', designed from
the 3' UTR of the DZB gene (AY288074).
A Tap2 probe was amplified from platypus BAC 462c1 using
primers: Tap2-Orna-For, 5'-CACCGTGACCCCTCCATCTTC-
CTCA-3'; and Tap2-Orna-Rev, 5'-GTGGGGGAGAGCTCT-
GGGGGCTGGACG-3'. Tap2-positive echidna BAC clones
were characterized with the platypus Oan-class I probe (see
above) and the two class II gene probes 5'-CGGGAGACATC-
CAAGTCCAGTGGTTGCGGAATGGA-3' and 5'-TGATGCGT-
CATGGAGACTGGACCTTCCAGGTCCTG-3'. Pools of three
oligonucleotides based on platypus Bat1 and Pou5f1 were
used to identify echidna BACs. Oligonucleotide sequences
were: Oran-Bat1-1, 5'-GCCTCAACCTGAAGCACAT-
TAAACACTTCATCCTG-3'; Oran-Bat1-2, 5'-CGACGTGCAG-
GATCGCTTCGAGGTCAACATCAGCG-3'; Oran-Bat1-3, 5'-
CAGGTGGTGATCTTCGTGAAGTCAGTGCAGCGCTG-3';
Oran-Pou5f1-1, 5'-ATGGCCGGACACCTGGGTCCCGACT-
TCGCCTTCTC-3'; Oran-Pou5f1-2, 5'-GACCACCATCT-
GCCGCTTCGAGGCCCAGCAGCTGA-3'; and Oran-Pou5f1-3,
5'-CCGCGTCTGGTTCTGTAACCGCCGGCAGAAAGGCA-3'.
We labeled 25 pmol of an oligonucleotide using 25 μCi of
γ
32
PdATP (Amersham, Little Chalfont, UK) and 10 u T4-Poly-
nucleotide kinase (New England Biolabs, Ipswich, MA, USA)
in a volume of 15 μl at 37°C for 60 minutes. Unincorporated
γ
32
PdATP was removed using G-50 MicroColumns (Amer-
sham). Filters were hybridized in Church buffer (0.25 M
Na
2
HPO
4
, 1 mM EDTA, 5% SDS) at 58°C over night. Thereaf-
ter, filters were washed twice. The first washing step was car-
ried out using 2 × SSC/0.1% SDS wash solution (wash I). The
second wash was done using 0.5 × SSC/0.1% SDS (wash II).
Each incubation lasted 20 minutes. Filters were exposed on
Kodak XAR X-ray film (Sigma-Aldrich, Taufkirchen, Ger-
many) for up to 14 days at -80°C. Procedures for PCR
fragment labeling were similar, except that labeling was done
with the random primed labeling kit (Roche Diagnostics,
Mannheim, Germany), following the manufacturer's instruc-
tions, under the addition of 25 μCi of α
32
PdATP (Amersham).
Hybridizations and washing steps were carried out at 65°C.
The second washing step was done using 0.1 × SSC/0.1% SDS.
Shotgun library construction and sequencing
BAC clones were grown in 1,000 ml cultures at 37°C with agi-
tation (200 rpm) in a shaking incubator over night. DNA was
prepared using the alkaline lysis method and purification on
a CsCl gradient in a Beckman centrifuge (VTi65i2 rotor) at
45,000 rpm for 20 h, followed by DNA extraction [41].
Finally, DNA was dissolved in 100 μl 1 × TE. Using a Branson
Sonifier 250 (Branson Ultrasonic, Danbury, CT, USA), 10 μg
BAC DNA was sheared in a volume of 200 μl to an average
size of 1.5 kbp, and after precipitation blunt-ended with Kle-
now fragment (USB, Cleveland, OH, USA) and T4 DNA
polymerase (New England Biolabs). End-repaired fragments
were size selected by electrophoresis on a gel of 0.8% Sea-
Plaque GTG agarose (Biozym, Hess. Oldendorf, Germany) in
1 × TAE buffer (40 mM Tris base, 1 mM EDTA, 20 mM acetic
acid). A gel slice that contained fragments of 1.2-2 kbp was cut
out, molten at 55°C and incubated at 37°C for 3 h in the pres-
ence of 10 u agarase (Sigma-Aldrich) per 100 μl of solution.
Following chloroform-phenol extraction, the DNA was pre-
cipitated and dissolved in 10 μl 1 × TE buffer. Ligation with 30
ng of dephosphorylated, SmaI cut pUC19 and 200-300 ng
size-selected DNA was carried out at 16°C overnight, using
400 u T4 DNA ligase (New England Biolabs). A 1 μl ligation
was used for transforming 40 μl of ElectroTen Blue
Escherichia coli cells (Stratagene, La Jolla, CA, USA), follow-
ing the manufacturer's recommendations. Cells were grown
on 22 cm × 22 cm Nunc dishes on LB agar supplemented with
1 ml 2% X-Gal, 250 μl 1 M Isopropyl-β-D-thiogalactopyran-
Genome Biology 2007, Volume 8, Issue 8, Article R175 Dohm et al. R175.13
comment reviews reports refereed researchdeposited research interactions information
Genome Biology 2007, 8:R175
Model for the evolution of elements 6-10 in the male meiotic sex chromosome chains of platypus and echidnaFigure 7
Model for the evolution of elements 6-10 in the male meiotic sex chromosome chains of platypus and echidna. Three events are proposed to have led to
the observed arrangement of platypus and echidna sex chromosomes. An initial X-autosome translocation captured the MHC-containing chromosome
into the sex chromosome system. In a second step, a sex chromosome-autosome translocation occurred that disrupted the synteny of the MHC. In the
echidna lineage, a further translocation between two sex chromosomes took place (see Discussion for details).
MHC class III
X5 -autosome reciprocal
translocation
Y4 -autosom e reciprocal
translocation
MHC
(autosomal )
X5Y5
MHC class I/II
Y3 -Y5 reciprocal
translocation
Platypus X3-Y3 X4 Y4 - X5 Y5
Human 6 6
Chicken 16 17
MHC
MHC
Platypus
Echidna X3 - Y3 X4 Y4 - X5
Human 6 6
Chicken 16 17
MHC
MHC
Short - beaked echidna
Ancestral monotremes
R175.14 Genome Biology 2007, Volume 8, Issue 8, Article R175 Dohm et al. />Genome Biology 2007, 8:R175
osid (IPTG) and 400 μl 50 mg/ml ampicillin per 400 ml
medium. Colonies were arrayed into 384-well plates
(Genetix, Dornach, Germany) using in-house custom-built
robotic devices. Plates contained 2YT medium supplemented
with ampicillin (50 μg/ml) and 1 × HMFM freezing mix (0.4
mM MgSO
4
× 7H
2
O, 1.6 mM Tri-sodium citrate × 2H
2
O, 6.8
mM (NH
4
)
2
SO
4
, 3.6% glycerol, 13.2 mM KH
2
PO
2
and 26 mM
K
2
HPO
4
). Plates were incubated at 37°C for at least 12 h and
subsequently shock-frozen on dry ice. Sequencing was carried
out on PCR amplified pUC19 inserts, using the BigDye termi-
nator chemistry on ABI3700 automated sequencers. Initial
sequence coverage of BACs was up to ten-fold. Thereafter,
gaps were closed directionally. Analyzed regions were manu-
ally edited in GAP4 [42]. Annotation of assembled BACs was
carried out using Genscan and Genewise [25,26]. Exon coor-
dinates in PIPmaker format and predicted translations are
available (Additional data files 8 and 9).
Phylogenetic analysis
We searched the NCBI protein database for MHC class I
genes and class II α chain genes in all species groups ranging
from amphibians to mammals, based on the NCBI
TaxBrowser classification and recorded all the species found.
Opossum class I sequences were taken from [43]. We selected
only sequences that, by their length, indicated that they were
full-coding or nearly so, thereby excluding gene fragments
from further processing. The panel of sequences was further
reduced by manual inspection of alignments; that is, if several
similar sequences representing a gene were found in the data
set, only one was kept. We tried to maximize the number of
taxonomic entities while keeping the dataset manageable at
the same time. In order to achieve this, some taxonomic
groups were left represented by a single species only, for
example, rat for Glires and human for primates. Also, the
number of paralogs per species was reduced in most cases,
except for marsupials and monotremes. Multiple alignments
were carried out with clustalw [44] using default settings. We
calculated NJ trees using Poisson correction as substitution
model with homogeneous pattern among lineages, pairwise
deletion, and gamma distributed rates among sites with α =
2. We compared the NJ branching to MP and ML trees (Fig-
ures 3 and 4; Additional data files 3-6). ML trees were calcu-
lated using TreePuzzle [45] and visualized with TreeView
[46]. NJ and MP tree calculation and visualization were car-
ried out with MEGA 3.1 [47].
Preparation of chromosomes and meiotic cells
Mitotic metaphase chromosomes were prepared from estab-
lished platypus and echidna fibroblast cell lines. Primary cul-
tures were set up from toe web from animals captured at the
Upper Barnard River, New South Wales, Australia, during
breeding season (AEC permit no. S-49-2006 to FG). The cap-
tured animals were killed with an intraperitoneal injection of
pentobarbitone sodium (Nembutal, Boehringer Ingelheim,
North Ryde, NSW, Austrialia) at a dose of 0.1 mg/g body
weight. Meiotic cells and sperm were obtained by crushing
the testis. The material was either directly fixed in methanol/
acetic acid (3:1) or incubated in 0.075 M KCl at 37°C as hypo-
tonic treatment and then fixed.
Fluorescence in situ hybridization of BAC clones
DNA (1 μg) from BAC clones was directly labeled with spec-
trum orange or spectrum green (Vysis, Abbot Molecular, Des
Plaines, IL, USA) using random primers and Klenow
polymerase. Hybridization by FISH to platypus or echidna
metaphase chromosomes and echidna meiotic chromosomes
was performed under standard conditions. Briefly, the slides
were treated with 100 μg/ml RNase A/2 × SSC 37°C for 30
minutes and with 0.01% pepsin in 10 mM HCl at 37°C for 10
minutes. After re-fixing for 10 minutes in 1 × PBS, 50 mM
MgCl
2
, 1% formaldehyde, the preparations were dehydrated
in an ethanol series. Slides were denatured for 2.5 minutes at
75°C in 70% formamide, 2 × SSC, pH 7.0 and again dehy-
drated. For hybridization of one half slide, 10 μl of probe DNA
was co-precipitated with 10-20 μg of boiled genomic platypus
or echidna DNA as competitor, and 50 μg salmon sperm DNA
as carrier, and dissolved in 50% formamide, 10% dextran
sulfate, 2 × SSC. The hybridization mixture was denatured for
10 minutes at 80°C. Pre-annealing of repetitive DNA
sequences was carried out for 30 minutes at 37°C. The slides
were hybridized overnight in a moist chamber at 37°C and,
thereafter, washed three times for 5 minutes in 50% forma-
mide, 2 × SSC at 42°C and once for 5 minutes in 0.1 × SSC.
Chromosomes and cell nuclei were counterstained with 1 μg/
ml DAPI in 2 × SSC for 1 minute and mounted in 90% glyc-
erol, 0.1 M Tris-HCl, pH 8.0 and 2.3% DABCO. Images were
taken with a Zeiss AxioImager Z.1 epifluorescence micro-
scope equipped with a CCD camera and Zeiss Axiovision
software.
Data availability
The sequence data from this study have been submitted to
GenBank under accession numbers EU030442-EU030444.
Abbreviations
BAC, bacterial artificial chromosome; EST, expressed
sequence tag; FISH, fluorescence in situ hybridization; HLA,
human leukocyte antigen; MHC, major histocompatibility
complex; Myr, million years; ML, maximum likelihood; MP,
maximum parsimony; NJ, neighbor joining; ORF, open read-
ing frame; PAR, pseudoautosomal region; SLA, swine leuko-
cyte antigen; UTR, untranslated region.
Authors' contributions
JCD carried out computational analyses, ETA performed
FISH hybridizations, RR, FG and HH supervised the work
carried out in their labs. HH conceived the study. JCD, FG
and HH wrote the manuscript.
Genome Biology 2007, Volume 8, Issue 8, Article R175 Dohm et al. R175.15
comment reviews reports refereed researchdeposited research interactions information
Genome Biology 2007, 8:R175
Additional data files
The following additional data are available with the online
version of this paper. Additional data file 1 is a figure showing
the characterization of echidna BAC clones on Southern blots.
Additional data file 2 is a figure showing a phylogenetic tree
of MHC class II genes shown in Figure 1. Additional data file
3 is a figure showing an MHC class I gene maximum likeli-
hood phylogenetic tree. Additional data file 4 is a figure show-
ing a MHC class I gene maximum parsimony phylogenetic
tree. Additional data file 5 is a figure showing a MHC class II
gene maximum likelihood phylogenetic tree. Additional data
file 6 is a figure showing a MHC class II gene maximum par-
simony phylogenetic tree. Additional data file 7 is a table list-
ing the evolutionary conservation of MHC non-class I, non-
class II proteins. Additional data file 8 is a table listing gene
models in PIPMaker format and ORF translation for platypus
BAC 462c1. Additional data file 9 is a table listing gene models
in PIPMaker format and ORF translation for platypus BAC
466a15. Additional data file 10 contains Additional data file
10 is a table listing accession numbers for MHC class II genes
used for phylogenetic analysis in Figure 3. Additional data file
11 is a table listing accession numbers for MHC class I genes
used for phylogenetic analysis in Figure 4.
Additional data file 1Characterization of echidna BAC clones on Southern blotsCharacterization of echidna BAC clones on Southern blots.Click here for fileAdditional data file 2Phylogenetic tree of MHC class II genes shown in Figure 1Phylogenetic tree of MHC class II genes shown in Figure 1.Click here for fileAdditional data file 3MHC class I gene maximum likelihood phylogenetic treeMHC class I gen? maximum likelihood phylogenetic tree.Click here for fileAdditional data file 4MHC class I gene maximum parsimony phylogenetic treeMHC class I gene maximum parsimony phylogenetic tree.Click here for fileAdditional data file 5MHC class II gene maximum likelihood phylogenetic treeMHC class II gene maximum likelihood phylogenetic tree.Click here for fileAdditional data file 6MHC class II gene maximum parsimony phylogenetic treeMHC class II gene maximum parsimony phylogenetic tree.Click here for fileAdditional data file 7Evolutionary conservation of MHC non-class I, non-class II proteinsEvolutionary conservation of MHC non-class I, non-class II proteins.Click here for fileAdditional data file 8Gene models in PIPMaker format and ORF translation for platypus BAC 462c1Gene models in PIPMaker format and ORF translation for platypus BAC 462c1.Click here for fileAdditional data file 9Gene models in PIPMaker format and ORF translation for platypus BAC 466a15Gene models in PIPMaker format and ORF translation for platypus BAC 466a15.Click here for fileAdditional data file 10Accession numbers for MHC class II genes used for phylogenetic analysis in Figure 3Accession numbers for MHC class II genes used for phylogenetic analysis in Figure 3.Click here for fileAdditional data file 11Accession numbers for MHC class I genes used for phylogenetic analysis in Figure 4Accession numbers for MHC class I genes used for phylogenetic analysis in Figure 4.Click here for file
Acknowledgements
We are grateful to Stefanie Palczewski and Marion Klein for their excellent
technical assistance. Lisa Königsmayr and Sebastian Dohm characterized
BAC clones during their summer internships in Berlin. We thank Kathy
Belov and Jennifer A Marshall Graves for inspiring discussions at the begin-
ning of the project. We are grateful to Russell Jones and Heath Ecroyd for
help with the sample collection. Facilities were provided by Macquarie Gen-
eration and Glenrock Station, NSW. Approval to collect animals was
granted by the New South Wales National Parks and Wildlife Services,
New South Wales Fisheries, Environment and the Animal Experimentation
and Ethics committee of the University of Adelaide. Cornelia Lange contrib-
uted text for the preparation of shotgun libraries. This work was supported
by the Max-Planck-Gesellschaft and the Australian Research Council (Dis-
covery Project and Fellowship schemes). Frank Grützner is an ARC
Research Fellow and Enkhjargal Tsend-Ayush is an ARC Postdoctoral
Research Fellow.
References
1. Horton R, Wilming L, Rand V, Lovering RC, Bruford EA, Khodiyar
VK, Lush MJ, Povey S, Talbot CC, Wright MW, et al.: Gene map of
the extended human MHC. Nat Rev Genet 2004, 5:889-899.
2. Kulski JK, Shiina T, Anzai T, Kohara S, Inoko H: Comparative
genomic analysis of the MHC: the evolution of class I dupli-
cation blocks, diversity and complexity from shark to man.
Immunol Rev 2002, 190:95-122.
3. Kelley J, Walter L, Trowsdale J: Comparative genomics of major
histocompatibility complexes. Immunogenetics 2005,
56:683-695.
4. Hurt P, Walter L, Sudbrak R, Klages S, Müller I, Shiina T, Inoko H,
Lehrach H, Günther E, Reinhardt R, et al.: The genomic sequence
and comparative analysis of the rat major histocompatibility
complex. Genome Res 2004, 14:631-639.
5. MHC sequencing consortium: Complete sequence and gene
map of a human major histocompatibility complex. Nature
1999, 401:921-923.
6. Kumanovics A, Takada T, Lindahl KF: Genomic organization of
the mammalian MHC. Annu Rev Immunol 2003, 21:629-657.
7. Renard C, Hart E, Sehra H, Beasley H, Coggill P, Howe K, Harrow J,
Gilbert J, Sims S, Rogers J, et al.: The genomic sequence and anal-
ysis of the swine major histocompatibility complex. Genomics
2006, 88:96-110.
8. Liu H, Liu K, Wang J, Ma RZ: A BAC clone-based physical map
of ovine major histocompatibility complex. Genomics 2006,
88:88-95.
9. Amadou C: Evolution of the Mhc class I region: the framework
hypothesis. Immunogenetics 1999, 49:362-367.
10. Belov K, Deakin JE, Papenfuss AT, Baker ML, Melman SD, Siddle HV,
Gouin N, Goode DL, Sargeant TJ, Robinson MD, et al.: Reconstruct-
ing an ancestral mammalian immune supercomplex from a
marsupial major histocompatibility complex. PLoS Biol 2006,
4:e46.
11. Ohta Y, Goetz W, Hossain MZ, Nonaka M, Flajnik MF: Ancestral
organization of the MHC revealed in the amphibian
Xenopus. J Immunol 2006, 176:3674-3685.
12. Kumar S, Hedges SB: A molecular timescale for vertebrate
evolution. Nature 1998, 392:917-920.
13. Kaufman J, Milne S, Gobel TW, Walker BA, Jacob JP, Auffray C,
Zoorob R, Beck S: The chicken B locus is a minimal essential
major histocompatibility complex. Nature 1999, 401:923-925.
14. Bininda-Emonds OR, Cardillo M, Jones KE, MacPhee RD, Beck RM,
Grenyer R, Price SA, Vos RA, Gittleman JL, Purvis A: The delayed
rise of present-day mammals. Nature 2007, 446:507-512.
15. Flannery TF, Groves CP: A revision of the genus Zaglossus
(Monotremata, Tachyglossidae) with description of new spe-
cies and subspecies. Mammalia 1998, 62:367-396.
16. Miska KB, Harrison GA, Hellman L, Miller RD: The major histo-
compatibility complex in monotremes: an analysis of the
evolution of Mhc class I genes across all three mammalian
subclasses. Immunogenetics 2002, 54:381-393.
17. Belov K, Lam MK, Hellman L, Colgan DJ: Evolution of the major
histocompatibility complex: Isolation of class II beta cDNAs
from two monotremes, the platypus and the short-beaked
echidna. Immunogenetics 2003, 55:402-411.
18. Platypus Genome Sequencing Proposal [http://
www.genome.gov/12512287]
19. Van Brink J: L'expression morphologique de la diagametie
chez les sauropsids et les monotremes. Chromosoma 1959,
10:1-72.
20. Grützner F, Graves JA: A platypus' eye view of the mammalian
genome. Curr Opin Genet Dev 2004, 14:642-649.
21. Grützner F, Rens W, Tsend-Ayush E, El-Mogharbel N, O'Brien PC,
Jones RC, Ferguson-Smith MA, Marshall Graves JA: In the platypus
a meiotic chain of ten sex chromosomes shares genes with
the bird Z and mammal X chromosomes. Nature 2004,
432:913-917.
22. Rens W, Grützner F, O'Brien PC, Fairclough H, Ferguson-Smith MA:
Resolution and evolution of the duck-billed platypus
karyotype with an X1Y1X2Y2X3Y3X4Y4X5Y5 male sex
chromosome constitution. Proc Natl Acad Sci USA 2004,
101:16257-16261.
23. Bick YAE: The meiotic chain of chromosomes of Monotrem-
ata. In Platypus and Echidnas Edited by: Augee ML. Sydney: Royal
Zoological Society of New South Wales; 1992:64-68.
24. Watson JM, Meyne J, Graves JAM: Studies of the chromosomes
of the echidna meiotic translocation chain. In Platypus and
Echidnas Edited by: Augee ML. Sydney: Royal Zoological Society of
New South Wales; 1992:53-63.
25. Burge C, Karlin S: Prediction of complete gene structures in
human genomic DNA. J Mol Biol 1997, 268:78-94.
26. Birney E, Durbin R: Using GeneWise in the Drosophila annota-
tion experiment. Genome Res 2000, 10:547-548.
27. Westerman M, Edwards D: DNA hybridization and the phylog-
eny of monotremes. In Platypus and Echidnas Edited by: Augee ML.
Sydney: Royal Zoological Society of New South Wales; 1992:28-34.
28. Kirsch JA, Mayer GC: The platypus is not a rodent: DNA
hybridization, amniote phylogeny and the palimpsest
theory. Philos Trans R Soc Lond B Biol Sci 1998, 353:1221-1237.
29. Belov K, Hellman L: Platypus IgM and the divergence of the two
extant monotreme lineages. Aust Mammalogy 2003, 25:87-94.
30. Springer MS, Murphy WJ, Eizirik E, O'Brien SJ: Placental mammal
diversification and the Cretaceous-Tertiary boundary. Proc
Natl Acad Sci USA 2003, 100:1056-1061.
31. Gibbs RA, Weinstock GM, Metzker ML, Muzny DM, Sodergren EJ,
Scherer S, Scott G, Steffen D, Worley KC, Burch PE, et al.: Genome
sequence of the Brown Norway rat yields insights into mam-
malian evolution. Nature 2004, 428:493-521.
32. Explore the Platypus Genome [ />Ornithorhynchus_anatinus/index.html]
33. Krueger C, Osborne CS: Raising the curtains on interchromo-
R175.16 Genome Biology 2007, Volume 8, Issue 8, Article R175 Dohm et al. />Genome Biology 2007, 8:R175
somal interactions. Trends Genet 2006, 22:637-639.
34. Smith TP, Rohrer GA, Alexander LJ, Troyer DL, Kirby-Dobbels KR,
Janzen MA, Cornwell DL, Louis CF, Schook LB, Beattie CW:
Directed integration of the physical and genetic linkage
maps of swine chromosome 7 reveals that the SLA spans the
centromere. Genome Res 1995, 5:259-271.
35. Deakin JE, Siddle HV, Cross JG, Belov K, Graves JA: Class I genes
have split from the MHC in the tammar wallaby. Cytogenet
Genome Res 2007, 116:205-211.
36. Blaschke RJ, Rappold G: The pseudoautosomal regions, SHOX
and disease. Curr Opin Genet Dev 2006, 16:233-239.
37. Jeffreys AJ, May CA: Intense and highly localized gene conver-
sion activity in human meiotic crossover hot spots. Nat Genet
2004, 36:151-156.
38. Matthey R: Les Chromosomes des Vertébrés Lausanne: F Rouge; 1949.
39. White MJD: Animal Cytology and Evolution 3rd edition. Cambridge:
Cambridge University Press; 1973.
40. McQueen HA, Fantes J, Cross SH, Clark VH, Archibald AL, Bird AP:
CpG islands of chicken are concentrated on
microchromosomes. Nat Genet 1996, 12:321-324.
41. Sambrook J, Russell DW: Molecular Cloning: A Laboratory Manual 3rd
edition. Cold Spring Harbor: Cold Spring Harbor Laboratory Press;
2001.
42. GAP4 Sequence Assembly and Contig Editing Program
[ />43. Monodelphis domestica Resources [ />opossum]
44. Thompson JD, Higgins DG, Gibson TJ: CLUSTAL W: improving
the sensitivity of progressive multiple sequence alignment
through sequence weighting, position-specific gap penalties
and weight matrix choice. Nucleic Acids Res 1994, 22:4673-4680.
45. Schmidt HA, Strimmer K, Vingron M, von Haeseler A: TREE-PUZ-
ZLE: maximum likelihood phylogenetic analysis using quar-
tets and parallel computing.
Bioinformatics 2002, 18:502-504.
46. Page RDM: TREEVIEW: An application to display phyloge-
netic trees on personal computers. Comput Appl Biosci 1996,
12:357-358.
47. Kumar S, Tamura K, Nei M: MEGA3: Integrated software for
Molecular Evolutionary Genetics Analysis and sequence
alignment. Brief Bioinform 2004, 5:150-163.