Báo cáo y học: "The DAVID Gene Functional Classification Tool: a novel biological module-centric algorithm to functionally analyze large gene lists" potx
Bạn đang xem bản rút gọn của tài liệu. Xem và tải ngay bản đầy đủ của tài liệu tại đây (819.25 KB, 16 trang )
Genome Biology 2007, 8:R183
Open Access
2007Huanget al.Volume 8, Issue 9, Article R183
Software
The DAVID Gene Functional Classification Tool: a novel biological
module-centric algorithm to functionally analyze large gene lists
Da Wei Huang
¤
*
, Brad T Sherman
¤
*
, Qina Tan
*
, Jack R Collins
†
, W
Gregory Alvord
‡
, Jean Roayaei
‡
, Robert Stephens
†
, Michael W Baseler
§
, H
Clifford Lane
¶
and Richard A Lempicki
*
Addresses:
*
Laboratory of Immunopathogenesis and Bioinformatics, Clinical Services Program, SAIC-Frederick, Inc., National Cancer Institute
at Frederick, Frederick, MD 21702, USA.
†
Advanced Biomedical Computing Center, SAIC-Frederick, Inc., National Cancer Institute at
Frederick, Frederick, MD 21702, USA.
‡
Computer and Statistical Services, Data Management Services, National Cancer Institute at Frederick,
Frederick, MD 21702, USA.
§
Clinical Services Program, SAIC-Frederick, Inc., National Cancer Institute at Frederick, Frederick, MD 21702,
USA.
¶
Laboratory of Immunoregulation, National Institute of Allergy and Infectious Diseases, National Institutes of Health, Bethesda, MD
20892, USA.
¤ These authors contributed equally to this work.
Correspondence: Richard A Lempicki. Email:
© 2007 Huang et al.; licensee BioMed Central Ltd.
This is an open access article distributed under the terms of the Creative Commons Attribution License ( which
permits unrestricted use, distribution, and reproduction in any medium, provided the original work is properly cited.
The DAVID gene functional classification tool<p>The DAVID gene functional classification tool uses a novel fuzzy clustering algorithm to condense a list of genes or associated biological terms into organized classes of related genes or biology, called biological modules.</p>
Abstract
The DAVID Gene Functional Classification Tool uses a novel
agglomeration algorithm to condense a list of genes or associated biological terms into organized
classes of related genes or biology, called biological modules. This organization is accomplished by
mining the complex biological co-occurrences found in multiple sources of functional annotation.
It is a powerful method to group functionally related genes and terms into a manageable number
of biological modules for efficient interpretation of gene lists in a network context.
Rationale
Biological interpretation of large gene lists derived from high-
throughput genomic or proteomic studies can be a challeng-
ing and daunting process. Some of the difficulties include:
acquiring large amounts of functional annotation for every
gene; the distributed nature of annotation across numerous
sources, that is, not centralized; summarizing which genes
are associated with specific biological processes and ranking
these processes by over-representation analysis; condensing
repetitive or redundant annotation data; identifying func-
tional biological modules consisting of related genes and
terms; and viewing inter-relationships between groups of
genes and groups of biological terms. A number of publicly
available bioinformatics tools have addressed the first three
points above, including, but not limited to, GoMiner, DAVID,
EASE, GOstat, Onto-express, GoToolBox, FatiGO, GOSSIP,
GFINDer, GOBar, and so on [1-25]. The power of many of
these applications is to systematically highlight the most
over-represented biological terms, out of a list of hundreds or
thousands of terms, to increase the likelihood of investigators
identifying biological processes most pertinent to the biolog-
ical phenomena under study [17]. While these tools are
extremely useful, they are still weak in mining the many-to-
many gene-to-term relationships found in functional annota-
tion databases, as well as in condensing redundant contents.
Published: 4 September 2007
Genome Biology 2007, 8:R183 (doi:10.1186/gb-2007-8-9-r183)
Received: 5 February 2007
Revised: 20 April 2007
Accepted: 4 September 2007
The electronic version of this article is the complete one and can be
found online at />R183.2 Genome Biology 2007, Volume 8, Issue 9, Article R183 Huang et al. />Genome Biology 2007, 8:R183
Individual genes can clearly be associated with multiple bio-
logical terms and, conversely, individual biological terms can
be associated with multiple genes. These associations form a
complex relationship network of 'many-genes-to-many-
terms' that represents the true complex nature of biological
processes. Data-mining tools that can extract these complex
and redundant relationships should be able to identify func-
tional gene-term biological modules. This identification can
be accomplished by using exploratory statistical methods that
identify groups of genes sharing similar biological terms or,
alternatively, identifying groups of biological terms sharing
similar genes. For example, if a subset of genes in a list is
sodium transporters, then one can expect that they will have
major functional annotations in common. A method that can
group these genes based on the strength of overlap of the
functional annotation should identify modules of related
genes and terms. Similarly, terms that have many genes in
common can also be grouped into a module of related terms
and genes; for example, the terms 'apoptosis', 'cell death',
'death', and 'regulation of cell death' will be grouped together
because these terms share a large number of common genes.
The advantages of this method of classifying groups of genes
and terms into biological modules are: it largely reduces
redundant results into a manageable size; it is much easier to
understand and visualize gene-to-gene, term-to-term, and
gene-to-term relationships, since related genes and terms are
brought together in one place; and it is much easier to relate
biological modules of interest to a study than it is to relate
hundreds of individual terms.
The goals of the project are to identify groups of genes sharing
common biology or, alternatively, to identify groups of bio-
logical terms sharing common genes relevant to an investiga-
tor's study. Most importantly, the heterogeneous
annotations/genes can be grouped as long as they are within
the same, relevant biological context. In this sense, the defini-
tion of functional group in this work is much broader than the
traditional concept. The improvement of biological discovery
is through better organization of massive and redundant
results into a more readable and manageable format (that is
biological groups). To this end, we developed the DAVID (The
Database for Annotation, Visualization and Integrated Dis-
covery [26]) Gene Functional Classification Tool and the
DAVID Functional Annotation Clustering Tool to provide a
module-centric approach for functional analysis of large gene
lists. First, we developed a new method to measure gene-gene
similarity, based on the assumption that genes that share glo-
bal functional annotation profiles are functionally related to
each other. Conversely, we measure term-term similarity
based on the assumption that terms that share global gene
profiles are functionally related to each other. Then, a DAVID
agglomeration method was developed to group related genes
or terms into functional groups (biological modules) based on
the similarity distances measure. The fuzziness feature of the
agglomeration method allows a gene or term to participate in
more than one functional group, better reflecting the true
'multiple-roles' nature of genes that can be lost if exclusive
methods, such as Hierarchical, K-means, or SOM clustering
are used. Functional groups are ranked based on all group
members' overall participation in the enriched biological
processes associated with the total gene list. A global view of
group-to-group relationships is also provided through a
unique fuzzy heat map visualization. A subset of 'drill-down'
functions associated with each biological module allows
investigators to explore and visualize relationships between
genes and terms. In this paper, we will mainly describe the
key algorithms associated with the DAVID Gene Functional
Classification Tool, illustrate the usefulness of several of the
functionalities, and demonstrate how quickly investigators
can apply the information in a biological module to their
study.
Implementation
The DAVID Gene Functional Classification Tool [27] and
DAVID Functional Annotation Clustering Tool [28] are two
new components integrated in DAVID Bioinformatics
Resources [26]. They were designed as a server-client appli-
cation on a UNIX server, with the Tomcat web server as the
serving engine. Java is the primary language used for calcula-
tions as well as the user interface, which utilizes Java Server
Page (JSP) technology. In-memory Java data objects contain-
ing all mappings between genes and annotation were devel-
oped to advance the calculation speed. The DAVID
Functional Annotation Clustering Tool uses the same algo-
rithm as the DAVID Gene Functional Classification Tool, but
conversely. Therefore, to illustrate the key scientific concepts,
we describe only the major procedures of the DAVID Gene
Functional Classification Tool. These procedures consist of
three major steps: measurement of functional relationship of
gene pairs, DAVID agglomeration method to partition genes
into functional gene groups, and visualization of results in
text and graphic modes (Figure 1).
Measuring functional relationship of gene pairs based
on the similarity of global annotation profiles
The traditional ways of grouping related genes are based on
either sequence similarity (sequence homologs), functional
categories (protein domain families), or co-expression clus-
ters (microarray clusters). In fact, the majority of co-func-
tioning genes are neither sequence-related nor in the same
protein families, such as genes in the same pathway. There-
fore, the traditional phylogenetic grouping methods are pow-
erful for evolution-based studies, but too specific and strict to
be of much use in classifying genes for the purpose of func-
tional annotation. We propose a novel method to identify
related genes by measuring the similarity of their global
annotation profiles based on the hypothesis that if two genes
have similar annotation profiles, they should be functionally
related. This method is able to identify much broader gene
groups in which genes share major common biological fea-
tures as well as tolerate some differences. For example, many
Genome Biology 2007, Volume 8, Issue 9, Article R183 Huang et al. R183.3
Genome Biology 2007, 8:R183
different types of genes, with or without too much sequence
similarity, could be grouped into a transcription regulation
class. We believe that the broader functional groups are more
useful for functional annotation purposes and, hence, biolog-
ical interpretation.
Firstly, a gene-term annotation matrix (Figure 2a) was com-
piled in a binary mode using thousands of annotation terms
in 14 annotation categories (including Gene Ontology (GO),
Biological Process, GO Molecular Function, GO Cellular
Component, KEGG Pathways, BioCarta Pathways, Swiss-Prot
Keywords, BBID Pathways, SMART Domains, NIH Genetic
Association DB, UniProt Sequence Features, COG/KOG
Ontology, NCBI OMIM, InterPro Domains, and PIR Super-
Family Names) collected in the DAVID knowledgebase [29]
(Additional data file 7). Then, kappa statistics, a chance-cor-
rected measure of co-occurrence between two sets of catego-
rized data, is adopted to statistically measure the annotation
co-occurrence of any given gene pairs [30,31]. Since the anno-
tation profile is in a binary categorical scale, kappa statistics
is more suitable than the Pearson correlation, which is typi-
cally used for continuous, non-categorical data.
For given annotation profiles of genes m and n, O
mn
repre-
sents the observed co-occurrence, A
mn
represents chance co-
occurrence, and K
mn
is the kappa value representing the
degree of annotation co-occurrence between genes m and n.
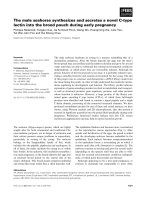
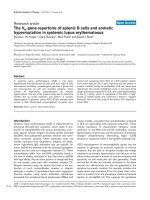
Flow chart of the procedures for the DAVID Gene Functional Classification Tool and the DAVID Functional Annotation Clustering ToolFigure 1
Flow chart of the procedures for the DAVID Gene Functional Classification Tool and the DAVID Functional Annotation Clustering Tool.
Collect and integrate annotation terms from
14 public annotation categories
Compile gene-term binary matrix
Measure functional relationships of all gene-gene
or term-term by Kappa Statistics
Build Kappa Statistics score matrix
Fuzzy heuristic multiple-linkage partition
Display results in either text or graphic mode
R183.4 Genome Biology 2007, Volume 8, Issue 9, Article R183 Huang et al. />Genome Biology 2007, 8:R183
where K
mn
is 1 for perfect co-occurrence and 0 for co-occur-
rence no better than random chance (Figure 2b).
While building the binary annotation matrix, the annotation
terms could be redundant or in a structured relationship
because many terms from different sources may have the
same biological meaning; in addition, GO terms fall into a
parent-child relationship in the GO hierarchical structure.
Some works demonstrate that gene-term enrichment analysis
is improved if the GO hierarchy is considered during the cal-
culation of the enrichment score [32,33]. However, due to the
non-hierarchical structure of a majority of annotation
sources, we proposed a new 'flat' matrix strategy to break all
redundant and structured terms into 'independent' terms in a
flat, linear collection (Figure 2a). We believe that an equally
weighted, linear, all-inclusive strategy can greatly simplify
the situation, as well as maximally leverage the heterogene-
ous annotations in the similarity measurement (see Addi-
tional data files 11 and 12 for more discussion). To answer the
question, 'Can this strategy specifically detect the real rela-
tionship of gene-gene?', we conducted three studies. The first
was to compare the kappa score distribution of every possible
pair of human genes (approximately 300 million pairs) to
that of reported human protein-protein interaction pairs
[34]. The protein-protein interaction pairs should have a bet-
ter chance to co-function in the same biological processes in
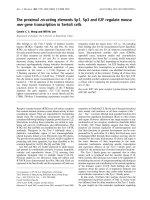
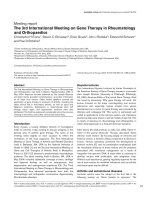
A hypothetical example of detecting gene-gene functional relationships by kappa statisticsFigure 2
A hypothetical example of detecting gene-gene functional relationships by kappa statistics. (a) The all-redundant and structured terms are broken into
'independent' terms in a flat linear collection. Each gene associates with some of the annotation term collection so that a gene-annotation matrix can be
built in a binary format, where 1 represents a positive match for the particular gene-term and 0 represents the unknown. Thus, each gene has a unique
profile of annotation terms represented by a combination of 1 s and 0 s. (b) For a particular example of genes a and b, a contingency table was constructed
for kappa statistics calculation. The higher kappa score (0.66) indicates that genes a and b are in considerable agreement, more so than by random chance.
By flipping the table 90 degrees, the kappa score of term-term can be achieved, based on the agreement of common genes (not shown). For more
information see Additional data files 11 and 12.
Gene a
Gene b
0
0
1
1
3 (C
1,1
)
2 (C
0,0
)
1 (C
0,1
)
0 (C
0,1
)
Row total
Column total 3 (C
*,1
) 3 (C
*,0
)
6 (T
ab
)
2 (C
0,*
)
4 (C
1,*
)
O
ab
=
C
1,1
+ C
0,0
T
ab
=
3 + 2
6
=0.83
0.83 – 0.5
K
ab
=
O
ab
–A
ab
1-A
ab
=
1 – 0.5
= 0.66
A
ab
=
=
= 0.5
C
*,1
•C
1,*
+ C
*,0
•C
0,*
T
ab
•T
ab
3• 4 + 3•2
6 • 6
Gene a
Gene b
0
0
1
1
3 (C
1,1
)
2 (C
0,0
)
1 (C
0,1
)
0 (C
0,1
)
Row total
Column total 3 (C
*,1
) 3 (C
*,0
)
6 (T
ab
)
2 (C
0,*
)
4 (C
1,*
)
O
ab
=
C
1,1
+ C
0,0
T
ab
=
3 + 2
6
=0.83
O
ab
=
C
1,1
+ C
0,0
T
ab
=
3 + 2
6
=0.83
0.83 – 0.5
K
ab
=
O
ab
–A
ab
1-A
ab
=
1 – 0.5
= 0.66
K
ab
=
O
ab
–A
ab
1-A
ab
=
1 – 0.5
= 0.66
A
ab
=
=
= 0.5
C
*,1
•C
1,*
+ C
*,0
•C
0,*
T
ab
•T
ab
3• 4 + 3•2
6 • 6
(b)(a)
101100Gene g
101100Gene f
111110Gene e
110011Gene d
111001Gene c
011011Gene b
010011Gene a
101100Gene g
101100Gene f
111110Gene e
110011Gene d
111001Gene c
011011Gene b
010011Gene a
Cell death
Apoptosis
Ph domain
Sh2 domain
Apoptosis
pathway
Membrane
K
OA
A
mn
mn mn
mn
=
−
−1
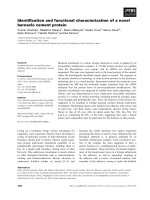
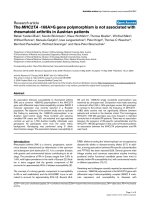
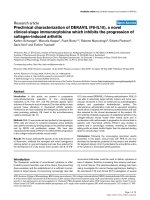
The gene-gene functional relationship can be specifically detected by kappa statisticsFigure 3 (see following page)
The gene-gene functional relationship can be specifically detected by kappa statistics. (a) Kappa scores were calculated for all possible combinations of
human gene-gene pairs (approximately 300 million). Only gene-gene pairs with a higher number of annotation terms in common possibly have good kappa
values. The box plot consists of the smallest and largest observations at the two end points (95% confidence interval), as well as a box from the 1st to 3rd
quartiles. The blue and red lines represent median and mean observations, respectively. (b) Kappa scores were calculated for all possible human gene-gene
pairs, gene-gene pairs with randomized annotation terms, all collected protein-protein interacting pairs, and all 'chemokine' gene pairs, respectively. The
distributions of those kappa scores from protein-protein interacting pairs (pink) and 'chemokine' gene pairs (light blue) significantly shift to the high value
end compared to human total (blue); conversely, the kappa score distribution (yellow) of gene pairs with randomized annotation terms remains in the
lower value end below 0.35. Interestingly, for the human genome (blue), over 50% of the kappa scores equal 0 (no detectable relationships) and >95% are
lower than 0.35. Altogether, this indicates that kappa statistics can specifically detect the gene-gene functional relationships.
Genome Biology 2007, Volume 8, Issue 9, Article R183 Huang et al. R183.5
Genome Biology 2007, 8:R183
Figure 3 (see legend on previous page)
0
0.1
0.2
0.3
0.4
0.5
0.6
0.7
0.8
0.9
1
0
5
10
15
20
25
30
35
40
45
50
55
60
65
70
75
80
85
>=90
Number of overlapped annotation terms for given gene
- gene pairs
Kappa scores
(a)
0%
10%
20%
30%
40%
50%
0.00
0.05
0.10
0.15
0.20
0.25
0.30
0.35
0.40
0.45
0.50
0.55
0.60
0.65
0.70
0.75
0.80
0.85
0.90
0.95
(b)
0%
1%
2%
3%
4%
5%
0.00
0.05
0.10
0.15
0.20
0.25
0.30
0.35
0.40
0.45
0.50
0.55
0.60
0.65
0.70
0.75
0.80
0.85
0.90
0.95
Kappa scores
Density
Human chemokines
Human protein - protein interactions
Human genome
Human randomization
R183.6 Genome Biology 2007, Volume 8, Issue 9, Article R183 Huang et al. />Genome Biology 2007, 8:R183
contrast to random protein-protein pairs. Therefore, a certain
degree of functional relatedness should be observed by the
method, but not always. If the similarity measurement can
specifically detect gene-gene relationships rather than ran-
dom noise, we would expect to see the score distribution of
the protein-protein interaction pairs to shift to the higher
value end (Figure 3b). The second study was to detect the
kappa score distribution of genes specifically selected
because their names contained the word 'chemokine'. Since
we selected genes with an extreme bias of similarity, we
expected the kappa scores to give much higher values (Figure
3). The third study was to compare the kappa score distribu-
tion of all human gene pairs to that of artificial gene pairs with
annotation profiles randomly generated, based on the true
human annotation frequency. It was expected that the simu-
lated kappa scores would be located only in the lower value
end (Figure 3). The three independent studies, combined
with the extensive test analysis on microarray datasets,
strongly supported the strategy that functional similarity
measurement is able to specifically detect gene-gene relation-
ships, particularly for the pairs with a kappa score 0.35 or
above, as suggested by our randomization study (Figure 3;
Additional data file 10). However, since the measurement
relies on known annotation profiles, this method, like any
other high-throughput functional analytical tools, will obvi-
ously not work for the genes that lack annotation.
A novel agglomeration method to classify a gene list
into functionally related groups based on the functional
similarity scores
After the kappa score matrix of all possible pair-wide genes is
calculated, it is possible to classify the highly related genes.
We examined the typical clustering methods, including hier-
archical tree, K-means, hierarchical, FANNY, and SOM. All of
them produced weaker clustering results (Additional data file
5) with our test datasets. The poor clustering results stem
from one or more of the following weaknesses associated with
the aforementioned clustering algorithms. First,: genes must
be assigned to one cluster, even though their absolute rela-
tionship is weak to all clusters. This results in higher contam-
ination of clusters with noise by forcing membership of
weakly related genes. Second, genes can belong to only one
cluster, which does not align well with the basic biological
nature of genes, in that one gene could participate in multiple,
different roles. Third, outliers and uneven cluster sizes can
greatly affect clustering quality. Fourth, it is difficult to know
the optimal K (number of clusters) for K-means, FANNY, or
SOM.
This situation motivated us to develop another agglomeration
approach, heuristic fuzzy multiple-linkage partitioning, to
better reflect the structure of functional annotation data. It
can be described as three major steps (Figure 4; see Addi-
tional data file 13 for a step-by-step example). Step 1, multiple
initial seeds: each gene is selected to serve as a medoid, or
center of an initial cluster, as long as it meets minimum relat-
edness (user input parameters, such as genes, are related to
more than three other genes with kappa > 0.35) to other
genes in the list. Step 2, merge seeds by a minimum, multiple
linkage (that is, merge two seeds when they share 50% of their
group members). Step 3, repeat step 2 until no more merging
can occur.
This method works better than others for this particular type
of analysis (Additional data file 5). This method: eliminates
overall irrelevant/weak elements, as orphan genes, to signifi-
cantly push the signal out of noise; allows for fuzziness by
allowing genes to be assigned to more than one cluster which
aligns with the biological nature; dynamically determines the
number of clusters based on the chosen threshold; generates
grand groups for easy interpretation; and tolerates outliers
extremely well by excluding them in step 1.
There is no gold standard or null hypothesis to evaluate clus-
tering methods and hence no right or wrong answers for any
given clustering algorithms. One method may work better
than others in the sense that it is more sensitive to the natural
structure of a particular problem. However, this method, like
any other heuristic approach, has the common weakness that
an improper running criteria setting can lead to distorted
results. In order to aid less advanced users with the setting of
these criteria, we preset five general levels representing com-
binations of the detailed settings from very low to very high
stringencies; based on our extensive tests on multiple data-
sets, the default stringency level (medium) should be optimal
for most cases.
Since there is not a null hypothesis test to compare the quality
between clustering algorithms, we try to summarize the
quality of our agglomeration algorithm based on randomly
selected genes that all clearly belong to one protein family (for
example, kinase, phosphatase, chemokine, and so on). Then,
the genes were classified by the method. Since we have pre-
knowledge about the gene family information, the gene(s)
that are grouped incorrectly or excluded from the correct
group(s) can be roughly estimated. We observed that the
leaking rate (that is, a gene not placed into a group to which it
does belong) is between 1% and 2%, and the noise rate (that
is, a gene incorrectly placed into a group to which it does not
belong) is between 1% and 5%. Most importantly, the method
is able to identify key members of groups so that the major
biology of each group can quickly be determined. Since the
analytical approach is biological module-centric, the major
biology associated with each gene group is determined by the
majority of gene members rather than by individual genes.
Thus, the biology of each group should be very stable, even
though there is a chance that a few members are excluded or
incorrectly included. In summary, this clustering method
shows reasonable performance by eliminating irrelevant,
'noisy' genes and by bringing together strongly related func-
tional groups, while maintaining the fuzzy nature of biology
by which genes may be involved in multiple processes.
Genome Biology 2007, Volume 8, Issue 9, Article R183 Huang et al. R183.7
Genome Biology 2007, 8:R183
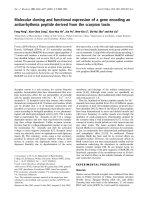
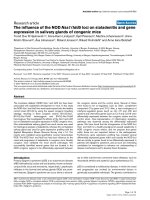
Graphical illustration of the heuristic fuzzy partition algorithmFigure 4
Graphical illustration of the heuristic fuzzy partition algorithm. (a) Hypothetically, each element (gene) can be positioned in a virtual two-dimensional
space, based on its characteristics (annotation terms). The distance represents the degree of relationship (kappa score) among the genes. (b) Any gene has
a chance as a medoid to form an initial seeding group. Only the initial groups with enough closely related members (for example, members >3 and kappa
score ≥0.4) are qualified (solid-line circle). Conversely, unqualified ones are shown as dashed-line circles. (c) Every qualified initial seeding group is
iteratively merged with each other to form a larger group based on the multi-linkage rule, that is, sharing 50% or more of memberships, until all secondary
clusters (thicker oval) are stable. Importantly, the genes not covered by any qualified initial seeding group are considered as outliers (in gray). (d) Finally,
three final groups (thicker ovals) are formed because they can no longer be merged with any other group. One gene (in red) belonging to two groups
represents the fuzziness capability of the algorithm. And outliers (in gray in (c)) are removed for clearer presentation. A step-by-step example can be
found in Additional data file 13.
(a)
(c)
Initializing multiple seeds
(d)
Final groups after iterative merging
(b)
Groups in the middle of iterative
merging
The distance represents the
relationships between elements
R183.8 Genome Biology 2007, Volume 8, Issue 9, Article R183 Huang et al. />Genome Biology 2007, 8:R183
The last question is, 'Which final functional gene groups are
more significant for the experiment?' We extended the tradi-
tional enrichment analysis logic so that a gene group is more
important if a majority of its gene members is associated with
highly enriched annotation terms as found in the traditional
enrichment analysis of the total gene list. Thus, the enrich-
ment score of each group is measured by the geometric mean
of the EASE Scores (modified Fisher Exact) [2] associated
with the enriched annotation terms that belong to this gene
group. Importantly, the multiple testing correction issues are
considered in the individual EASE scores [2]. And all EASE
scores (significant or insignificant) associated with the group
participate in the algorithm. In order to emphasize that the
geometric mean is a relative score instead of an absolute p
value, minus log transformation is applied on the geometric
mean (Additional data file 6). Therefore, the group enrich-
ment scores are intended to order the relative importance of
the gene groups instead of as absolute decision values. A
higher score for a group indicates that the group members are
involved in more important (enriched) roles. However, all
gene groups are potentially interesting despite lower
rankings.
Visualization of results in a very simple text format and
a novel fuzzy heat map view
We implemented both a very simple text format (Figure 5)
and a comprehensive novel fuzzy heat map graphic view
(Additional data file 4) to present the functional groups
derived from the above procedure. The text format simply
lists all functional gene groups identified by the algorithm.
Although it looks like a linear format, the view allows the user
to visualize the multidimensional data of the groups, that is,
group members consisting of multiple related genes and
terms. Users are able to easily explore the major functional
groups by viewing many related genes and annotation terms
brought together by the tool. Some accessory, 'drill-down'
functionalities (for example, Enriched Terms Report, 2-D
View, and so on; Figure 5) are available for each functional
group for users to rapidly explore the associated biology in
detail. For example, the 'Enriched Term Report' button lists
the major annotation terms associated within the functional
groups based on the DAVID enrichment engine; the '2-D
View' button gives the detailed relationship of genes-to-terms
in a two-dimensional heat map view so that the user is able to
examine the rich relationship of related genes and annota-
tions in-depth (Figure 6); the 'Related Genes' button allows
users to refine the group gene members in different scopes,
which can extend the membership of interest and also correct
potential type I and II errors in the clustering algorithm
(Additional data file 9C). Furthermore, the text format pro-
vides links to the list of orphan genes not classified into any
functional groups. These genes are orphaned because they do
not meet one or more of the partitioning criteria (that is,
group membership thresholds, and so on) The list is provided
since they may be important genes for the user to examine.
Results and discussion
We examined the newly developed biological module-centric
tools (see Additional data file 8 for a graphical tutorial of
using the tools) on two published microarray datasets. It is
important to mention that, to avoid potential bias, the
datasets of the case studies are different from those used dur-
ing algorithm development. For the first microarray dataset
[35], G1 response genes were identified by microarray exper-
iments after introducing G1 cyclin Cln3p to cln
-
yeast cells
that were previously arrested with cdc34-2. For comparison,
the dataset was analyzed by tools with very different algo-
rithms, that is, DAVID Tools [26], GoMiner [16], Ontologizer
[33], GOStat [3], ermineJ [36], ADGO [37] and GENECODIS
[38]. All tools are able to highlight the major terms (for exam-
ple, cell cycle, DNA repair, DNA replication, budding, and so
on), consistent with previously published observations. How-
ever, the DAVID methods are more sensitive to a couple of
additional important terms (for example, cyclin-dependant
kinase activity, mating, and so on) that were not found among
the top terms in the output from the other tools. For more
detailed results, comparisons and discussion, see Additional
data file 14.
The following detailed discussion is mainly focused on the
second microarray dataset [39], of which the gene list is
available as demo list 2 on our tool entry page. In this example
dataset, authors treated freshly isolated peripheral blood
mononuclear cells (PBMCs) with an HIV envelope protein
(gp120) and further measured genome-wide gene expression
changes using Affymetrix U95A chips [40]. This study pro-
vides a global view of the complex interaction between viral
and cellular factors, which is an essential mechanism for HIV
replication in resting or suboptimally activated PBMCs. A
functionally significant annotation of approximately 400
genes (Additional data file 1) derived from the microarray
experiment was classified by the authors into five major func-
tional categories: cytokines, chemokines, transcription
factors, kinases, and membrane fusion [39]. While the
cytokine and chemokine categories were systematically
highlighted by EASE (a GO enrichment analysis based on the
Fisher Exact Test) [2], other annotation categories reported
in the publication were discovered through semi-manual
analysis by bioinformatics experts with an advanced level of
knowledge of both biology and computer tools.
The same data re-analyzed by typical functional
annotation tools
After the continuous addition of annotations for genes as well
as the refinement of gene-term enrichment algorithms during
the years since the above study [39] was published, it is
interesting to see how the systematic results from current
functional annotation tools compare to those reported in this
publication. Some of the popular functional annotation tools,
such as DAVID Gene Functional Annotation Tool, GOStat,
GoMiner, TopGO, Ontologizer, ADGO and GENECODIS
[1,3,16,32,33,37,38], were chosen to identify major biological
Genome Biology 2007, Volume 8, Issue 9, Article R183 Huang et al. R183.9
Genome Biology 2007, 8:R183
terms with the same gene list. In order to maximally reflect
the design spirit of each tool and also make the results more
comparable, we kept all default parameters of the tools
unchanged, except for synchronizing the data coverage scope
within all GO levels (DAVID covers multiple data sources and
GOstat covers GO level 3 or above by default). Although all of
the testing tools are based on similar gene-term enrichment
algorithms, the sensitivity and specificity could be different
due to different updates of GO data content, different back-
ground gene lists, different score systems, different gene ID
mapping schemes, and so on. After obtaining hundreds of
annotation terms reported by each of the above tools, the
terms, particularly at the top of the results, were compared
with each other (Table 1). Approximately 30% of the top
terms overlapped between at least two of the tools, for exam-
ple, cytokine/chemokine activity, inflammatory response,
and so on. Some reported terms, for example, kinase, are not
ranked at the top by any of the tools (that is GOMiner, 49;
DAVID, 24; GOStat, 82; topGO, 76; Ontologizer, 111).
Even though the results from the tools all point in the same
biological direction, there are four obvious problems. First,
redundant/similar/hierarchical terms appear in different
(significance) positions within the reports (for example,
response to stress, response to wounding, response to patho-
genic bacteria, response to other organisms, response to
external biotic stimulus, inflammatory response, and so on),
which makes it difficult for the user to gain or maintain a clear
focus of the whole biological picture. It is not easy for users to
comprehensively pool all genes related to the same key biol-
ogy without manually summarizing all related redundant
terms. Second, the redundant/similar/hierarchical terms
could largely dilute the focus on other key biology that has few
or no redundancies (for example, only one term is for estab-
lishment of cellular localization). If several redundant/simi-
lar/hierarchical terms are represented in the top of the list,
less redundant terms may be pushed down the list, possibly
decreasing the chance of discovery; for example, a transcrip-
tion regulation term, reported in an original publication, was
A text format report from the Gene Functional Classification ToolFigure 5
A text format report from the Gene Functional Classification Tool. The example shows the output of 16 genes (Additional data file 1) analyzed by the tool
with default settings. Without prior knowledge, the tool is able to classify genes into three functional gene groups. On each group header, a set of buttons
is provided for in-depth exploration of the annotation for the group. 'T' reports the major enriched annotation terms associated with the group. The 'Heat
Map' symbol provides a detailed graphical view of gene-term relationships. 'RG' searches other related genes in the genome but not in the list.
R183.10 Genome Biology 2007, Volume 8, Issue 9, Article R183 Huang et al. />Genome Biology 2007, 8:R183
Figure 6 (see legend on next page)
Genome Biology 2007, Volume 8, Issue 9, Article R183 Huang et al. R183.11
Genome Biology 2007, 8:R183
not listed in the top 20 by any of the tools. Third, in contrast,
due to differences of the annotation levels of different
sources, redundant/similar/hierarchical terms may them-
selves be diluted. While alone a single term may not be at the
top of the list, in combination with redundant/similar/hierar-
chical terms, the biological function may be very significant.
Fourth, current tools do not emphasize the inter-relation-
ships between key biological terms (for example, relation-
ships between chemokine/cytokine and signal transduction).
In conclusion, the recent improvement of functional annota-
tion tools provides a powerful means for users to systemati-
cally identify key biological functions associated with a gene
list. However, due to the weaknesses discussed above, refine-
ment of current gene-term enrichment algorithms and
improvement of software usability alone may not address all
the issues. Therefore, the development of novel alternative
algorithms as a complement is still very necessary.
The same data analyzed by the DAVID Gene
Functional Classification Tool
The same gene list (Additional data file 1) was submitted to
our newly developed DAVID Gene Functional Classification
Tool described previously (Additional data file 8). The tool is
able to efficiently handle up to 3,000 genes at a time, within a
few seconds. The tool classified the approximately 400 genes
into 16 functional groups (Table 2 and Additional data file 2).
The result is much more focused, simplified, and in a manage-
able size for investigators' interpretation compared to work-
ing with a few hundred terms, of which many are redundant
in results derived using the traditional tools discussed in the
previous section. More importantly, all five reported annota-
tion categories are covered by the 16 functional groups (Table
2). In addition, the tool also lists another 11 interesting gene
groups not reported in the original publication. For example,
group 13 (tubulin genes) plays a critical role in the nucleation
of microtubule assembly. Some studies suggest that HIV
infection leads to enteric microtubule depolymerization of
infected cells, resulting in increases in HIV permeability [41].
This tool focuses on the overall major common annotation
terms associated with a gene group rather than one term or
one gene at a time, thereby producing clearer, more concise
results that can better allow for focus on the major biology of
an experiment. The tool simplifies the results by condensing
the redundant terms and summarizing inter-relationships.
This analytical logic and presentation format closely mimics
how the human brain works and the results better represent
the nature of biology.
The DAVID Gene Functional Classification Tool allows users
to further explore a given biological module/gene group in
depth. For example, the 'enriched terms' button '2-D View' is
able to list all related terms and genes for the kinase group.
Thus, a user who is not familiar with kinases can explore the
terms of kinase activity, transferase activity, ATP-binding,
nucleotide binding, protein metabolism, tyrosine specificity,
serine/threonine specificity, regulation of G protein signal-
ing, and signal transduction, and so on in one view at the
same time (Figure 6). Therefore, we can quickly learn the
biology for the kinase group with the above related terms in a
single view and also identify the fine differences among them.
For example, there are two G-protein coupling receptor
kinases, three protein tyrosine kinases and six kinases
involved in cell surface receptor-linked signal transduction
among the 23 kinases within the group (Figure 6). The fine
details may be very important for pinpointing the key biology
associated with a study.
Furthermore, the DAVID Gene Functional Classification Tool
allows one gene to be present in more than one functional
group, which closely reflects the nature of biology whereby
one gene could play multiple roles in different processes. This
fuzziness feature improves the chances of discovery by maxi-
mally preserving all of the true relationships. For example,
general transcription factor II H (GTF2H4/TFIIH,
41371_at) was assigned to group 2 (transcription regulation
group) and group 5 (DNA damage/repair group) (Additional
data file 2). Some studies suggest TFIIH increases polymer-
ase processivity in HIV infection [42]. Currently, there are
few reports about the TFIIH DNA repair mechanism being
involved in HIV infection, although this DNA repair
mechanism could be essential in HIV integration. Hence, the
fuzzy capability allows users not only to focus on the TFIIH
transcription regulation role but also to consider the possible
role in HIV integration through the DNA repair mechanism.
For another example, ring finger protein 40 (RNF40) is in
group 2 (transcription regulation group) and group 10 (chro-
mosome assembly) (Additional data file 2). Although the bio-
logical significance of the ring finger protein in HIV infection
is still largely unclear, the annotation result points out two
potential areas for further exploration: first, the ring finger
protein regulates the tumor necrosis factor-related transcrip-
tional pathway, which is critical to many aspects of HIV tran-
scription; and second, it plays some role in DNA packaging
and chromosome integration. Thus, the fuzziness capability is
a powerful feature to maximally preserve biological patterns
and to discover fine differences for a given gene compared to
exclusive methods.
An example of genes-to-terms 2-D viewFigure 6 (see previous page)
An example of genes-to-terms 2-D view. All the related 23 kinase genes and their associated annotation terms from gene group 3 (kinase group) for demo
list 2 are displayed in a 2-D heat map-like interactive graphical view. Green represents the positive association between the gene-term; conversely, black
represent an unknown relationship. The annotation terms are ordered based on their enrichment scores associated with the group. The kinase commonly
related annotations (big green block) are shown on the left side, and the scattered pattern (green and black) on the right side shows the functional
difference.
R183.12 Genome Biology 2007, Volume 8, Issue 9, Article R183 Huang et al. />Genome Biology 2007, 8:R183
Table 1
The top 20 enriched terms for demo list 2 by various traditional functional annotation tools
No. GOMiner DAVID Chart GOstat Ontologizer topGO elim ADGO
1 Inflammatory
response
Response to
pathogenic bacteria
Cell-cell signaling Response to stimulus Induction of positive
chemotaxis
Inflammatory
response/
extracellular region
2 Clathrin coat of
coated pit
Chemokine activity Response to pest,
pathogen or parasite
DNA repair Positive regulation of
vascular endothelium
Inflammatory
response
3 Viral genome
replication
Cell migration Response to stress Cell surface receptor
linked signal
transduction
Chemokine activity Cell-cell signaling/
extracellular space
4 Morphogenesis Clathrin-coated
vesicle
Response to external
biotic stimulus
Positive regulation of
protein metabolic
process
Angiogenesis Soluble fraction/
chemokine activity
5 Cytokine activity Clathrin vesicle coat Response to
wounding
Cytoskeleton
organization and
biogenesis
Vascular endothelial
growth factor
receptor
Extracellular space
6 Establishment of
spindle localization
Clathrin coated
vesicle membrane
Negative regulation
of biological process
Molecular_function Extracellular matrix
binding
Sensory perception/
chemokine activity
7 Cell communication Receptor binding Negative regulation
of physiological
process
Cell communication Viral genome
replication
Inflammatory
response/chemokine
activity
8 Establishment of
mitotic spindle
localization
Response to other
organism
Cytoplasmic vesicle
membrane
DNA binding Extracellular space Sensory perception/
extracellular space
9 Regulation of cellular
process
Kinase activity Cytoplasmic vesicle
membrane
Protein binding Cell-cell signaling Chemokine activity
10 Regulation of
biological process
RNA polymerase II
transcription factor
activity
Negative regulation
of cellular process
Cell cortex Inflammatory
response
Chemotaxis/
extracellular space
11 Development Clathrin coat Regulation of
biological process
Mitochondrial part Vasculogenesis G-protein coupled
receptor protein
signaling pathway/
extracellular space
12 Signal transduction Establishment of
cellular localization
Cell proliferation GTPase activity Chemotaxis Inflammatory
response/
extracellular space
13 Viral infectious cycle Cell differentiation Phagocytic vesicle Chemotaxis Neutrophil activation Extracellular space/
chemokine activity
14 Positive regulation of
protein metabolism
Cell death Calpain inhibitor
activity
Anatomical structure
formation
Ammonia ligase
activity
G-protein coupled
receptor protein
signaling pathway/
chemokine activity
15 Regulation of
protein-nucleus
import
Regulation of isotype
switching
Cell adhesion Lyase activity Endothelin-
converting enzyme 1
activity
Chemotaxis/soluble
fraction
16 Immune cell
migration
Membrane-bound
vesicle
Negative regulation
of cellular
physiological process
Interleukin-12
production
U-plasminogen
activator receptor
activity
Cell-cell signaling/
chemokine activity
17 Organ development Cell cycle Vesicle membrane Nitrogen compound
biosynthetic process
Cell adhesion Cell proliferation/
extracellular space
18 Organogenesis Membrane fraction Inflammatory
response
DNA recombination Fructose metabolism Extracellular region/
chemokine activity
Genome Biology 2007, Volume 8, Issue 9, Article R183 Huang et al. R183.13
Genome Biology 2007, 8:R183
The sensitivity of the Functional Classification Tool can vary
with different datasets and stringency criteria. If the running
criteria are not suitable to a particular dataset, the output can
be distorted. In such cases, some exploration of different run-
ning stringencies is necessary in order to obtain the optimal
results to meet the expectation of the study.
The same data analyzed by the Functional Annotation
Clustering Tool
Due to the redundancy/hierarchy problems in the results
obtained from traditional annotation tools (Table 1), a Func-
tional Annotation Clustering Tool was also developed to
organize the highly redundant annotation term results into a
simplified and clustered format. This new format allows
investigators to focus on an annotation group level by quickly
skipping many redundant/similar/hierarchical terms within
the group. Compared to 222 individual terms reported by the
DAVID Functional Annotation Tool, a traditional term-cen-
tric enrichment method, the new tool was able to organize
them into 65 annotation clusters (Additional data file 3). For
example, the annotation cluster 3 (immune-response group)
consists of 11 redundant/similar/hierarchical terms; that is,
response to stress, inflammatory response, response to exter-
nal stimulus, response to pest, pathogen or parasite, and so
on. These similar terms are spread throughout the traditional
term-centric enrichment report list of 222 terms. Most
19 Chemotaxis Angiogenesis Cell communication Cytokine
biosynthetic process
Response to
pathogenic bacteria
G-protein coupled
receptor protein
signaling pathway/
soluble fraction
20 Taxis Cell communication Cell differentiation Immune system
process
Hyaluronic acid
binding
Sensory perception/
extracellular region
Total 380 terms
(p < 0.05)
Total 157 terms
(p < 0.05)
Total 119 terms
(p < 0.05)
Total 31 terms
(p < 0.05)
Total 160 terms
(p < 0.05)
Total 67 terms
(p < 0.05)
The example gene list was analyzed by GoMiner, DAVID, GOStat, Ontologizer, topGO, and ADGO. The annotation data coverage was set to GO
terms of all levels, and all other parameters used were each tool's default settings. Only the top 20 terms from each tool are shown (see Additional
data file 15 for all results). Many of the terms are redundant or found within the same hierarchy. We emphasize the top 20 terms for three reasons:
first, the top ranked terms represent the overall quality of the tools in terms of sensitivity and specificity; second, it renders the amount of analytical
effects equivalent and comparable throughout the comparisons, including the clustered results; and third, analysts usually spend more time and
attention on the top ranked terms due to time and focus constraints.
Table 2
Sixteen total gene functional groups identified by the Functional Classification Tool
Gene functional group no. Associated biology Group enrichment score
1 Chemokine/cytokine 3.37
2 Transcription regulation 2.89
3 Signal transduction/membrane receptors 2.68
4 Kinase activity 2.54
5 DNA damage/repair 2.23
6 Iron binding 2.05
7 RNA processing/splicing factors 1.81
8 Organic acid transport 1.71
9 Cation/ion transport 1.69
10 DNA metabolism/chromosome organization 1.53
11 Cellular macromolecule catabolism 1.41
12 Metalloprotease 1.34
13 Macrotubule 1.24
14 Protein localization/fusion 1.17
15 Amine metabolism 1.1
16 RAS small GTPase 1.03
The genes of demo list 2 were analyzed by the Functional Classification Tool. The major biology terms associated with each group are manually
summarized based on gene-term enrichment buttons provided for each functional group.
Table 1 (Continued)
The top 20 enriched terms for demo list 2 by various traditional functional annotation tools
R183.14 Genome Biology 2007, Volume 8, Issue 9, Article R183 Huang et al. />Genome Biology 2007, 8:R183
importantly, the top 20 annotation clusters with a group
enrichment score less than or equal to 0.05 (Table 3 and
Additional data file 3) contain all annotation categories
reported by the original publication, as well as interesting
groups not identified. The highly organized and simplified
annotation results allow users to quickly focus on the major
biology at an annotation cluster level instead of trying to come
to the same conclusions by putting together pieces that are
scattered throughout a list of hundreds of terms. In addition,
the annotation cluster is helpful in comprehensively pooling
all related genes associated with an annotation cluster con-
sisting of many related terms. For example, each of the 11
terms within cluster 3 (immune-response cluster) associates
with different genes. A pooled gene list brought together by
cluster 3 regarding immune-response could be much more
comprehensive, compared to the genes selected from one or a
few individual terms. Moreover, the tool could possibly bring
up the terms not passing the minimum enrichment threshold
but highly related to other terms with significant enrichment
scores. In conclusion, the clustered result condenses the data
into smaller, much more organized biological term modules,
which allows investigators to quickly and comprehensively
focus on the key biology of interest.
Conclusion
The DAVID Gene Functional Classification Tool [26] is able
to organize and condense large gene lists into biologically
meaningful modules. It changes functional annotation analy-
sis from term- or gene-centric to biological module-centric.
This method takes into account the redundant and network
nature of biological annotation contents in order to concen-
trate on the larger biological picture rather than an individual
terms or genes. The DAVID Gene Functional Classification
Tool is complementary to other functional annotation tools.
Abbreviations
GO, Gene Ontology; PBMC, peripheral blood mononuclear
cell.
Authors' contributions
DWH oversaw the development of the tool and wrote the
manuscript; BTS developed most of the JAVA codes; QT, JC
and RS supported some development of functions; GA and JR
provided statistical supports; HCL, MWB and RAL supported
and supervised the project as principle investigators.
Table 3
The top 20 annotation clusters identified by the DAVID Functional Annotation Clustering Tool
Annotation cluster Representative annotation terms Enrichment score
1 Negative regulation of biological process 5.38
2 Signal transduction 4.36
3 Inflammatory response 3.75
4 Extracellular region 3.69
5 Cytokine/chemokine activity 3.12
6 Viral genome replication 2.23
7 Cell death/apoptosis 2.19
8 Regulation of biological process 2.18
9 Organ morphogenesis 2.06
10 Regulation of cell cycle 2.01
11 Positive regulation of biological process 1.87
12 Biological process unknown 1.76
13 Physiological interaction between organisms 1.69
14 Antimicrobial humoral response 1.52
15 Transcription cofactor activity 1.46
16 Integral to plasma membrane 1.44
17 Coated vesicle membrane 1.42
18 DNA repair/DNA metabolism 1.38
19 Kinase activity 1.3
20 Myoblast differentiation 1.3
The genes of demo list 2 were analyzed by the Functional Annotation Clustering Tool. The top 20 annotation clusters out of 65 total clusters have
group enrichment scores less than or equal to 0.05 (equivalent to 1.3 in minus log scale). The clusters are ordered by group enrichment score. The
representative biology terms associated with the top 20 annotation clusters are manually selected, showing a much clearer and non-redundant view
of the annotation terms associated with the study.
Genome Biology 2007, Volume 8, Issue 9, Article R183 Huang et al. R183.15
Genome Biology 2007, 8:R183
Additional data files
The following additional data are available with the online
version of this paper. Additional data file 1 lists the genes used
in the paper. Additional data file 2 provides the complete out-
put in text format for demo list 2 analyzed by the DAVID Gene
Functional Classification Tool. Additional data file 3 provides
the complete output in text format for demo list 2 analyzed by
the DAVID Functional Annotation Clustering Tool.
Additional data file 4 is a figure showing the fuzzy heat map
visualization of biological modules. Additional data file 5 is a
comparison of the novel fuzzy heuristic partitioning method
with other clustering methods. Additional data file 6 is an
example of the group enrichment score calculation used for
the Functional Annotation Clustering Tool. Additional data
file 7 describes the fourteen annotation categories used in the
DAVID Functional Classification Tool. Additional data file 8
provides graphical instruction and a tutorial on how to use
the DAVID Functional Classification Tool and the DAVID
Functional Annotation Clustering Tool. Additional data file 9
gives the output examples for the related gene search and
related term search. Additional data file 10 is the default set-
ting for minimum overlapped annotation in kappa score cal-
culation. Additional data file 11 describes the effect of Kappa
statistics on biased annotation data. Additional data file 12
provides a hypothetical example to measure the relationships
of gene-gene pairs by kappa statistics with annotations
organized in a 'flat' matrix. Additional data file 13 provides a
hypothetical example to demonstrate the general procedure
of our agglomeration procedure. Additional data file 14
includes detailed results, comparisons of the new DAVID
clustering tools with regards to yeast cell cycle G1 genes [21].
Additional data file 15 gives the annotation results of demo
list 2 by GOMiner, GOStat, DAVID chart, topGO, ermineJ
ORA, Ontologizer (three methods), ADGO and GENECODIS.
Additional data file 1Genes used in the paperGenes used in the paper: 409 Affymetrix IDs of demo list 2; 84 chemokine genes; approximately 17,000 pairs of protein-protein interactions; and 16 Affy IDs.Click here for fileAdditional data file 2Complete output in text format for demo list 2 analyzed by the DAVID Gene Functional Classification ToolComplete output in text format for demo list 2 analyzed by the DAVID Gene Functional Classification Tool.Click here for fileAdditional data file 3Complete output in text format for demo list 2 analyzed by the DAVID Functional Annotation Clustering ToolComplete output in text format for demo list 2 analyzed by the DAVID Functional Annotation Clustering Tool.Click here for fileAdditional data file 4Fuzzy heat map visualization of biological modulesThe genes in demo list 2 were analyzed by DAVID Gene Functional Classification Tool. The identified biological groups/modules were displayed by the fuzzy heat map.Click here for fileAdditional data file 5The novel fuzzy heuristic partitioning method compared with other clustering methodsThe binary gene-term matrix (like Figure 2a) was compiled and submitted to different clustering engines, including Hierarchical clustering, and K-means. The results were evaluated and compared side-by-side.Click here for fileAdditional data file 6An example of the group enrichment score calculation used for the Functional Annotation Clustering ToolAn example of the group enrichment score calculation used for the Functional Annotation Clustering Tool.Click here for fileAdditional data file 7Fourteen annotation categories used in the DAVID Functional Classification ToolFourteen annotation categories used in the DAVID Functional Classification Tool.Click here for fileAdditional data file 8Graphical instruction and tutorial on how to use the DAVID Func-tional Classification Tool and the DAVID Functional Annotation Clustering ToolGraphical instruction and tutorial on how to use the DAVID Func-tional Classification Tool and the DAVID Functional Annotation Clustering Tool.Click here for fileAdditional data file 9The output examples for the related gene search and related term search(a) Related gene search for 'interleukin 8' in the scope of demo list 2. (b) Related term search for 'inflammatory response' in the scope of all annotations. (c) Related gene search for a group of genes, group 1 for demo list 2, identified by the DAVID Gene Functional Classification Tool.Click here for fileAdditional data file 10The default setting for minimum overlapped annotation in kappa score calculation(a) Significant kappa scores (≥0.35 based on randomization study in Figure 3) can be obtained only for gene-gene pairs with higher overlapped annotation terms (≥10). Thus, there is no reason to cal-culate kappa scores, in an attempt to save the calculating time for DAVID Functional Classification, for the large number of those gene-gene pairs with fewer annotation terms overlapped. A con-servative default filter is 4. (b) Such a default filer (blue curve) has somewhat greater impact on the significant kappa scores in the higher end, compared to those in the lower end. However, it will skip a significant amount of kappa calculation of gene-gene pairs.Click here for fileAdditional data file 11The effect of kappa statistics on biased annotation dataThe annotation data contents contain many more 0 s than 1 s. The test shows that kappa statistics is able to detect 1-1 relationships, which are the key biological co-occurrences that we desire to measure.Click here for fileAdditional data file 12A hypothetical example to measure the relationships of gene-gene pairs by kappa statistics with annotations organized in a 'flat' matrixThe examples suggest that the 'flat' matrix strategy, along with kappa statistics, allows for the quantitative measurement of gene-gene and term-term relationships based on global annotation pro-files. All levels of annotation are important to measurement contribution.Click here for fileAdditional data file 13A hypothetical example to demonstrate the general procedure of our agglomeration procedureThe example provides a step-by-step demonstration of the cluster-ing algorithm, thereby showing how the members are grouped together, how the number of total groups are determined, and how fuzziness can occur.Click here for fileAdditional data file 14Detailed results, comparisons and discussion of the new DAVID clustering tools with regards to yeast cell cycle G1 genes [21]Detailed results, comparisons and discussion of the new DAVID clustering tools with regards to yeast cell cycle G1 genes [21]Click here for fileAdditional data file 15The annotation results of demo list 2 by GOMiner, GOStat, DAVID chart, topGO, ermineJ ORA, Ontologizer (three methods), ADGO and GENECODISThe annotation results all point in the right direction, that is, inflammatory responses. However, the redundant/similar/hierar-chical terms are spread throughout the results, which decreases analytical efficiency. In addition, some of the key terms reported by the original publication are not on the top of the results produced by other tools, but are always covered by the DAVID tools.Click here for file
Acknowledgements
The authors are grateful to the reviewers for their constructive comments.
We would like to thank David Liu and David Bryant in the ABCC group for
database and web server support. We thank Yongjian Guo in BSSP/OTIS/
NIAID for his comments on the manuscript. We would like to thank Wei
Gao, Melaku Gedil, Ping Ren, and Jun Yang in the LIB group for helpful
works and discussions, and Doug Powell in the CS&S group for helpful sta-
tistical discussions. We also thank Bill Wilton and Mike Tartakovsky for
information technology and network support. This research was supported
in whole by the National Institute of Allergy and Infectious Disease. This
project has been funded in whole with federal funds from the National Can-
cer Institute, National Institutes of Health, under contract N01-CO-12400.
The content of this publication does not necessarily reflect the views or
policies of the Department of Health and Human Services, nor does men-
tion of trade names, commercial products, or organizations imply endorse-
ment by the US Government. Funding to pay the Open Access publication
charges for this article was provided by the same source as above.
References
1. Dennis G Jr, Sherman BT, Hosack DA, Yang J, Gao W, Lane HC, Lem-
picki RA: DAVID: Database for Annotation, Visualization, and
Integrated Discovery. Genome Biol 2003, 4:P3.
2. Hosack DA, Dennis G Jr, Sherman BT, Lane HC, Lempicki RA: Iden-
tifying biological themes within lists of genes with EASE.
Genome Biol 2003, 4:R70.
3. Beissbarth T, Speed TP: GOstat: find statistically overrepre-
sented Gene Ontologies within a group of genes. Bioinformatics
2004, 20:1464-1465.
4. Al-Shahrour F, Diaz-Uriarte R, Dopazo J: FatiGO: a web tool for
finding significant associations of Gene Ontology terms with
groups of genes. Bioinformatics 2004, 20:578-580.
5. Martin D, Brun C, Remy E, Mouren P, Thieffry D, Jacq B: GOTool-
Box: functional analysis of gene datasets based on Gene
Ontology. Genome Biol 2004, 5:R101.
6. Al-Shahrour F, Minguez P, Vaquerizas JM, Conde L, Dopazo J: BABE-
LOMICS: a suite of web tools for functional annotation and
analysis of groups of genes in high-throughput experiments.
Nucleic Acids Res 2005, 33:W460-464.
7. Castillo-Davis CI, Hartl DL: GeneMerge - post-genomic analysis,
data mining, and hypothesis testing. Bioinformatics 2003,
19:891-892.
8. Zhong S, Storch KF, Lipan O, Kao MC, Weitz CJ, Wong WH: GoS-
urfer: a graphical interactive tool for comparative analysis of
large gene sets in gene ontologytrade mark space. Appl
Bioinformatics 2004, 3:261-264.
9. Zhang B, Schmoyer D, Kirov S, Snoddy J: GOTree Machine
(GOTM): a web-based platform for interpreting sets of inter-
esting genes using Gene Ontology hierarchies. BMC
Bioinformatics 2004, 5:16.
10. Shah NH, Fedoroff NV: CLENCH: a program for calculating
Cluster ENriCHment using the Gene Ontology. Bioinformatics
2004, 20:1196-1197.
11. Draghici S, Khatri P, Bhavsar P, Shah A, Krawetz SA, Tainsky MA:
Onto-Tools, the toolkit of the modern biologist: Onto-
Express, Onto-Compare, Onto-Design and Onto-Translate.
Nucleic Acids Res 2003, 31:3775-3781.
12. Khatri P, Bhavsar P, Bawa G, Draghici S: Onto-Tools: an ensemble
of web-accessible, ontology-based tools for the functional
design and interpretation of high-throughput gene expres-
sion experiments. Nucleic Acids Res 2004, 32:W449-456.
13. Sharan R, Maron-Katz A, Shamir R: CLICK and EXPANDER: a
system for clustering and visualizing gene expression data.
Bioinformatics 2003, 19:1787-1799.
14. Liu H, Hu ZZ, Wu CH: DynGO: a tool for visualizing and mining
of Gene Ontology and its associations. BMC Bioinformatics 2005,
6:201.
15. Lee JS, Katari G, Sachidanandam R: GObar: a gene ontology based
analysis and visualization tool for gene sets. BMC Bioinformatics
2005, 6:189.
16. Zeeberg BR, Qin H, Narasimhan S, Sunshine M, Cao H, Kane DW,
Reimers M, Stephens RM, Bryant D, Burt SK, et al.: High-through-
put GoMiner, an 'industrial-strength' integrative gene ontol-
ogy tool for interpretation of multiple-microarray
experiments, with application to studies of common variable
immune deficiency (CVID). BMC Bioinformatics 2005, 6:168.
17. Khatri P, Draghici S: Ontological analysis of gene expression
data: current tools, limitations, and open problems. Bioinfor-
matics 2005, 21:3587-3595.
18. Maere S, Heymans K, Kuiper M: BiNGO: a Cytoscape plugin to
assess overrepresentation of gene ontology categories in
biological networks. Bioinformatics 2005, 21:3448-3449.
19. Berriz GF, King OD, Bryant B, Sander C, Roth FP: Characterizing
gene sets with FuncAssociate. Bioinformatics 2003,
19:2502-2504.
20. Ben-Shaul Y, Bergman H, Soreq H: Identifying subtle interrelated
changes in functional gene categories using continuous
measures of gene expression. Bioinformatics 2005, 21:1129-1137.
21. Zhong S, Tian L, Li C, Storch KF, Wong WH: Comparative analy-
sis of gene sets in the Gene Ontology space under the multi-
ple hypothesis testing framework. Proc IEEE Comput Syst
Bioinform Conf 2004:425-435.
22. Doniger SW, Salomonis N, Dahlquist KD, Vranizan K, Lawlor SC,
Conklin BR: MAPPFinder: using Gene Ontology and Gen-
MAPP to create a global gene-expression profile from
microarray data. Genome Biol 2003, 4:R7.
23. Cheng J, Sun S, Tracy A, Hubbell E, Morris J, Valmeekam V, Kim-
brough A, Cline MS, Liu G, Shigeta R, et al.: NetAffx Gene Ontol-
ogy Mining Tool: a visual approach for microarray data
analysis. Bioinformatics 2004, 20:1462-1463.
24. Robinson PN, Wollstein A, Bohme U, Beattie B: Ontologizing
gene-expression microarray data: characterizing clusters
with Gene Ontology. Bioinformatics 2004, 20:979-981.
25. Bluthgen N, Brand K, Cajavec B, Swat M, Herzel H, Beule D: Biolog-
R183.16 Genome Biology 2007, Volume 8, Issue 9, Article R183 Huang et al. />Genome Biology 2007, 8:R183
ical profiling of gene groups utilizing Gene Ontology. Genome
Inform 2005, 16:106-115.
26. DAVID Home Page []
27. DAVID Gene Functional Classification Tool
[ />28. DAVID Functional Annotation Clustering
[ />29. DAVID Knowledgebase [ />tent.jsp?file=/knowledgebase/DAVID_knowledgebase.html]
30. Cohen J: A coefficient of agreement for nominal scales. Educ
Psychol Meas 1960, 20:37-46.
31. Byrt T, Bishop J, Carlin JB: Bias, prevalence and kappa. J Clin
Epidemiol 1993, 46:423-429.
32. Alexa A, Rahnenfuhrer J, Lengauer T: Improved scoring of func-
tional groups from gene expression data by decorrelating
GO graph structure. Bioinformatics 2006, 22:1600-1607.
33. Grossmann S, Buaer S, Robinson PN, Vingron M: An improved sta-
tistic for detecting over-represented Gene Ontology annota-
tions in gene sets. Res Comput Mol Biol 2006, 3909:85-98.
34. Bader GD, Betel D, Hogue CW: BIND: the Biomolecular Inter-
action Network Database. Nucleic Acids Res 2003, 31:248-250.
35. Spellman PT, Sherlock G, Zhang MQ, Iyer VR, Anders K, Eisen MB,
Brown PO, Botstein D, Futcher B: Comprehensive identification
of cell cycle-regulated genes of the yeast Saccharomyces
cerevisiae by microarray hybridization. Mol Biol Cell 1998,
9:3273-3297.
36. Lee HK, Braynen W, Keshav K, Pavlidis P: ErmineJ: tool for func-
tional analysis of gene expression data sets. BMC Bioinformatics
2005, 6:269.
37. Nam D, Kim SB, Kim SK, Yang S, Kim SY, Chu IS: ADGO: analysis
of differentially expressed gene sets using composite GO
annotation. Bioinformatics 2006, 22:2249-2253.
38. Carmona-Saez P, Chagoyen M, Tirado F, Carazo JM, Pascual-Montano
A: GENECODIS: a web-based tool for finding significant con-
current annotations in gene lists. Genome Biol 2007, 8:R3.
39. Cicala C, Arthos J, Selig SM, Dennis G Jr, Hosack DA, Van Ryk D,
Spangler ML, Steenbeke TD, Khazanie P, Gupta N, et al.: HIV enve-
lope induces a cascade of cell signals in non-proliferating tar-
get cells that favor virus replication. Proc Natl Acad Sci USA 2002,
99:9380-9385.
40. Affymetrix
[ />41. Clayton F, Kapetanovic S, Kotler DP: Enteric microtubule depo-
lymerization in HIV infection: a possible cause of HIV-associ-
ated enteropathy. Aids 2001, 15:123-124.
42. Isel C, Karn J: Direct evidence that HIV-1 Tat stimulates RNA
polymerase II carboxyl-terminal domain hyperphosphoryla-
tion during transcriptional elongation. J Mol Biol 1999,
290:929-941.