Báo cáo y học: "DetectiV: visualization, normalization and significance testing for pathogen-detection microarray data" pot
Bạn đang xem bản rút gọn của tài liệu. Xem và tải ngay bản đầy đủ của tài liệu tại đây (838.39 KB, 12 trang )
Genome Biology 2007, 8:R190
Open Access
2007Watsonet al.Volume 8, Issue 9, Article R190
Software
DetectiV: visualization, normalization and significance testing for
pathogen-detection microarray data
Michael Watson
*
, Juliet Dukes
†
, Abu-Bakr Abu-Median
*
, Donald P King
†
and Paul Britton
*
Addresses:
*
Institute for Animal Health, Compton, Newbury, Berks RG20 7NN, UK.
†
Institute for Animal Health, Pirbright, Surrey GU24 0NF,
UK.
Correspondence: Michael Watson. Email:
© 2007 Watson et al.; licensee BioMed Central Ltd.
This is an open access article distributed under the terms of the Creative Commons Attribution License ( which
permits unrestricted use, distribution, and reproduction in any medium, provided the original work is properly cited.
Analysis of pathogen-detection microarray data<p>DetectiV is a tool for analyzing pathogen-detection microarray datasets that allows simple visualisation, normalisation and significance testing.</p>
Abstract
DNA microarrays offer the possibility of testing for the presence of thousands of micro-organisms
in a single experiment. However, there is a lack of reliable bioinformatics tools for the analysis of
such data. We have developed DetectiV, a package for the statistical software R. DetectiV offers
powerful yet simple visualization, normalization and significance testing tools. We show that
DetectiV performs better than previously published software on a large, publicly available dataset.
Rationale
One of the key applications of metagenomics is the identifica-
tion and quantification of species within a clinical or environ-
mental sample. Microarrays are particularly attractive for the
recognition of pathogens in clinical material since current
diagnostic assays are typically restricted to the detection of
single targets by real-time PCR or immunological assays. Fur-
thermore, molecular characterization and phylogenetic anal-
ysis of these signatures can require downstream sequencing
of genomic regions. Many microarrays have already been pro-
duced with the aim of characterizing the spectrum of micro-
organisms present in a sample, including detection of known
viruses [1-5], assessment of bioterrorism [6,7] and monitor-
ing food quality [8].
However, the use of DNA microarrays for routine applica-
tions produces many challenges for bioinformatics. Firstly,
probe selection is a difficult and time consuming process.
There are a huge number of diverse species in nature, of
which we have sequence information for only a tiny fraction.
This makes it difficult to find oligonucleotides, either alone or
in combination, that uniquely identify species of interest. Oli-
gos may have homology to multiple species, which results in
a complex and noisy hybridization pattern. Secondly, each
nucleic acid sample tested will typically contain a mixture of
DNA and RNA from the organism of interest, the host and
from a variety of contaminants, which may all contribute to
the resulting microarray profile. Furthermore, this may be
complicated by the presence of multiple, possibly related,
pathogen species, making it difficult to separate patterns due
to cross-hybridization from a true positive result.
Urisman et al. [9] have previously reported E-Predict, a com-
putational strategy for species identification based on
observed microarray hybridization patterns. E-Predict uses a
matrix of theoretical hybridization energy profiles calculated
by BLAST-ing completely sequenced viral genomes against
the oligos on their array, and calculating a free energy of
hybridization. Observed hybridization profiles are then com-
pared to the theoretical profiles using a similarity metric, and
a p value calculated using a set of experimentally obtained
null probability distributions. E-Predict has been shown to
Published: 14 September 2007
Genome Biology 2007, 8:R190 (doi:10.1186/gb-2007-8-9-r190)
Received: 1 June 2007
Revised: 15 August 2007
Accepted: 14 September 2007
The electronic version of this article is the complete one and can be
found online at />R190.2 Genome Biology 2007, Volume 8, Issue 9, Article R190 Watson et al. />Genome Biology 2007, 8:R190
produce useful results in a number of situations. However, at
present, E-Predict does not contain any tools for visualiza-
tion, and requires extensive customization and calculation
before it is applicable to new arrays. Also, E-Predict is only
available as a CGI script for Unix/Linux platforms.
We present DetectiV, a package for R [10] containing func-
tions for visualization, normalization and significance testing
of pathogen detection microarray data. R is a freely available
statistical software package available for Windows, Unix/
Linux and MacOS, meaning DetectiV is a platform independ-
ent solution. DetectiV uses simple and established methods
for visualization, normalization and significance testing.
When applied to a publicly available microarray dataset,
DetectiV produces the correct result in 55 out of 56 arrays
tested, an improvement on previously published methods.
When applied to a second dataset, DetectiV produces the cor-
rect result in 12 out of 12 arrays.
Implementation
DetectiV is implemented as a package for R, a powerful, open-
source software package for statistical programming [10].
Many packages for R already exist for the analysis of biologi-
cal datasets, including microarray data, and the bioconductor
project [11] is just one example of a group of such packages.
As it is implemented in R, DetectiV easily integrates with
many of the packages available for microarray analysis,
including limma [12], marray [11] and affy [13].
DetectiV is written in the native R language and uses standard
functions within R. As R is available on Microsoft Windows,
Unix (including linux) and MacOS, DetectiV represents a
platform independent solution for the analysis of pathogen-
detection microarray data.
The flow of information through DetectiV is shown in Figure
1. The basic dataset required is a matrix of data, with rows
representing probes on the array, and columns representing
measurements from individual microarrays. This dataset is
easily produced from data structures created by limma [12],
which includes functions for reading in many common micro-
array scanner output formats, and affy [13], which provides
functions for reading in affymetrix data. Commonly,
researchers will have an additional file of information giving
details about each probe. In the case of pathogen detection
arrays, this file will most often contain the type, species,
genus and other classification data for the pathogen to which
each probe is designed. It should be noted that there may be
more than one entry in this file for each probe; for example, if
a given probe is thought to hybridize to multiple pathogens.
In text format, these may be read in using the native
read.table command, or in excel format using the RODBC
library.
Once these two datasets are in R, DetectiV prepares them for
analysis using the prepare.data function. This function joins
the array data to the probe information data based on a
unique ID. The researcher may choose to subtract local back-
ground if appropriate. The default at this stage is to average
over replicate probes, again based on a unique ID. This will
result in a single value for each unique probe for each array.
The data will have one or more columns of extra information
from the annotation file, and these columns will be used to
group the data for further analysis.
Researchers will wish to visualize their data in order to com-
pare the hybridization signals for the probes recognizing the
different pathogen signatures. DetectiV provides a function
called show.barplot for this. The output from prepare.data is
passed to the function, along with the name of the column
containing the variable by which the data will be grouped,
referred to here as group. An example in pathogen detection
data may be species, genus, family, and so on. The data are
sorted into unique groups as defined by the unique values of
group. A barplot is drawn, with one bar per unique probe.
Probes from the same group are drawn together. Each group
is represented by a unique background color, enabling the
user to easily visualize the different groups. An example out-
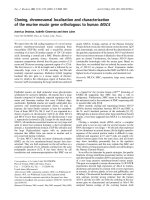
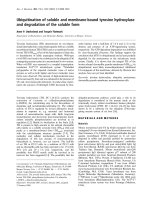
put is shown in Figure 2. This sample comes from Urisman et
al [9] and represents data from a virus detection microarray
hybridized with amplified RNA from nasal lavage, positive for
respiratory syncytial virus by direct fluorescent antibody
(DFA) test. The group chosen here is virus family. It is quite
clear from this image that there is a virus from the family Par-
amyxoviridae present in the sample, demonstrated by the
high bars associated with that family.
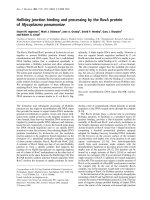
These images are often very large, and so DetectiV offers the
ability to subset the data before plotting by using the get.sub-
set function. Figure 3 shows a similar barplot using a subset
of the data: only those oligos representing species that belong
to the Paramyxoviridae family. It is clear from this image
that those oligos representing different groups/species of res-
piratory syncytial virus have the highest intensity, as we
would expect, although there is cross-hybridization with oli-
gos for human metapneumovirus (another paramyxovirus in
the same sub-family: Pneumovirinae).
DetectiV may also carry out normalization and significance
testing. For this, there is the function normalise. Here, the
aim of normalization is to represent the data in relation to a
negative control. The idea is that if the values for each probe
are divided by the negative control and then the log2 taken,
then the data should be normally distributed, and each group
should have a mean of zero (providing a pathogen is not
present). Traditional statistical tests can then be used to test
if any group of probes is significantly different from zero.
DetectiV offers three methods of normalization, each using a
different 'type' of negative control, and these are summarized
in Table 1.
Genome Biology 2007, Volume 8, Issue 9, Article R190 Watson et al. R190.3
Genome Biology 2007, 8:R190
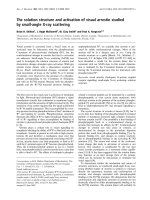
Flow of information, and steps taken, when analyzing pathogen detection microarray data using DetectiVFigure 1
Flow of information, and steps taken, when analyzing pathogen detection microarray data using DetectiV.
Read array data
(e.g. limma, affy,
read.table)
Read probe annotation
data
(e.g. read.table, RODBC)
Join array and probe
data, average over
replicates
(prepare.data)
Visualise
(show.barplot)
Normalise: median,
control spots or control
array
(normalise)
Significance testing:
detect pathogens
(do.t.test)
R190.4 Genome Biology 2007, Volume 8, Issue 9, Article R190 Watson et al. />Genome Biology 2007, 8:R190
GSM40814 by familyFigure 2
GSM40814 by family. Example barplot from DetectiV showing data from a virus detection microarray. The sample included amplified RNA from nasal
lavage, positive for respiratory syncytial virus by DFA. Oligos have been averaged over replicates and grouped according to virus family. Each unique oligo
is represented by a single bar. Each virus family has a unique background color. The y-axis is raw intensity.
0 10,000 15,000 20,000 25,0005,000
Adenoviridae
Baculoviridae
Bromoviridae
Bunyaviridae
Caliciviridae
Caulimoviridae
Circoviridae
Comoviridae
Coronaviridae
Dicistroviridae
Flaviviridae
Flexiviridae
Geminiviridae
Hepadnaviridae
Herpesviridae
Inoviridae
Leviviridae
Luteoviridae
Microviridae
Myoviridae
Papillomaviridae
Paramyxoviridae
Partitiviridae
Parvoviridae
Picornaviridae
Podoviridae
Polyomaviridae
Potyviridae
Poxviridae
Reoviridae
Retroviridae
Rhabdoviridae
Satellite Nucleic Ac
Sequiviridae
Siphoviridae
Sobemovirus
Tobamovirus
Togaviridae
Tombusviridae
Totiviridae
Tymoviridae
GSM40814 by family
Genome Biology 2007, Volume 8, Issue 9, Article R190 Watson et al. R190.5
Genome Biology 2007, 8:R190
GSM40814 Paramyxoviridae by speciesFigure 3
GSM40814 Paramyxoviridae by species. Example barplot from DetectiV showing data from a virus detection microarray. The sample included amplified
RNA from nasal lavage, positive for respiratory syncytial virus by DFA. Only oligos representing species from the Paramyxoviridae family are shown.
Oligos have been averaged over replicates and grouped according to virus species. Each unique oligo is represented by a single bar. Each virus species has
a unique background color. The y-axis is raw intensity.
0 5,000 10,000 15,000 20,000 25,000
Avian paramyxovirus 6
Bovine parainfluenza virus 3
Bovine respiratory syncytial virus
Canine distemper virus
Hendra virus
Human metapneumovirus
Human parainfluenza virus 1 strain
Human parainfluenza virus 2
Human parainfluenza virus 3
Human respiratory syncytial virus
Measles virus
Mumps virus
Newcastle disease virus
Nipah virus
Respiratory syncytial virus
Rinderpest virus
Sendai virus
Tioman virus
Tupaia paramyxovirus
Paramyxoviridae by species
R190.6 Genome Biology 2007, Volume 8, Issue 9, Article R190 Watson et al. />Genome Biology 2007, 8:R190
The median method calculates the global median value for
each array. It should be noted that this method assumes that
most probes will not hybridize to anything. If this assumption
is false then this method should not be used. However, if the
assumption holds, then the median is a good representation
of that value we would expect to see from probes that have not
hybridized to anything.
The control method relies on specific negative controls having
been spotted on the array. The researcher may then choose
one of these controls, and the mean value is calculated for that
control for each of the arrays. The mean control value for each
array is then used as a divisor for each probe on their respec-
tive arrays.
Finally, the array method utilizes an entire control array or
channel. In this instance, an entire array is chosen to be the
negative control, and all probe values are divided by their
respective elements from the control array. An obvious exam-
ple for a control array may be RNA from a known uninfected
animal. The control array therefore has a value for each spe-
cific probe representing that value we would expect to see if
that specific probe has not hybridized to anything.
In all instances, after taking the log2, groups of probes that
have not hybridized to anything should be normally distrib-
uted and have mean zero. We can therefore split the probes
into groups and perform a t-test for each one. DetectiV does
this using the do.t.test function. The normalized (or raw) data
are split into groups as defined by the unique values of a user
defined annotation column. Providing each group has more
than two probes, a t-test is performed to test the difference of
the observations from zero. The average value is also calcu-
lated. The output is a table, sorted by p value.
Methods and data analysis
The data used were downloaded from the Gene Expression
Omnibus (GEO) [14], accession number GSE2228. The array
platform for this data is GEO accession GPL1834, and
includes over 11,000 oligos representing over 1,000 viral and
bacterial species [4].
The dataset itself consists of 56 arrays including 15 independ-
ent HeLa RNA hybridizations, 10 independent nasal lavage
samples positive for respiratory syncytial virus, 7 independ-
ent nasal lavage samples positive for influenza A virus, a
serum sample positive for hepatitis B virus, a nasal lavage
sample positive for both influenza A virus and respiratory
syncytial virus, and culture samples of 11 distinct human rhi-
novirus serotypes.
Both DetectiV and E-Predict [9] have been used to analyze the
data. For DetectiV, the data were not corrected for local back-
ground. Missing, negative and zero values were set to a
nominal value of 0.5. Intensities were averaged across repli-
cate probes. Median normalization was then carried out, fol-
lowed by a t-test grouping the data by virus species. Probes
representing actin, GAPDH and Line_Sine were filtered from
Table 1
DetectiV normalization methods
Method Normalized statistic Terms
Median
Where is the value for probe i on array j and is the median value for all probes on array j
Control
Where is the value for probe i on array j and is the mean value for control oligo c on array j
Array
Where is the value for probe i on array j and is the value for probe i on control array/channel c
Explanation of the three normalized statistics offered by DetectiV.
log
2
xx
j
i
j
()
x
j
i
x
j
log
2
xc
j
i
j
()
x
j
i
c
j
log
2
xx
j
i
c
i
()
x
j
i
x
c
i
Table 2
E-Predict parameters
Parameter Value
user_wts MV_72worst_medRaw500_badYdens
norm_opt Sum
energy_filter undef
ematrix 22/07/2004
ematrix_norm Quadratic
ematrix_efilter 30
dist_metric Pearson Uncentered
iterate 2
top_oligos 5
top_genomes 5
top_fams 5
sort_by Distance|P value
eclust None
Parameters used for input into E-Predict.
Genome Biology 2007, Volume 8, Issue 9, Article R190 Watson et al. R190.7
Genome Biology 2007, 8:R190
the results. Results were first filtered such that groups had a
normalized log2 ratio greater than or equal to 1 (a ratio of two
to the control) and then sorted by p value. This method will be
referred to as DetectiV.
For E-Predict, default values for all parameters were used,
and are shown in Table 2. Data points were corrected for local
background, as per the examples in Urisman et al. [9]. E-Pre-
dict filters out 266 oligos by default, and this setting was kept.
In all cases, E-Predict carried out two iterations, although
only results from the first iteration are shown here. The best
performing method of interpreting the results was to take
those species with a p value ≤ 0.05 and sort by distance
(termed E-Predict.dist). Note that this is the method cited in
[9], example 3, used to demonstrate E-Predict's ability to
detect SARS.
Pathogen detection arrays have also been implicated in the
discovery of SARS. Urisman et al. [9] reported that although
their original platform did not contain oligos designed to
SARS, once the SARS genome had been published, it was pos-
sible to recalculate the energy matrix for E-Predict and find
that the energy profile for SARS was the top hit (after taking
those viruses with low p values and sorting by distance). We
have applied DetectiV to the same dataset (GEO accession
GSE546). To include oligos for SARS, we searched a database
of oligo sequences on the array with sequence NC_004718
from RefSeq using NCBI blast. There were 61 oligos on the
array that hit the SARS genome with greater than 80%
identity across an alignment of 20 bp or more. In the analysis,
these oligos were assigned as representative of two viruses:
their original virus and SARS. The data were median normal-
ized and a t-test carried out using DetectiV.
Finally, having established that DetectiV compares favorably
with previously published software, we have validated the
DetectiV software by applying it to a second dataset. The data
used were downloaded from the GEO [14], accession number
GSE8746. The array platform for this data is GEO accession
GPL5725, and consists of 5,824 oligos representing over 100
viral families, species and subtypes. The dataset itself consists
of 12 arrays, 4 hybridized with RNA from cell cultured foot-
and-mouth disease virus (FMDV) type O, 3 hybridized with
RNA from FMDV type A, 1 hybridized with RNA from a sheep
infected with FMDV type O, and 4 hybridized with cell-cul-
tured avian infectious bronchitis virus (IBV). Analysis using
DetectiV was carried out as described above.
Results and comparison
We present here results from two methods of analysis, termed
DetectiV and E-Predict.dist, as described above. There are 56
arrays in the dataset, the expected results of which are known.
Each array was hybridized with RNA containing a single
virus, except GSM40845, which was infected with both influ-
enza A and respiratory syncytial virus. We assigned a correct
result for each method if the top hit from the analysis was the
same as the known infectious agent or, if that agent was not
represented on the array, the top hit was a very closely related
virus. In the case of GSM40845, we report a correct result if
both viruses were at the top of the reported hits, to the exclu-
sion of other virus species (but not closely related strains).
Additional data file 1 gives the top hit for both analysis meth-
ods in all 56 arrays. As can be seen, DetectiV generated a cor-
rect result in 55 out of the 56 arrays. In comparison, the E-
Predict.dist method gave a correct result in 53 out of the 56
arrays. These results are discussed in greater detail below.
DetectiV
Full results for each of the arrays can be found on the DetectiV
website [15]. Within the 55 correct results, there are three
classes that require slightly different interpretation, examples
of which are GSM40806, GSM40810 and GSM40817. Results
for these arrays are given in Table 3.
Array GSM40806 was hybridized with amplified HeLa RNA,
and the top hit from DetectiV is human papillomavirus type
18, as expected. This virus has both the smallest p value and
largest mean normalized log ratio. There is also clear
Table 3
Typical results from DetectiV
GSM40806 GSM40810 GSM40820
Virus p value Mean Virus p value Mean Virus p value Mean
Human papillomavirus type 18 4.1E-10 6.8 Human rhinovirus sp. 9.9E-12 4.1 Human herpesvirus 5 5.3E-16 0.57
Human endogenous retrovirus
K115
0.000016 4 Human rhinovirus A 2.3E-09 4.1 Respiratory syncytial virus 1.1E-09 4.26
Halovirus HF2 0.0017 2.1 Enterobacteria phage M13 2.2E-07 5.7 Human rhinovirus sp. 5.9E-08 0.75
Human papillomavirus type 45 0.002 3.3 Human rhinovirus 16 6.2E-07 3.5 Human rhinovirus B 1.4E-07 0.47
Subterranean clover stunt virus 0.0032 2.6 Human rhinovirus 1B 0.000001 3.5 Human rhinovirus A 6E-07 0.75
Top five hits from three microarrays showing typical results from DetectiV. All have been sorted by p value. GSM40806 and GSM40810 have been
filtered such that mean ≥ 1.
R190.8 Genome Biology 2007, Volume 8, Issue 9, Article R190 Watson et al. />Genome Biology 2007, 8:R190
distinction between the top hit and the rest of the hits below;
there are orders of magnitude between the values for both the
p value and the mean normalized log ratio. The other hits in
the table are expected as a result of hybridization by the virus
and host RNA to non-specific probes on the array. However,
the clear distinction in both the p value and mean log ratio
identify human papillomavirus type 18 as the top, and only,
hit.
GSM40810 was hybridized with RNA containing human rhi-
novirus 28. There are 24 distinct groups of human rhinovi-
ruses represented on the array, including a group of oligos for
all members ('human rhinovirus sp.), one each for human rhi-
novirus A and B, and several groups for distinct serotypes.
Human rhinovirus 28 is not one of those serotypes specifi-
cally targeted by the array; however, as a serotype of the
human rhinovirus A species, we would expect the groups for
human rhinovirus sp. and human rhinovirus A to be preva-
lent amongst the results. As can be seen from Table 3, the top
hit from DetectiV is human rhinovirus sp., closely followed by
human rhinovirus A, the expected result. The reason we have
highlighted this array, however, is that the result for Entero-
bacteria phage M13 shows a higher mean normalized inten-
sity than any of the rhinovirus groups. This is representative
of a class of result from DetectiV whereby a virus group has a
higher mean normalized log ratio, but a larger p value, than
the top hit. Here, as in GSM40806, we see orders of magni-
tude between the p value for the top hit and that for Entero-
bacteria phage M13, which identifies human rhinovirus as
being the infectious agent, but in this case we cannot rely on
the mean normalized intensity. In this particular instance,
Enterobacteria phage M13 is represented by 10 oligos, all of
which have intensities far greater than the global median, but
which vary considerably between 982 and 18,864. These high
values may be due to hybridization with a cloning vector.
Finally, array GSM40817 was hybridized with respiratory
syncytial virus. The results are again shown in Table 3, but for
this array only, they have not been filtered on mean normal-
ized intensity. Human herpesvirus 5 has by far the smallest p
value of any of the virus groups; however, it also has a very
small mean normalized log ratio. The correct hit, respiratory
syncytial virus, has the second smallest p value, but has a
much larger mean normalized log ratio. This represents the
final class of result seen by DetectiV, where the correct virus
group does not have the smallest p value, but does have a
much larger mean normalized log ratio than those groups
that have smaller p values. The small p value of respiratory
syncytial virus combined with the large mean normalized log
ratio identifies respiratory syncytial virus as the only
infectious agent. In this instance, human herpesvirus 5 is
represented by 241 oligos, 167 of which are greater than the
global median, but all of which have intensities less than
1,000. This could be due to the oligos for human herpesvirus
5 having distant homology with the infectious agent or host
cell.
These three types of result are typical of DetectiV, and explain
why both the p value and the mean normalized log ratio must
be taken into account when interpreting the results. Thus, if
the results from DetectiV are filtered such that only viruses
whose mean normalized log ratio is ≥ 1, and then sorted by p
value, the three scenarios described here are accounted for,
and we obtain the correct result in 55 out of the 56 arrays.
The single incorrect result for DetectiV comes from
GSM40816, which reports human herpesvirus 7 as the top
hit, whereas the infectious agent was in fact respiratory syn-
cytial virus. The top five hits for this array using the DetectiV
method are shown in Table 4. As can be seen, bovine respira-
tory syncytial virus and respiratory syncytial virus are second
and third, respectively. Both respiratory syncytial virus and
bovine respiratory syncytial virus have higher mean values
than human herpesvirus 7, although the latter has a smaller p
value and a mean value that is above the cut-off of 1. Had the
results been filtered for p value ≤ 0.5 and then ordered by
average value, then the top hit would have been respiratory
syncytial virus; similarly, if a cut-off of 2 had been applied
instead of 1, a correct result would have been reported. How-
ever, across the entire dataset these methods of interpreting
the results perform worse than the DetectiV method
described above. It is worth noting here that for this array, E-
Predict gives the correct top hit.
E-Predict
The results from E-Predict follow similar patterns to those of
DetectiV. In most cases it is obvious which virus is the infec-
tious agent, either by examining the p value, the similarity or
both together. Full results can be seen on the DetectiV website
[15]. However, there are certain results reported by E-Predict
where it is impossible to obtain the correct result no matter
which combination of p value and similarity is used. These
arrays are arrays are GSM40809, GSM40821 and
GSM40847, and the top five results for these arrays can be
seen in Table 5.
GSM40809 was hybridized with RNA containing human rhi-
novirus 26. Again, this is a serotype not specifically targeted
by the array; however, as a serotype of human rhinovirus B we
Table 4
Incorrect DetectiV result
Virus p value Mean
Human herpesvirus 7 8.60E-06 1.7
Bovine respiratory syncytial virus 2.70E-04 2
Respiratory syncytial virus 3.30E-04 3.2
Ictalurid herpesvirus 1 1.50E-03 1.7
Human herpesvirus 6B 1.50E-03 1.8
Top five hits from the DetectiV method from array GSM40816. The
sample for this array was found to contain respiratory syncytial virus by
DFA.
Genome Biology 2007, Volume 8, Issue 9, Article R190 Watson et al. R190.9
Genome Biology 2007, 8:R190
would expect the 'human rhinovirus sp.' and 'human
rhinovirus B' groups to be the top hits (this is the case for
DetectiV). However, E-Predict reports human enterovirus D
as having the smallest p value, and enterovirus Yanbian 96-
83csf as having the largest similarity. The top five hits
reported in Table 5 for this array all have similar p values and
similarity measures, and there is no way of sorting or filtering
the results such that human rhinovirus B becomes the top hit.
Without the a priori knowledge that human rhinovirus 26
was the infectious agent, it would be more likely to conclude
that a species of enterovirus was present in the sample. It is
no surprise that these viruses are being confused, as they are
related viruses from the Picornaviridae family. However,
DetectiV is capable of calling the correct result in this
instance, whereas E-Predict is not.
Array GSM40821 was infected with hepatitis B virus but E-
Predict reports orangutan hednavirus as having both a
smaller p value and a higher similarity. This is not that sur-
prising given that hepatitis B and orangutan hepadnavirus
are closely related; however, the fact remains that with no a
priori knowledge, the only logical conclusion from this result
would be that the infectious agent was orangutan hepadnavi-
rus. Again, DetectiV calls this array correctly.
Finally, array GSM40847 was hybridized with RNA contain-
ing human rhinovirus 87. Again, this is a serotype not specif-
ically targeted by the array, and is not present in the NCBI
taxonomy database [16] at the time of writing. We can there-
fore expect the 'human rhinovirus sp.' group to be high
amongst the results (in fact, it is the top result for DetectiV).
E-Predict reports human enterovirus B as having the smallest
p value and human echovirus 1 as having the largest similar-
ity. In fact, E-Predict does not report any rhinovirus oligos in
the first iteration at all, and it is only in the second iteration
that the group human rhinovirus A is reported as significant.
In the three cases outlined above, there is no clear way of dis-
tinguishing the incorrect virus from the correct one. There is
also no consistent method of sorting or filtering the results
that would give the correct results. In these three cases, E-
Predict is unable to distinguish closely related virus species
and serotypes. We have reported here the best performing
method of interpreting E-Predict results, whereby virus
groups with a p value ≤ 0.05 are sorted by distance. This
results in a success rate of 53 out of 56 arrays.
DetectiV and SARS
The top five hits from the analysis of the SARS dataset can be
found in Table 6. As can be seen, the top hit is SARS, with the
lowest p value and the highest mean normalized log ratio.
SARS is distinct from the other viruses, having a p value three
orders of magnitude lower than the second top hit.
Validation
Full results can be found on the DetectiV website [17]. The top
hit from DetectiV for each of the 12 arrays from GSE8746 can
be found in Table 7. As can be seen, DetectiV clearly identifies
the infectious agent in all 12 cases. DetectiV works for both
the cell-cultured samples and the infected sheep, and shows
the ability of the array to distinguish between different sub-
types of FMDV.
Discussion
Developing a quick and reliable test for the presence/absence
of thousands of bacterial and viral species in a single
experiment is an attractive proposition, and a function that
DNA microarrays are ideally suited to. Microarrays are
extremely high-throughput and relatively cheap. In the case
of pathogen detection, the aim must be to quickly and clearly
identify those pathogens present in a sample with high
confidence, keeping false positives and false negatives to a
minimum.
However, the data from such microarrays pose many prob-
lems. Firstly, oligos may not be unique to the species they are
designed to. For certain species it is impossible to find a large
number of oligos that are unique only to that virus that meet
the criteria for oligo selection. This is particularly problematic
Table 5
Incorrect E-Predict results
GSM40809 GSM40821 GSM40847
Virus p value Similarity Virus p value Similarity Virus p value Similarity
Human enterovirus D 0.000043 0.258894 Orangutan
hepadnavirus
0.002291 0.148865 Human enterovirus B 0.000014 0.386095
Human rhinovirus B 0.000045 0.267815 Hepatitis B virus 0.002376 0.147182 Human enterovirus A 0.000016 0.378912
Human enterovirus C 0.000052 0.254504 Woodchuck hepatitis B
virus
0.002716 0.10964 Human echovirus 1 0.000022 0.414618
Enterovirus Yanbian 96-
83csf
0.000094 0.276873 Woolly monkey
hepatitis B Virus
0.00284 0.128919 Enterovirus Yanbian
96-83csf
0.000022 0.412299
Human echovirus 1 0.000134 0.253816 Arctic ground squirrel
hepatitis B virus
0.003227 0.103357 Human enterovirus D 0.000026 0.296065
Top five results from the E-Predict.dist method for arrays GSM40809, GSM40821 and GSM40847. In all cases results are ordered by p value.
R190.10 Genome Biology 2007, Volume 8, Issue 9, Article R190 Watson et al. />Genome Biology 2007, 8:R190
for closely related species and strains. In such cases, the 'best'
oligos are added to the array, in the knowledge that multiple
viruses may hybridize to them. This leads to noisy signals
across multiple virus families, species and serotypes. Sec-
ondly, infected biological samples may contain many differ-
ent virus species and strains, making interpretation difficult.
Thirdly, it is known that certain oligos simply do not work,
even when the array is hybridized with the species that those
oligos were designed to. Without testing the array with each
virus, we are incapable at present of predicting which oligos
will work and which will not. With thousands of species per
array, many of which cannot be cultured in vitro, it is unfea-
sible to challenge arrays with every species. Finally, we of
course do not know, nor can we ever know, the complete
genome sequence of every virus we may encounter.
Therefore, though we think we have oligos unique to a species
or strain, that is only ever in the context of our knowledge at
the time of design, and they may not in fact be unique.
Despite these problems, many species detection arrays have
been developed [1-5]. However, reliable methods of data
analysis have been rare. Initial methods included visual
inspection of the array [4] and clustering [18], both of which
are subjective and time-consuming. To combat this, Urisman
et al. [9] have proposed a more robust method, E-Predict. E-
Predict utilizes a pre-calculated energy matrix for each oligo
on the array and uses a variety of normalization and similarity
metrics to calculate a p value and similarity for each virus.
The advantages of E-Predict are that it is quantitative, pro-
duces good results and is extensible, through the extension of
the energy matrix. The disadvantages of the software are a
lack of visualization tools, the need to customize parameters
for different array platforms and hybridization conditions,
and the availability of the software only as a CGI script on the
Unix/Linux platform.
We have developed DetectiV, a package for R containing vis-
ualization, normalization and significance testing functions
for pathogen detection data. DetectiV uses simple and well
established visualization and statistical techniques to analyze
data from pathogen detection microarrays. DetectiV offers a
powerful visualization option in the form of a barplot, ena-
bling researchers to quickly and easily identify possible infec-
tious agents. Data can then normalized to a negative control
Table 6
DetectiV results for SARS array
Virus p value Mean
SARS 8.43E-09 1.906095
Human herpesvirus 7 3.29E-06 1.292008
Simian retrovirus 2 4.27E-05 1.328653
Coliphage alpha3 6.08E-05 1.113462
Transmissible gastroenteritis virus 7.88E-05 1.463675
Top five results from the DetectiV method of analyzing array GSM8528 from GEO accession GSE546. The sample hybridized to the array contained
the SARS virus.
Table 7
Top hit for GSE8746
Array RNA Top hit p value Mean
GSM216542 Amplified RNA from cell cultured FMDV type O FMDO 1.51E-25 2.296645
GSM217164 Amplified RNA from cell cultured FMDV type O FMDO 1.07E-45 3.513068
GSM217167 Amplified RNA from cell cultured FMDV type O FMDO 2.36E-48 3.446262
GSM217169 Amplified RNA from cell cultured FMDV type O FMDO 5.91E-30 2.827877
GSM217172 Amplified RNA from cell cultured FMDV type A FMDA 6.96E-30 3.560941
GSM217175 Amplified RNA from cell cultured FMDV type A FMDA 8.71E-14 1.553392
GSM217177 Amplified RNA from sheep infected with FMDV type O FMDO 1.12E-27 2.431874
GSM217180 Amplified RNA from cell cultured FMDV type A FMDA 2.97E-33 3.609092
GSM217183 Amplified RNA from cell cultured Avian IBV IBV 1.05E-21 5.262134
GSM217184 Amplified RNA from cell cultured Avian IBV IBV 3.49E-33 7.958662
GSM217186 Amplified RNA from cell cultured Avian IBV IBV 6.20E-33 7.827526
GSM217188 Amplified RNA from cell cultured Avian IBV IBV 1.44E-35 8.0118
The top hit from DetectiV for the 12 arrays from the GSE8746 dataset. DetectiV produces the correct result in all 12 cases.
Genome Biology 2007, Volume 8, Issue 9, Article R190 Watson et al. R190.11
Genome Biology 2007, 8:R190
(be that a specific probe, array or the global median), trans-
formed by taking the log2 and then subjected to a t-test for
each species on the array. Oligos are allowed to represent any
number of viruses, and thus any analysis is easily extensible
by simply updating the list of which oligos represent which
species.
DetectiV requires minimal set up and configuration, requir-
ing only an additional file detailing which species each oligo
represents. In the majority of cases, these files will already
exist. It is then possible to apply DetectiV 'out of the box' to
any array data that is readable by R or bioconductor. DetectiV
requires no training, configuration or customization specific
to each array. DetectiV is available as a package for R on both
Windows and Linux/Unix, and as such may be considered
platform-independent.
In this study, DetectiV produced the correct result in 55 out of
56 arrays, by filtering for viruses with a mean normalized log
ratio greater than 1 and then sorting by p value. We make the
distinction here between biological and statistical signifi-
cance. A statistically significant result may be obtained by a
group of oligos that display intensities only marginally larger
than the negative control (in this case the global median
intensity). This is demonstrated by human herpesvirus 5 on
array GSM40820 (Table 3). However, we know that from a
biological perspective, we would expect to see intensities far
higher than the negative control, and that intensities only
marginally higher result from low homology between the
probe and the sample. We can therefore use the statistical sig-
nificance (p value) in combination with our idea of biological
significance (the mean normalized log ratio) to successfully
call the correct result in over 98% of the arrays.
In the majority of cases there is a clear difference in the p
value, the mean normalized log ratio, or both, between the
correct hit and subsequent hits, allowing for both automatic
and manual detection of true and false positives. However,
this does require careful interpretation. Both DetectiV and E-
Predict predict multiple, significant matches on all of the
arrays. When using DetectiV, it is only when looking for major
changes between the top hit and subsequent hits, in terms of
p value or mean log ratio, that it is possible to separate the
true positives from the false positives. In many cases, using
automatic rules will result in the correct result; however,
there will inevitably be borderline cases where human inspec-
tion of the results is required. This is all the more important
when considering the possible economic impacts of a false
positive for certain species. At present, the safest way to
employ such arrays, and their analysis methods, may be sim-
ply as a first step towards identifying infectious agents,
informing researchers about which viruses they should test
for using more conventional methods.
The results from the application of DetectiV to the SARS data-
set are encouraging. Here, oligos designed to SARS were not
present on the array. However, using a simple NCBI blast
search, it was possible to extend the range of viruses covered
by the array to include SARS - 61 existing oligos showing sig-
nificant homology to the SARS genome. On application of
DetectiV to the updated data, SARS was the top hit. Not only
does this offer the promise of being able to extend the cover-
age of the array without adding further oligos, it also suggests
that it is possible to detect viruses without having any unique
oligos. This may inform the oligo selection process - it may be
equally desirable to have multiple, non-unique oligos to rep-
resent a species as it is to have a few that are unique.
The results from the application of DetectiV to a second data-
set are also encouraging, with the correct result being the top
hit in all 12 cases. Of particular interest is the ability of the
array, and DetectiV, to distinguish not only between separate
viral species, but also between different subtypes of FMDV. It
should be noted that in order to apply DetectiV to a second
dataset from a completely different array to the first dataset,
the user only has to change the GEO accession number and
the number of arrays within that dataset. This compares favo-
rably with E-Predict, which would require a separate training
dataset from the second array, the calculation of a large and
complex sequence similarity matrix and the optimization of
several parameters.
There are a number of ways in which DetectiV may be devel-
oped. In terms of visualization, better browsing capabilities of
the barplots would be desirable, perhaps using a web-inter-
face. In terms of the analysis, we may borrow ideas from gene
expression arrays. For example, limma uses an empirical
Bayes method to shrink each gene's standard error towards a
common value, and has been shown to perform better than
standard statistical methods [12]. It may be that we can apply
a similar method here to shrink the standard error for each
virus species towards a common value, thus increasing
sensitivity. It may also be possible to apply multiple-testing
procedures to the resulting p values. The Bonferroni correc-
tion may be appropriate, in which the p values are multiplied
by the number of comparisons, or a more conservative
approach may be needed, such as that suggested by Ben-
jamini and Hochberg [19], in order to control the false discov-
ery rate.
In conclusion, DetectiV is a highly accurate tool for the anal-
ysis of pathogen detection microarray data, offering simple
but powerful visualization, normalization and significance
testing functions. DetectiV performs better than previously
published software on a publicly available microarray data-
set. DetectiV is available as a package for R, a platform-inde-
pendent statistical software package, and requires little
configuration or customization. It is released under the GNU
General Public License and may be downloaded from the
DetectiV website [20].
R190.12 Genome Biology 2007, Volume 8, Issue 9, Article R190 Watson et al. />Genome Biology 2007, 8:R190
Abbreviations
DFA, direct fluorescent antibody; FMDV, foot-and-mouth
disease virus; GEO, Gene Expression Omnibus; IBV, infec-
tious bronchitis virus.
Authors' contributions
Michael Watson wrote and tested the DetectiV software. Jul-
iet Dukes and Abu-Bakr Abu-Median designed the visualiza-
tion styles in DetectiV, tested the software and produced the
data in GSE8746. Donald King and Paul Britton tested the
software and helped produce the data in GSE8746.
Additional data files
The following additional data are available with the online
version of this paper. Additional data file 1 is a table listing the
top hit for all 56 arrays using both the Detectiv and E-Pre-
dict.dist methods. DetectiV produced a correct result in 55
out of 56 arrays, and E-Predict produced a correct result in 53
out of 56 arrays.
Additional data file 1Top hit for all 56 arrays using both the Detectiv and E-Predict.dist methodsDetectiV produced a correct result in 55 out of 56 arrays, and E-Predict produced a correct result in 53 out of 56 arrays.Click here for file
Acknowledgements
This work was supported by the Department of Environment, Food and
Rural Affairs (DEFRA) project codes SE4102, SD0443, SE1120 and the Bio-
technology and Biological Sciences Research Council (BBSRC). Some of the
oligonucleotide probes were provided by Dr M Banks of Veterinary Labo-
ratories Agency (VLA).
References
1. Lapa S, Mikheev M, Shchelkunov S, Mikhailovich V, Sobolev A, Blinov
V, Babkin I, Guskov A, Sokunova E, Zasedatelev A, et al.: Species-
level identification of orthopoxviruses with an oligonucle-
otide microchip. J Clin Microbiol 2002, 40:753-757.
2. Boonham N, Walsh K, Smith P, Madagan K, Graham I, Barker I:
Detection of potato viruses using microarray technology:
towards a generic method for plant viral disease diagnosis. J
Virol Methods 2003, 108:181-187.
3. Song Y, Dai E, Wang J, Liu H, Zhai J, Chen C, Du Z, Guo Z, Yang R:
Genotyping of hepatitis B virus HBV by oligonucleotides
microarray. Mol Cell Probes 2006, 20:121-127.
4. Wang D, Urisman A, Liu YT, Springer M, Ksiazek TG, Erdman DD,
Mardis ER, Hickenbotham M, Magrini V, Eldred J, et al.: Viral discov-
ery and sequence recovery using DNA microarrays. PLoS Biol
2003, 1:E2.
5. Perrin A, Duracher D, Perret M, Cleuziat P, Mandrand B: A com-
bined oligonucleotide and protein microarray for the code-
tection of nucleic acids and antibodies associated with
human immunodeficiency virus, hepatitis B virus, and hepa-
titis C virus infections. Anal Biochem 2003, 322:148-155.
6. Sergeev N, Distler M, Courtney S, Al-Khaldi SF, Volokhov D,
Chizhikov V, Rasooly A: Multipathogen oligonucleotide micro-
array for environmental and biodefense applications. Biosens
Bioelectron 2004, 20:684-698.
7. Burton JE, Oshota OJ, North E, Hudson MJ, Polyanskaya N, Brehm J,
Lloyd G, Silman NJ: Development of a multi-pathogen oligonu-
cleotide microarray for detection of Bacillus anthracis. Mol
Cell Probes 2005, 19:349-357.
8. Lemarchand K, Masson L, Brousseau R: Molecular biology and
DNA microarray technology for microbial quality monitor-
ing of water. Crit Rev Microbiol 2004, 30:145-172.
9. Urisman A, Fischer KF, Chiu CY, Kistler AL, Beck S, Wang D, DeRisi
JL: E-Predict: a computational strategy for species identifica-
tion based on observed DNA microarray hybridization
patterns.
Genome Biol 2005, 69:R78.
10. The R Project for Statistical Computing [http://www.R-
project.org]
11. Gentleman RC, Carey VJ, Bates DM, Bolstad B, Dettling M, Dudoit S,
Ellis B, Gautier L, Ge Y, Gentry J, et al.: Bioconductor: open soft-
ware development for computational biology and
bioinformatics. Genome Biol 2004, 510:R80.
12. Smyth GK: Limma: linear models for microarray data. In Bio-
informatics and Computational Biology Solutions using R and Bioconductor
Edited by: Gentleman R, Carey V, Dudoit S, Irizarry R, Huber W.
New York: Springer; 2005.
13. Gautier L, Cope L, Bolstad BM, Irizarry RA: affy - analysis of
Affymetrix GeneChip data at the probe level. Bioinformatics
2004, 20:307-315.
14. Barrett T, Suzek TO, Troup DB, Wilhite SE, Ngau WC, Ledoux P,
Rudnev D, Lash AE, Fujibuchi W, Edgar R: NCBI GEO: mining mil-
lions of expression profiles - database and tools. Nucleic Acids
Res 2005, 33:D562-566.
15. Full Results from DetectiV for GSE2228 [ />table3.html]
16. Wheeler DL, Chappey C, Lash AE, Leipe DD, Madden TL, Schuler
GD, Tatusova TA, Rapp BA: Database resources of the National
Center for Biotechnology Information. Nucleic Acids Res 2000,
28:10-14.
17. Full Results from DetectiV for GSE8746 [ />VA1out.html]
18. Wang D, Coscoy L, Zylberberg M, Avila PC, Boushey HA, Ganem D,
DeRisi JL: Microarray-based detection and genotyping of viral
pathogens. Proc Natl Acad Sci USA 2002, 99:15687-15692.
19. Benjamini Y, Hochberg Y: Controlling the false discovery rate: a
practical and powerful approach to multiple testing. J Roy Stat
Soc B 1995, 57:289-300.
20. The DetectiV Website [ />