Báo cáo y học: "InSite: a computational method for identifying protein-protein interaction binding sites on a proteome-wide scale" pot
Bạn đang xem bản rút gọn của tài liệu. Xem và tải ngay bản đầy đủ của tài liệu tại đây (947.12 KB, 18 trang )
Genome Biology 2007, 8:R192
comment reviews reports deposited research refereed research interactions information
Open Access
2007Wanget al.Volume 8, Issue 9, Article R192
Method
InSite: a computational method for identifying protein-protein
interaction binding sites on a proteome-wide scale
Haidong Wang
*
, Eran Segal
†
, Asa Ben-Hur
‡
, Qian-Ru Li
§
, Marc Vidal
§
and
Daphne Koller
*
Addresses:
*
Computer Science Department, Stanford University, Serra Mall, Stanford, CA 94305, USA.
†
Department of Computer Science and
Applied Mathematics, Weizmann Institute of Science, Rehovot 76100, Israel.
‡
Computer Science Department, Colorado State University, South
Howes Street, Fort Collins, CO 80523, USA.
§
Center for Cancer Systems Biology (CCSB) and Department of Cancer Biology, Dana-Farber
Cancer Institute, and Department of Genetics, Harvard Medical School, Binney Street, Boston, MA 02115, USA.
Correspondence: Daphne Koller. Email:
© 2007 Wang et al.; licensee BioMed Central Ltd.
This is an open access article distributed under the terms of the Creative Commons Attribution License ( which
permits unrestricted use, distribution, and reproduction in any medium, provided the original work is properly cited.
Inferring protein-binding regions<p>InSite is a computational method that integrates high-throughput protein and sequence data to infer the specific binding regions of interacting protein pairs.</p>
Abstract
We propose InSite, a computational method that integrates high-throughput protein and sequence
data to infer the specific binding regions of interacting protein pairs. We compared our predictions
with binding sites in Protein Data Bank and found significantly more binding events occur at sites
we predicted. Several regions containing disease-causing mutations or cancer polymorphisms in
human are predicted to be binding for protein pairs related to the disease, which suggests novel
mechanistic hypotheses for several diseases.
Background
Much recent work focuses on generating proteome-wide pro-
tein-protein interaction maps for both model organisms and
human, using high-throughput biological assays, such as
affinity purification [1-4] and yeast two-hybrid [5-10]. How-
ever, even the highest-quality interaction map does not
directly reveal the mechanism by which two proteins interact.
Interactions between proteins arise from physical binding
between small regions on the surface of the proteins [11]. By
understanding the sites at which binding takes place, we can
obtain insights into the mechanisms by which different pro-
teins fulfill their roles. In particular, when mutations alter
amino acids in binding sites they can disrupt their interac-
tions, often changing the behavior of the corresponding path-
way and leading to a change in phenotype. This mechanism
has been associated with several human diseases [12]. Thus, a
detailed understanding of the binding sites at which an inter-
action takes place can provide both scientific insight into the
causes of human disease and a starting point for drug and
protein design.
We propose an automated method, called InSite (for Interac-
tion Site), for predicting the specific regions where protein-
protein interactions take place. InSite assumes no knowledge
of the three-dimensional protein structure, nor of the sites at
which binding occurs. It takes as input a library of conserved
sequence motifs [13,14], a heterogeneous data set of protein-
protein interactions, obtained from multiple assays
[2,4,9,10,15,16], and any available indirect evidence on pro-
tein-protein interactions and motif-motif interactions, such
as expression correlation, Gene Ontology (GO) annotation
[17], and domain fusion. It integrates these data sets in a prin-
cipled way and generates predictions in the form of 'Motif M
on protein A binds to protein B'. A key difference between
InSite and previous methods [18-20] is that InSite makes pre-
dictions at the level of individual protein pairs, in a way that
Published: 14 September 2007
Genome Biology 2007, 8:R192 (doi:10.1186/gb-2007-8-9-r192)
Received: 7 March 2007
Revised: 25 July 2007
Accepted: 14 September 2007
The electronic version of this article is the complete one and can be
found online at />R192.2 Genome Biology 2007, Volume 8, Issue 9, Article R192 Wang et al. />Genome Biology 2007, 8:R192
takes into consideration the various alternatives for explain-
ing the binding between this particular protein pair. By con-
trast, other methods predict affinities between motif types;
these predictions are independent of the proteins on which
the motifs occur. Thus, InSite may give the same motif pair
different binding confidences in the context of explaining dif-
ferent protein-protein interactions. To our knowledge, InSite
is the first method that does protein specific binding site pre-
dictions. This capability allows us to use InSite to understand
specific disease-causing mechanisms that may arise from a
mutation that disrupts a protein-protein interaction. InSite
also provides a novel framework for integrating evidence
from multiple assays, some of which are noisy and some of
which are indirect. Unlike other methods, our approach uses
all available evidence, and does not assume the existence of a
large data set of gold positives.
InSite is based on several key assumptions. The first is that
protein-protein interactions are induced by interactions
between pairs of high-affinity sites on the protein sequences.
Second, we assume that most binding sites are covered and
characterized by motifs or domains - conserved patterns on
protein sequences that recur in many proteins. (For simplic-
ity, we use the word 'motif' to refer to both motifs and
domains, except in cases where we wish to refer specifically to
domains.) Although an approximation, this assumption is
supported in the literature, as interaction sites tend to be
more conserved than the rest of the protein surface [21].
These motifs can correspond to any conserved pattern recur-
ring on protein sequences, whether short regions or entire
domains (Figure S1 in Additional data file 2). Finally, we
assume that the same motifs participate in mediating multi-
ple interactions. Therefore, we can study a motif's binding
affinity with other motifs by examining multiple protein-pro-
tein interactions that involve the motif.
InSite is structured in two phases. In the first phase, the algo-
rithm searches for a set of affinity parameters between pairs
of motif types that provides a good explanation of the interac-
tion data, roughly speaking: every pair of interacting proteins
contains a high-affinity motif pair; non-interacting proteins
do not contain such motif pairs; and motif pairs with support-
ing evidence, such as from domain fusion, should be more
likely to have high affinity. There may be multiple assign-
ments to the affinity parameters that explain the data well;
our method tends to select sparser explanations, where fewer
motif pairs have high affinity, thereby incorporating a natural
bias towards simplicity. A simple example of this phase is
illustrated in Figure 1; here, the observed interactions are best
explained via high affinity for the motif pair a,d, explaining
the interactions P
1
-P
3
and P
1
-P
4
, and high affinity for the pair
b,e, explaining the interactions P
1
-P
5
and P
2
-P
5
. By contrast,
the motif pair c,d is not as good an explanation, because the
motif pair also appears in the non-interacting protein pair P
3
,
P
5
. We note that the motif pair a,c is also a candidate hypoth-
esis, as it predicts the interactions P
1
-P
3
and P
1
-P
5
and does
not incorrectly predict any other interaction. However, it
leaves the interaction P
1
-P
4
unexplained, therefore leading to
a less parsimonious model that also contains the motif pair
a,d.
A set of estimated affinities provides us with a way of predict-
ing, for each pair of proteins, which motif pair is most likely
to have produced the binding. In the second phase, we use
this ability to produce specific hypotheses of the form 'Motif
M on protein A binds to protein B'. In a naïve approach, we
can simply take the most likely set of binding sites for the esti-
mated set of affinity parameters. However, in some cases,
there may be multiple models that are equally consistent with
our observed interaction pattern, but that give rise to differ-
ent binding predictions. In the second phase of InSite, we
therefore assess the confidence in each binding prediction by
'disallowing' the A
-
B binding at the predicted motif M, re-esti-
mating the affinities, and computing the overall score of the
resulting model (its ability to explain the observed interac-
tions). The reduction in score relative to our original model is
an estimate of our confidence in the prediction. This phase
serves two purposes: it increases the robustness of our predic-
tions to noise, and also reduces the confidence in cases where
there is an alternative explanation of the interaction using a
different motif. For example, in Figure 1, the prediction that
'motif d on P
4
binds to P
1
' has higher confidence, because d is
the only motif that can explain the interaction. Conversely,
the prediction that 'motif d on P
3
binds to P
1
' has lower
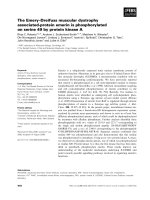
Example illustrating the intuition behind our approachFigure 1
Example illustrating the intuition behind our approach. In this simple
example, there are five proteins (elongated rectangles) with four
interactions between them (black lines); proteins contain occurrences of
sequence motifs (colored small elements within the protein rectangles).
Pairs of motifs on two proteins may bind to each other and hence mediate
a protein-protein interaction if they have high affinity. The observed
interactions are best explained via high affinity for the motif pair a,d,
explaining the interactions P
1
-P
3
and P
1
-P
4
, and high affinity for the pair b,e,
explaining the interactions P
1
-P
5
and P
2
-P
5
. We can now estimate the
confidence in a prediction 'P
i
binds to P
j
at motif M' by (computationally)
'disabling' the ability of M to mediate this interaction. For example, the
prediction that P
1
-P
4
bind at motif d has high confidence, because d is the
only motif that can explain the interaction. Conversely, the prediction that
P
1
-P
3
bind at motif d has lower confidence, because the motif pair a,c can
provide an alternative explanation to the interaction. The prediction that
P
2
-P
5
bind at motif e also has high confidence: although interaction via
binding at b,c would explain the interaction, making b,c a high-affinity motif
pair would contradict the fact that P
2
and P
3
do not interact.
Alternative
explanation if
. is forced
not to bind P1
P1 P2
P3
P4 P5
ab
cd
e
b
d
c
Genome Biology 2007, Volume 8, Issue 9, Article R192 Wang et al. R192.3
comment reviews reports refereed researchdeposited research interactions information
Genome Biology 2007, 8:R192
confidence, because the motif pair a,c can provide an alterna-
tive explanation to the interaction. The prediction that 'motif
e on P
5
binds to P
2
' also has high confidence; although inter-
action via binding at b,c would explain the interaction, mak-
ing b,c a high-affinity motif pair would contradict the fact that
P
2
and P
3
do not interact.
We provide a formal foundation for this type of intuitive argu-
ment within an automated procedure (Figure 2), based on the
principled framework of probability theory and Bayesian net-
works [22]. At a high level, the InSite model contains three
components, which are trained together to optimize a single
likelihood objective. The first component, inspired by the
work of Deng et al. [23] and Riley et al. [20], formalizes the
binding model described above, whereby motif pairs have
binding affinities, and an interaction between two protein
pairs is induced by binding at some pair of motifs in their
sequence. The second and third components, novel to our
approach, formulate the evidence models for protein-protein
interactions and motif-motif interactions, respectively. They
address both the noise in high-throughput assays [24,25],
and in the case of protein-protein interactions, the fact that
many of the relevant assays are based on affinity purification,
which detects protein complexes instead of the pairwise phys-
ical interactions that are the basis for inferring direct binding
sites. To integrate many assays coherently, InSite uses a naïve
Bayes model [24,26,27], where the assays are a 'noisy obser-
vation' of an underlying 'true interaction'.
Our entire model is trained using the expectation maximiza-
tion (EM) algorithm in a unified way (see Materials and meth-
ods; Figure S3 in Additional data file 2) to maximize the
overall probability of the observed protein-protein interac-
tions. This type of training differs significantly from most pre-
vious methods that aggregate multiple assays to produce a
unified estimate of protein-protein interactions. These meth-
ods [27,28] generally train the parameters of the unified
model using only a small set of 'gold positives', typically
obtained from the MIPS database [15]. This form of training
has the disadvantages of training the parameters on a rela-
tively small set of interactions, and also of potentially biasing
the learned parameters towards the type of interactions that
were tested in small-scale experiments. By contrast, the use of
the EM algorithm allows us to train the model using all of the
protein interactions in any data set, increasing the amount of
available data by orders of magnitude, and reducing the
potential for bias. The same EM algorithm also trains the
affinity parameters for the different motif pairs, so as to best
explain the observed protein-protein interactions.
These estimated affinities allow us to predict, for each pair of
proteins, which motif pair is most likely to have produced the
binding. In the second phase, we use these predictions, aug-
mented with a procedure aimed at estimating the confidence
in each such prediction, to produce specific hypotheses of the
form 'Motif M on protein A binds to protein B'. In this phase,
InSite modifies the model so as to enforce that binding
between A and B does not occur at motif M. We then compute
the loss in the likelihood of the data, and use it as our estimate
of the confidence in the binding hypothesis.
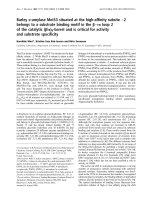
Overview of our automated procedureFigure 2
Overview of our automated procedure. Our automated procedure
(InSite), which has two main phases, takes as input protein sequences and
multiple pieces of evidence on protein-protein interactions and motif-
motif interactions. (a) Motifs, downloaded from Prosite or Pfam database,
were generated based on conservation in protein sequences. Protein-
protein interactions are obtained from a variety of assays, including: a small
set of 'reliable' interactions, which recurred in multiple experiments or
were verified in low-throughput experiments; a set of interactions from
yeast two-hybrid (Y2H) assays; and a set of interactions from the co-
affinity precipitation assays of Krogan et al. [4] and Gavin et al. [2]. (b) The
first phase (Figures S2 and S3 in Additional data file 2) uses a Bayesian
network to estimate both the motif pair binding affinities and the
parameters governing the evidence models of protein-protein interactions
(PPI) and motif-motif interactions (MMI), where the model is trained to
maximize the likelihood of the input data. Note that the affinity learnt in
this phase depends only on the type of motifs, regardless of which protein
pair they occur on. (c) In the second phase (Figure S4 in Additional data
file 2), we do a protein-specific binding site prediction based on the model
learned in the previous phase. For each protein pair, we compute the
confidence score for a motif to be the binding site between them. Note
that the confidence scores computed here are protein specific and can be
different for the same motif depending on the context it appears in.
Data processing
PS00237
PS50003
Model learning
(a)
Protein-protein interactions & non-interactons
Motifs (Prosite, Pfam)
Domain fusion, co-expression, Gene Ontology
Binding site prediction
Affinity between a pair of motif types θ (M1, M2)
Noisy
observation
models
(b)
(c)
Protein-specific confidence
score for binding site L(P1, M1, P2)
Protein
specific
Verification
(see results section)
PPI
MMI
Y2H Fusion
R192.4 Genome Biology 2007, Volume 8, Issue 9, Article R192 Wang et al. />Genome Biology 2007, 8:R192
As an initial validation of the InSite method, we first show
that it provides high-quality predictions of direct physical
binding for held-out protein interactions that were not used
in training. These integrated predictions, which utilize both
binding sites and multiple types of protein-protein interac-
tion data, provide high precision and higher coverage than
previous methods. As the primary validation of our approach,
we compare the specific binding site predictions made by
InSite to the co-crystallized protein pairs in the Protein Data
Bank (PDB) [29], whose structures are solved and thus bind-
ing sites can be inferred. In our results, 90.0% of the top 50
Pfam-A domains that are predicted to be binding sites are
indeed verified by PDB structures. InSite significantly out-
performs several state-of-the-art methods: in particular, only
82.0% of the top 50 predictions by Lee et al. [19] and 80.0%
of the top 50 predictions by Riley et al. [20] and of Guimaraes
et al. [18] are verified in PDB. We also examined the func-
tional ramifications of our predictions. If protein A interacts
with protein B via the motif M on A, a mutation at motif M
may have a significant effect on the interaction. If the interac-
tion is critical in some pathway, this mutation may result in a
deleterious phenotype, which may lead to disease [30]. We
applied InSite to human protein-protein interaction data, and
considered those predicted binding motifs M that contain a
mutation in the Online Mendelian Inheritance in Man
(OMIM) human disease database [31] or identified as a
potential driver mutation in the recent cancer polymorphism
data [32]. We then investigated the hypothesis that the muta-
tion at M leads to the disease by disrupting the binding of the
protein pair. A literature search validated many of these dis-
ease-related predictions, whereas others are unknown but
provide plausible hypotheses. Therefore, our predictions pro-
vide us with significant insights into the underlying mecha-
nism of the disease processes, which may help future study
and drug design.
We have made our predictions and our code publicly available
for download [33]. Our algorithm is general, and can be
applied to any organism, any protein-protein interaction data
set, and any type of motifs or domains.
Results
Overview
We applied InSite to data from both Saccharomyces cerevi-
siae and human. For S. cerevisiae, we compiled 4,200 relia-
ble protein-protein interactions as our gold standard and
108,924 observations of pairwise protein-protein interac-
tions from high-throughput yeast two-hybrid assays of Ito et
al. [10] and Uetz et al. [9] and assays of Gavin et al. [2] and
Krogan et al. [4] that identify complexes. We also computed
expression correlation and GO distance between every pair of
proteins, data that have been shown to be useful in predicting
protein-protein interactions [34]. Altogether, these measure-
ments involve 4,669 proteins and 82,399 protein pairs. We
also constructed a set of fairly reliable non-interactions as our
gold standard by selecting 20,000 random protein pairs [35],
and eliminating those pairs that appeared in any interaction
assay. In the case of human, we used two sets of training data
for our analysis. First, we focused on high-confidence pair-
wise interactions, all of which were modeled as gold positive
interactions. These interactions were obtained both from
high-quality yeast two-hybrid assays [6] and from the Human
Protein Reference Database (HPRD), a resource that contains
published protein-protein interactions manually curated
from the literature [36]. In the second case, we additionally
incorporated into our evidence model the yeast two-hybrid
interactions from Stelzl et al. [5] and the assay from Ewing et
al. [37] that identifies complexes. Overall, we obtained 12,411
protein interactions involving 2,926 proteins, and selected
18,745 random pairs as our gold non-interactions, as for
yeast.
The InSite method can be applied to any set of sequence
motifs. Different sets offer different trade-offs in terms of cov-
erage of binding sites; we can estimate this coverage by com-
paring residues covered by a particular set of motifs to
residues found to be binding sites in some interaction in PDB.
One option is Prosite motifs [14], where we excluded non-spe-
cific motifs, such as those involved in post-translational mod-
ification, which are short and match many proteins. These
motifs cover 9.6% of all residues in the protein sequences in
our dataset (Figure S1a in Additional data file 2). Of residues
that are found to be binding sites in PDB, 37.8% are covered
by these Prosite motifs. This enrichment is significant, but
many actual binding motifs are omitted in this analysis. An
alternative option is to use Pfam domains [38], which cover
73.9% of all the residues; however, PDB binding sites are not
enriched in Pfam (Figure S1b in Additional data file 2). Pfam-
A domains (Figure S1c in Additional data file 2), which are
accurate, human crafted multiple alignments, appear to pro-
vide a better compromise: PfamA domains contain only
38.1% of the residues in our dataset, but cover 70.3% of the
PDB binding sites. One regimen that seems to work best,
which is also used by Riley et al., is to train on all Pfam
domains (providing a larger training set) and to evaluate the
predictions only on the more reliable Pfam-A domains. For
each motif set, we used evidence from domain fusion and
whether two motifs share a common GO category as noisy
indicators for motif-motif interactions [39,40].
We experimented with different data sets and different motif
sets. In each case, we trained our algorithm on these data;
then, for each interacting protein pair, we compute the bind-
ing confidences for all their motifs, and generate a set of bind-
ing site predictions, which we rank in order of the computed
confidence.
Predicting physical interactions
The actual protein-protein interactions are mostly unob-
served in our probabilistic model. However, we can compute
the probability of interaction between two proteins based on
Genome Biology 2007, Volume 8, Issue 9, Article R192 Wang et al. R192.5
comment reviews reports refereed researchdeposited research interactions information
Genome Biology 2007, 8:R192
our learned model, which integrates evidence on protein-pro-
tein interactions and motif-motif interactions as well as the
motif composition of the proteins. As a preliminary valida-
tion, we first evaluated if InSite is able to identify direct phys-
ical interactions. We compare our results to those obtained by
using the confidence scores computed by Gavin et al. and
Krogan et al., which are derived from tandem affinity purifi-
cation (TAP) followed by mass spectrometry (MS) and quan-
tify the propensity of proteins to be in the same complex.
Using standard ten-fold cross-validation, we divided our gold
interactions and high-throughput interactions into ten sets;
for each of ten trials, we hid one set and trained on the
remaining nine sets together with our gold non-interactions.
We then computed the probability of physical interaction for
each protein pair in the hidden set, and ranked them accord-
ing to their predicted interaction probabilities. We defined a
predicted interaction to be true only if it appears in our gold
interactions, and false if it appears only in the high-through-
put interactions; we then counted the number of true and
false predictions in the top pairs, for different thresholds.
Although this evaluation may miss some true physical inter-
actions that appear in the high-throughput data set but not in
our gold set, it provides an unbiased estimate of our ability to
identify direct physical interactions. We separately per-
formed this procedure by ranking the interactions according
to the scores computed by Gavin et al. and by Krogan et al. We
also compared our model with a method that combines all
evidence on protein-protein interactions in a naïve Bayes
model where motifs are not used.
Our results (Figure 3a) show that InSite is better able to iden-
tify direct physical interactions within the top pairs. The area
under the receiver operating characteristic (ROC) curve are
0.855 and 0.916 for Prosite and Pfam, respectively, while it is
0.806 for the naïve Bayes model, which integrates different
evidence on protein-protein interactions without using any
motifs. This shows the motif based formulation is better able
to provide higher rankings to the reliable direct interactions
(Figure 3a). When comparing with Gavin et al.'s and Krogan
et al.'s scores, our model covers more positive interactions
because it integrates multiple assays. However, even if we
restrict it only to pairs appearing in a single assay, such as
Gavin et al.'s or Krogan et al.'s, InSite (Figure 3b,c) is able to
achieve better accuracy with either Prosite or Pfam. These
results illustrate the power of using both an integrated data
set and the information present in the sequence motifs in reli-
ably predicting protein-protein interactions. A list of all pro-
tein pairs ranked by their interaction probabilities estimated
by training on the full data set is available from our website.
Predicting binding sites
The key feature of InSite is its ability to predict not only that
two proteins interact directly, but also the specific region at
which they interact. As an example, we considered the RNA
polymerase II (Pol II) complex, which is responsible for all
mRNA synthesis in eukaryotes. Its three-dimensional struc-
ture is solved at 2.8 Å resolution [41], so that its internal
structure is well-characterized (Figure 4a,b), allowing for a
comparison of our predictions to the actual binding sites.
When using Pfam-A domains, the complex gives rise to 123
potential binding site predictions: one for each direct protein
interaction in the complex and each motif on each of the two
proteins. Among the 123 potential predictions, 68 (55.3%) are
actually binding according to the solved three-dimensional
structure. We ranked these 123 potential predictions based on
our computed binding confidences. All of the top 26 predic-
tions are actually binding (Figure 4d). As one detailed exam-
ple (Figure 4c), Rpb10 interacts with Rpb2 and Rpb3 through
its motif PF01194. We correctly predicted this motif as the
binding site for the two proteins (ranked third and fourth).
On the other hand, there are nine motifs on the two partner
proteins that could be the possible binding sites to Rpb10.
Among them, 4 are actually binding, and were all ranked
among the top half of the total 123 predictions, while the
other 5 non-binding motifs were ranked below the 100th with
low confidence scores. Overall, the six binding sites in this
example all have higher confidence scores than the five non-
binding sites.
We performed this type of binding site evaluation for all of the
co-crystallized protein pairs in PDB that also appeared in our
set of gold interactions. While the PDB data are scarce, they
provide the ultimate evaluation of our predictions. We
applied our method separately in two regimens. In the first,
we trained on Prosite motifs and evaluated on those motifs
that cover less than half of the protein length (Figure S5a in
Additional data file 2); we pruned the motif set in this way
because short motifs provide us with more information about
the binding site location. In the second regimen, we followed
the protocol of Riley et al., and trained on Pfam domains and
evaluated PDB binding sites on the more reliable Pfam-A
domains; we also tried to both train and evaluate on Pfam-A
domains but the result was worse in comparison to training
on all Pfam domains (data not shown).
Overall, the PDB co-crystallized structures contain 96 poten-
tial binding sites covered by Prosite motifs, of which 50
(52.1%) are verified as actually binding, and the remaining 46
are verified to be non-binding. Similarly, PDB contained 317
possible bindings between a Pfam-A domain and a protein, of
which 167 (52.7%) are verified in PDB. We ranked all possible
bindings according to their predicted binding confidences.
With Prosite motifs (Figure 5a), the area under the ROC curve
(AUC) is 0.68; note that random predictions are expected to
have an AUC of 0.5. For Pfam-A, when trained on all Pfam
domains, we achieved an AUC of 0.786 (Figure 5b).
We compared our results to those obtained by the DPEA
method of Riley et al. [20] the parsimony approach of Guima-
raes et al. [18], and an integrated approach of Lee et al. [19].
DPEA computes confidence scores between two motif types
by forcing them to be non-binding, and computing the change
R192.6 Genome Biology 2007, Volume 8, Issue 9, Article R192 Wang et al. />Genome Biology 2007, 8:R192
of likelihood after reconverging the model with this change.
InSite differs from DPEA in two main characteristics: its
confidence evaluation method, which is designed to evaluate
the likelihood of binding between two particular proteins at a
particular site; and the integration of multiple sources of
noisy data. Guimaraes et al. use linear programming to find
the confidence scores to a most parsimonious set of motif
pairs that explains the protein-protein interactions. Lee et al.
use the expected number of motif-motif interactions for a pair
of Pfam-A domain types across four species, and integrate
them with GO annotation and domain fusion to generate a
final ranking on pairs of motif types. Note that all these meth-
ods generate confidence scores on pairs of motif types,
regardless of what protein pairs they occur on. To use these
predictions for the task of estimating specific binding regions,
we define the confidence that motif M on protein A binds to
protein B as the maximum confidence score between motif
type M and all the motif types that appear on protein B. For
Guimaraes et al. and Lee et al., only the confidence scores
between Pfam-A domains are available so we only compared
their results with our Pfam-A predictions. We re-imple-
mented DPEA and compared the results with both our Prosite
and Pfam-A predictions. As we can see, in both Prosite and
Pfam evaluations (Figure 5), the AUC obtained by InSite are
the highest (0.786 and 0.680 for Pfam and Prosite, respec-
tively) while Lee et al. (0.745 for Pfam only) comes second
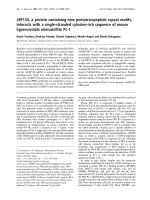
Verification of protein-protein interaction predictions relative to reliable interactionsFigure 3
Verification of protein-protein interaction predictions relative to reliable interactions. Protein pairs in the hidden set in a ten-fold cross validation are
ranked based on their predicted interaction probabilities (green, red, and black curves for Prosite, Pfam, and naïve Bayes, respectively). Each point
corresponds to a different threshold, giving rise to a different number of predicted interactions. The value on the X-axis is the number of pairs not in the
reliable interactions but predicted to interact. The value on the Y-axis is the number of reliable interactions that are predicted to interact. The blue and
mustard curves (as relevant) are for pairs ranked by Gavin et al.'s and Krogan et al.'s scores, respectively. (a) Predictions for all protein pairs in our data
set. As we can see, InSite with Pfam is better than InSite with Prosite, which is in turn better than the naïve Bayes model. All those three models integrate
multiple data sets and thus have higher coverage than other methods using a single assay alone. The cross and circle are the accuracies for interacting pairs
based on Ito et al.'s and Uetz et al.'s yeast two-hybrid assays, respectively. (b) Predictions only for pairs in Gavin et al.'s assay, providing a direct
comparison of our predicted probability with Gavin et al.'s confidence score on the same set of protein pairs. (c) Predictions only for pairs in Krogan et
al.'s assay, providing a direct comparison of our predicted probability with Krogan et al.'s confidence score on the same set of protein pairs.
0 2
,
000 4
,
000 6
,
000
0
200
400
600
800
Krogan
InSite Prosite
InSite Pfam
x 10
4
Area under ROC
1 2
3
4 5
6
0
200
400
600
800
1,000
Gavin
InSite Prosite
InSite Pfam
0.9
0.92
0.94
0.96
Ito
Uetz
Gavin
Krogan
Naïve Bayes
InSite Prosite
InSite Pfam
0.7
0.8
0.9
(a)
(b) (c)
True interactions in top pairs
4,000
3,000
2,000
1,000
0
True interactions in top pairs
Area under ROC
False interactions in top pairs
True interactions in top pairs
1,200
False interactions in top pairs
False interactions in top pairs
2
4
6
x 10
4
0
Genome Biology 2007, Volume 8, Issue 9, Article R192 Wang et al. R192.7
comment reviews reports refereed researchdeposited research interactions information
Genome Biology 2007, 8:R192
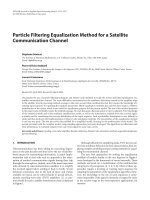
Binding site predictions within the Pol II complexFigure 4
Binding site predictions within the Pol II complex. (a) A schematic illustration of interactions within the Pol II complex revealed by its three-dimensional
structure. Each circle with number k corresponds to the protein 'Rpbk' (for example, Rpb1). (b) One of our top predictions is 'Pfam-A domain PF01096
on Rpb9 binds to Rpb1'. Both Rpb9 and Rpb1 are part of the co-crystallized Pol II complex in PDB (ID: 1I50). Rpb9 is shown as the light green chain with
the surface accessible area of the domain rendered in white; Rpb1 is shown as the light orange chain with its residues that are in contact with the domain
shown in orange, which verifies our prediction. (c) Binding site predictions for interactions involving Rpb10. A red arrow connects a motif to a protein it
binds to as revealed by its three-dimensional structure. A dashed black arrow represents a non-binding site. The numbers on the arrow are the ranks
based on our predicted binding confidences. We assigned confidence values to a total of 123 motif-protein pairs in this complex. In this case, all six PDB
verified binding sites (red arrows) are ranked among the top half, while all five non-binding sites have low confidence values with ranks below 100. (d)
ROC curve for our motif-protein binding sites predictions within the Pol II complex. There are 123 possible binding sites within the complex that involve
the Pfam-A domains in our dataset, out of which 68 (55.3%) are actually binding according to its three-dimensional structure. The possible binding sites are
ranked by our predicted binding confidences. The X-axis is the number of non-binding sites within the complex that are predicted to be binding. The Y-
axis is the number of PDB verified binding sites that are also predicted to be binding. The purple line is what we expect by chance.
0 1020304050
0
10
20
30
40
50
60
Random
InSite
3
10
11
2
8
12
1
5
6
9
Binding sites within the complex
(a)
Non-binding sites within the complex
(d)
(b)
Rpb10
3
4
60 101
2420
10061
2 3 4
5
6
7
1
Rpb3
102 103 107
PF01193
(c)
PF01194
PF01000
1
PF00562
2 3
PF04563 PF04560
4 5 6
PF04561 PF04565 PF04567
7
PF04566
Rpb2
R192.8 Genome Biology 2007, Volume 8, Issue 9, Article R192 Wang et al. />Genome Biology 2007, 8:R192
(Kolmogorov-Smirnov p value < 0.0002). InSite is able to
reduce the error rate (1 - AUC) by 16.2% compared with Lee
et al. For Pfam, the AUC values are 0.619 and 0.620 for Riley
et al. and Guimaraes et al., respectively. For Prosite, the AUC
value for Riley et al. is 0.601. Compared to these two meth-
ods, InSite achieves a significant error reduction of 43.7% and
19.8% for Pfam and Prosite, respectively.
If we consider the top 50 predictions made by Insite, 33
(66.0%) are correct for Prosite and 45 (90.0%) are correct for
Pfam-A. In comparison, only 52.1% and 52.7% are expected to
be correct using random predictions for Prosite and Pfam-A,
respectively. The enrichment of known binding sites in our
top predictions indicates that InSite is able to distinguish
actual binding sites from non-binding sites. In comparison,
the proportion of top 50 predictions verified are 82.0%
(Pfam-A) for Lee et al., 80.0% (Pfam-A) for Guimaraes et al.,
and 80.0% (Pfam-A) and 58.9% (Prosite) for Riley et al. Note
that, in the case of Pfam-A, Riley et al. predicted all top 24
pairs correctly because they are derived from the binding of
PF00227 (Proteasome) with itself. This motif pair has the
highest score and it appears in 24 binding events, all of which
are correctly verified by PDB. The lack of granularity (that is,
pairs mediated by the same motif types have the same score)
in Riley et al. helped in those top predictions, but hurt it in the
remaining predictions, thus resulting in overall lower
performance.
More generally, a pair of motif types may have multiple occur-
rences over different protein pairs (Figure S6 in Additional
data file 2). The previous methods [18-20] assign the same
confidence score to all of them. In order to demonstrate that
InSite is able to make different predictions even when both
motifs involved are the same, we ran InSite by forcing a pair
of motif occurrences between two proteins to be non-binding
and used its change of likelihood as a measure of how confi-
dent we are about whether these two motifs bind to each
other. As an example, transcription factor S-II (PF01096) and
RNA polymerase Rpb1 domain 4 (PF05000) are predicted to
be more likely to bind when occurring between Rpb9 and
Rpo31 than when occurring between Dst1 and Rpo21. This
happens because there are fewer motifs on Rpb9 than on Dst1
and the motifs on Rpo31 comprise a subset of motifs on
Rpo21. Although some alternative motif pairs between Rpb9
and Rpo31 have high affinity, overall they provide fewer alter-
native binding sites than those between Dst1 and Rpo21. Fur-
thermore, Rpb9 and Rpo31 are more likely to interact than
Dst1 and Rpo21. Therefore, our final confidence score com-
bines the affinity between the two motifs, the presence of
other motifs on the proteins, and the interaction probability
between the two proteins. Indeed, PDB verifies PF01096 and
PF05000 to bind between Rpb9 and Rpo31, but not between
Dst1 and Rpo21. The same reasoning applies to binding site
predictions between a motif and a protein.
Understanding disease-causing mutations in human
While a systematic validation is not possible in human, due to
the very low coverage of known protein-protein interactions
or binding sites, we performed an anecdotal evaluation that
focuses on interactions of particular interest for human
disease. Many genetic diseases in human have been mapped
to a single amino-acid mutation and cataloged in the OMIM
database [31]. The exact pathway that leads to the disease is
unknown for many of the mutations. As disrupting protein-
Global verification of binding site predictionsFigure 5
Global verification of binding site predictions. Verification of motif-protein
binding site predictions relative to solved PDB structures. Possible binding
sites are ranked based on our predicted binding confidences. The X-axis is
the number of sites that are non-binding in PDB that are predicted to be
binding. The Y-axis is the number of PDB verified binding sites that are
also predicted to be binding. The green and red curve are for our InSite
with Prosite and Pfam, respectively, which is tailored to binding site
prediction and explicitly models the noise in the different experimental
assays. The brown curve is for the DPEA score as in Riley et al. [20]. The
gray curve is for the score derived from the parsimony approach of
Guimaraes et al. [18]. The black curve is for the integrative approach by
Lee et al. [19]. The purple curve is what we expect from random
predictions. (a) Result using Prosite motifs. The area under the curve if we
normalize both axes to interval [0,1] are 0.680, 0.601, and 0.5 for InSite,
DPEA by Riley et al., and random prediction, respectively. (b) Result when
we train on Pfam domains and evaluate the PDB binding sites only on
Pfam-A domains, as in the protocol of Riley et al. The area under the curve
if we normalize both axes to interval [0,1] are 0.786, 0.745, 0.619, and
0.620 for InSite, integrative approach by Lee et al., DPEA by Riley et al.,
and parsimony approach by Guimaraes et al., respectively.
050
0
50
1
00
1
50
Parsimony
DPEA
Integrative
InSite
0 10 20 30
0
10
2
0
3
0
4
0
5
0
Random
DPEA
InSite
PDB non-binding sites
PDB binding sites
Motif-protein binding, Prosite
Area under ROC
0.5
0.6
0.7
0.5
0.6
0.7
0.8
Pfam
(a)
(b)
PDB binding sites
PDB non-binding sites
40
Area under ROC
100
150
Genome Biology 2007, Volume 8, Issue 9, Article R192 Wang et al. R192.9
comment reviews reports refereed researchdeposited research interactions information
Genome Biology 2007, 8:R192
protein interaction is one way by which a mutation causes
disease [30], our binding site predictions can suggest one
possible mechanism for such diseases: if a mutation in pro-
tein A occurs on a motif M that is predicted to be the binding
site to a protein B, and B is involved in pathways related to the
disease, it is likely that the mutation disrupts the binding and
thus leads to the disease. We ran InSite with two different
experimental setups: one using only reliable protein-protein
interactions, and the other using both reliable and high-
throughput protein-protein interactions. Table 1 lists our top
ten predictions from each experiment with relevant literature
references. As in yeast, we excluded those motifs that cover
more than half the length of the protein, so we focused on
short motifs that provide us with more information about the
binding site. Note that eight predictions are among the top
ten in both experiments, showing the robustness of our
method when applied to different protein-protein interaction
data. A full list of our predictions is available from our website
[33].
Some of our predictions are directly validated in the litera-
ture. One of the top ten predictions involves vitamin K-
dependent protein C precursor PROC, which is predicted to
bind to vitamin K-dependent protein S precursor PROS1.
There are four regions on PROC, a Gla domain, an EGF-like
domain 1, an EGF-like domain 2, and a serine proteases
domain. Prosite has ten motifs on the protein, covering these
four regions. InSite predicted two of the motifs (PS01187 and
PS50026), which correspond to EGF-like domain 1, to be the
binding site for PROS. Ohlin et al. [42] showed that antibody
binding to the region of the EGF-like domain 1 reduces the
anticoagulant activity of PROC, apparently by interfering
Table 1
Top binding site predictions in human
Protein Partner Binding site OMIM disease Pubmed
Using only reliable protein-protein interactions
PROC PROS1 PS01187 Protein C deficiency 1615482
PROC PROS1 PS50026 Protein C deficiency 1615482
BAX BCL2L1 PS01259 Leukemia 9531611
MMP2 BCAN PS00142 Winchester syndrome 10986281
STAT1 SRC PS50001 STAT1 deficiency 9344858
VAPB VAMP2 PS50202 Amyotrophic lateral sclerosis 9920726
VAPB VAMP1 PS50202 Amyotrophic lateral sclerosis 9920726
MMP2 BCAN PS00546 Multicentric osteolysis 10986281
PLAU PLAT PS50070 Alzheimer disease 7721771
UCHL1 S100A7 PS00140 Parkinson disease 12032852
Integrating high-throughput interactions
PROC PROS1 PS01187 Protein C deficiency 1615482
PROC PROS1 PS50026 Protein C deficiency 1615482
BAX BCL2L1 PS01259 Leukemia 9531611
MMP2 BCAN PS00142 Winchester syndrome 10986281
PTPN11 TIE1 PS50055 Noonan syndrome 1 10949653
VAPB VAMP2 PS50202 Amyotrophic lateral sclerosis 9920726
MMP2 BCAN PS00546 Multicentric osteolysis 10986281
EFNB1 SRC PS01299 Craniofrontonasal syndrome 8878483
PLAU PLAT PS50070 Alzheimer disease 7721771
UCHL1 S100A7 PS00140 Parkinson disease 12032852
We list the top 10 binding site predictions in human that contain disease causing mutations. The top part lists the predictions when using only
reliable protein-protein interactions. The bottom part lists the predictions when integrating high-throughput interactions. Eight predictions appear in
both panels, showing our method is robust to the change in the input data. Shown are the protein, its interacting partner, the motif that is predicted
to be the binding sites to its partner, the disease caused by the mutations inside the motif, and the Pubmed reference to the interaction. Three of top
predictions are verified by literature (in bold and italics), four in the top panel and three in the bottom panel are supported by existing evidence (in
bold), one in the top panel and two in the bottom panel are confirmed to be wrong (in italics), and the remaining two predictions do not have
literature information. In some cases, it is possible that the mutations at the binding site disrupt the interaction, and thus lead to the disease.
PS01187, calcium-binding EGF-like domain; PS50026, EGF-like domain; PS01259, BH3 motif; PS00142, metallopeptidase zinc-binding region;
PS50001, SH2 domain; PS50055, PTP type protein phosphatase; PS50202, major sperm protein (MSP) domain; PS00546, cysteine switch; PS01299,
ephrins signature; PS50070, Kringle domain; PS00140, ubiquitin carboxy-terminal hydrolase cysteine active-site.
R192.10 Genome Biology 2007, Volume 8, Issue 9, Article R192 Wang et al. />Genome Biology 2007, 8:R192
with the interaction between activated protein C and its cofac-
tor PROS1. Therefore, they propose the domain to be the
binding site on PROC with PROS, thus validating our predic-
tion. A mutation in the domain causes thromboembolic dis-
ease due to protein C deficiency [43], matching the fact that
defects in PROS1 are also associated with an increased risk of
thrombotic disease (Uniprot:P07225). These facts support a
hypothesis in which the mutation on PROC leads to the dis-
ease by disrupting the interaction with PROS1.
Another of our highest-confidence binding site predictions is
'the BH3 motif on BAX binds to BCL2L1' (Figure 6). BCL2 has
an inhibitory effect on programmed cell death (anti-apop-
totic) [44] while BAX is a tumor suppressor that promotes
apoptosis. Approximately 21% of lines of human hematopoi-
etic malignancies possessed mutations in BAX, perhaps most
commonly in the acute lymphoblastic leukemia subset [45].
There are four motifs on BAX (Figure 6) and we predict BH3
to be the binding site to BCL2 with high confidence (top
1.9%). By searching the literature, we found that Zha et al.
[46] showed that the BH3 motif on BAX is involved in binding
with BCL2, thus validating our binding site prediction. How-
ever, BH3 is also required for homo-oligomerization of BAX,
which is necessary for the apoptotic function [47]; thus, the
BH3 mutation may cause the disease by disrupting the BAX
homo-oligemorization. From the BCL2 side, the associated
binding site involves the portion where three motifs - BH1,
BH2, and BH3 - reside [48]. If we examine the InSite binding
site predictions on BCL2, none of the motifs is predicted to
have high confidence, with the best one, BH3, ranked at the
8.7th percentile. Therefore, InSite has the flexibility to predict
the binding site in one direction, but not the other direction.
Some of our predictions (Table 1) are not directly verified but
are consistent with existing literature evidence, and provide
biologists with testable hypotheses for possible further inves-
tigation. As one example, a mutation at codon 404 in MMP2
causes Winchester syndrome [43]. However, it is not well
understood how diminished MMP2 activity leads to the
changes observed in the disease [49]. InSite predicted the
zinc-binding peptidase region on MMP2, which contains
codon 404, to be the binding site to BCAN. As BCAN is
degraded by MMP2 [50], the peptidase region we predicted is
likely to be the binding site that catalyzes the degradation of
BCAN. Codon 404 is believed to be essential for the peptidase
activity [43], consistent with our hypothesis that its mutation
might disrupt the interaction between MMP2 to BCAN. Our
binding site prediction provides one possible hypothesis that
implicates BCAN in the process of pathogenesis.
We also listed all top predictions are that are confirmed to be
wrong (Table 1). In one case, the prediction involves the
Ephrins signature, which is an example of a 'signature motif'.
Such motifs represent the most conserved region of a protein
family or a longer domain, and are used by Prosite to conven-
iently identify the longer domain. InSite cannot distinguish
the behavior of the signature from the domain. Therefore,
when the signature motif is predicted to be the binding site,
the actual binding could take place in the longer domain. In
the case of the Ephrins signature, Prosite uses the motif to
identify the Ephrins protein family. Therefore, we would not
generally expect a binding site to overlap the motif.
In a similar validation to our OMIM analysis, we considered a
recent data set by Greenman et al. [32] produced by screening
protein kinases for mutations associated with cancer.
However, in many cases, it is unknown whether a mutation is
a driver mutation that causes the cancer, or whether it is a
passenger mutation that occurs by chance in the cancer cell.
Even for driver mutations, the mechanism by which it leads to
cancer is often unknown. We considered those mutations that
fall in InSite predicted binding sites. Among all the potential
driver mutations identified by Greenman et al., the one most
likely to be a binding site according to the InSite predictions
is the SH2 domain of FYN in the SRC family (Figure 7), which
is predicted to bind to proto-oncogene vav (VAV1). Greenman
et al. found three mutations on FYN and predicted with 0.985
probability that at least one of them is a driver mutation [32].
This finding suggests the hypothesis that the mutation dis-
rupts the binding of SH2 domain to VAV1, and thus causes
cancer. Indeed, a literature search shows that the SH2
domain on FYN is known to bind to VAV1 [51], thereby vali-
dating our binding site prediction. Moreover, VAV1 was dis-
covered when DNA from five esophageal carcinomas were
tested for their transforming activity [52], which is compati-
ble with the fact that FYN is implicated in squamous cell
carcinoma [32]. These observations support the disruption of
the FYN-VAV1 binding as the cause for the disease in this
case.
Illustration of human binding site predictionsFigure 6
Illustration of human binding site predictions. Schematic representation of
our top prediction and its validati\on by the literature. BAX has four
motifs: BH3 motif (PS01259), BH1 (PS01080), BH2 (PS01258), and BCL2-
like apoptosis inhibitor family profile (PS50062). BH3 (in red) has the
highest change in log-likelihood among those motifs, and is among one of
our top predictions (1.9%). Reed et al. [48] confirmed that BH3 on BAX is
involved in binding with BCL2. On the other hand, the binding site on
BCL2 involves portions where all of BH1, BH2, and BH3 reside.
Interestingly, none of these motifs on BCL2L1 have high confidence to be
a binding site, with the highest one also being BH3 and ranked in the top
8.7%. Mutations in BAX (in position shown by the black bar) cause
leukemia.
PS01259 (BH3) PS01080
BAX: BCL2-associated X protein
Top 1.9%
BCL2L1: BCL2-like 1 protein
PS01258
PS50062
8.7%
PS01259 (BH3)
Genome Biology 2007, Volume 8, Issue 9, Article R192 Wang et al. R192.11
comment reviews reports refereed researchdeposited research interactions information
Genome Biology 2007, 8:R192
Discussion
Obtaining computational models for the mechanism of pro-
tein-protein interactions is an important but challenging
task. Other computational methods for discovering protein-
protein interaction sites fall into two broad categories. The
first are docking methods that try to match two protein struc-
tures to find the best sites on both structures [53]. These
methods apply only to solved protein structures, which are
currently available only for a small number of proteins. To
enlarge the set of applicable proteins, some methods [54-57]
use homology to proteins with known structures, but many
proteins do not, as yet, have any homologues with solved
structure, necessitating the use of other techniques. The sec-
ond class of method uses local sequence information to pre-
dict interaction sites [58,59]. These methods typically train a
machine learning algorithm (such as a neural network) to
identify interaction sites, and, therefore, require solved com-
plexes to provide examples of interaction sites as training
data. As such, examples are relatively scarce, the available
data might not sufficiently capture the sequence variability
found in interaction sites, which can lead these methods to
have low sensitivity. Our approach uses only the widely avail-
able sequence information and raw protein-protein interac-
tion data, and, therefore, offers the promise of identifying
binding sites on a genome-wide scale.
Our approach is most similar to previous work that tries to
predict motif-motif or domain-domain interactions. Some of
this work focused on best explaining the observed protein-
protein interactions [20,23,60-62]. Whereas other methods
aim to compute the general affinity between two motif 'types',
InSite also explicitly computes the confidence that a specific
motif occurrence mediates the binding of a specific interact-
ing protein pair. These finer-grained predictions allow us to
identify the specific mechanism for their interaction, whereas
other methods that make predictions by looking only at motif
types would not be as appropriate for this purpose. For exam-
ple, the DPEA method by Riley et al. [20] computes confi-
dence by forcing two motif types to have affinity 0. In
contrast, InSite aims to compute predictions for a specific
motif occurrence on an interacting protein pair, and thus
forces a particular motif occurrence on a particular protein to
be non-binding to another protein. The more global perturba-
tion used by Riley et al. would not be as appropriate for this
purpose: It may well be the case that a good alternative bind-
ing hypothesis exists for the interaction at a particular protein
pair, but disallowing all interactions between a pair of motif
types causes significant reduction to the likelihood in other
protein pairs. Indeed, our method outperforms DPEA, and
other state-of-the-art methods like the parsimony approach
by Guimaraes et al. [18] and the integrative approach by Lee
et al. [19], at identifying binding regions between an interact-
ing protein pair. Other work [18,19,63,64] infers motif-motif
interaction using other types of information, such as co-evo-
lution; this method is shown [64] to generate predictions that
have little overlap with DPEA-style methods, and thus can be
combined with InSite to gain wider coverage.
InSite is able to integrate different sources of assays in a prin-
cipled way and learn a different observation model for each
assay. It explicitly models the noise from high-throughput
assays and the possibility that two proteins in the same com-
plex do not physically interact. This allows us to use the noisy
data as well as assays aimed at identifying complexes, so our
interaction data set is much bigger than any that have been
used before, providing both higher coverage and increased
robustness. Our data integration method is unique in not uti-
lizing a 'gold standard' set of interactions (such as ones
obtained from low-throughput experiments) for training,
thereby greatly increasing the size of the training set and
avoiding possible biases in it. InSite also easily accommo-
Three-dimensional structure of one of our top predictionsFigure 7
Three-dimensional structure of one of our top predictions. A fragment of
FYN with SH2 and SH3 domain is crystallized in PDB (ID: 1G83) and is
visualized here. The fragment accounts for about 30% of the total protein
length and is rendered in a ribbon representation. The SH2 domain, which
is colored in green, is predicted to be the binding site for VAV1. The
position of the potential driver mutation found in somatic cancer cells is
highlighted by the white balls.
R192.12 Genome Biology 2007, Volume 8, Issue 9, Article R192 Wang et al. />Genome Biology 2007, 8:R192
dates other types of indirect evidence, such as co-expression,
GO annotation, and domain fusion, on both protein-protein
interactions and motif-motif interactions. This type of inte-
gration may be useful in other settings as well. We note that
the evidence model, although an important component in our
approach, is not the main factor in its performance. Indeed, if
we remove the indirect evidence like co-expression, GO anno-
tation, and domain fusion from our model, the AUC value
decreases by only 0.033 and 0.019 for Pfam and Prosite,
respectively (Figure S7 in Additional data file 2). Therefore,
our result using protein-protein interactions alone is still sig-
nificantly better than the methods of Guimaraes et al. and
Riley et al., which also only rely on protein-protein interac-
tion, and it beats Lee et al., which uses multiple types of data,
including indirect evidence. On the other hand, if we add our
evidence model onto the model of Riley et al., the AUC values
increase by only 0.017 and 0.009 for Pfam and Prosite,
respectively. Therefore, the main component in the perform-
ance of our model is the construction of predictions that are
targeted at specific protein pairs and take their particular
context into account.
There are several limitations to the ability of our approach to
identify correct binding sites. Not all motifs mediate protein
interactions through direct binding. Some motifs help shape
the structure of proteins. Mutations in the motifs would alter
the structure of the protein and disrupt binding at some other
places. Other motifs are signatures that are markers for
longer domains. It is the longer domain, and not the signature
motif, that serves as the actual binding site. InSite will not be
able to distinguish these cases. One approach would be to
classify motifs into either structural or binding motifs by
using partially supervised learning with labeled binding sites
from PDB or prior biological knowledge. A motif may appear
multiple times in a protein, but InSite is unable to distinguish
between them, and, therefore, cannot predict which copy is
the actual binding site. Most importantly, some binding sites
may not be covered by any motif in our set of conserved
motifs (Figure S1,5b in Additional data file 2), and thus our
current model has no way to predict interactions involving
them. Clearly, we can apply InSite to a larger set of motifs, for
example, eMotifs [65,66], but there may still be motifs that
cannot be identified by conservation. Thus, the most signifi-
cant extension of our method would be to allow it to search for
a motif in cases where there is no pre-existing motif that pro-
vides a good explanation for the observed interactions. One
possible approach may be an integration of InSite with
approaches that use sequence to predict binding sites directly
[58,59].
Conclusion
There has been steady growth in the past few years in the suite
of methods that successfully utilize large amounts of available
data and sophisticated machine learning methods to solve
problems in structural biology for which experimental meth-
ods are difficult and time-consuming. These tasks include
protein structure prediction [67], RNA structure prediction
[68,69], side-chain prediction [70], protein surface predic-
tion, and more. Following in this tradition, we have developed
InSite, a novel probabilistic method for predicting regions at
which two interacting proteins bind to each other. InSite
makes use of three types of data sets: direct protein-protein
interaction assays; indirect evidence on protein-protein inter-
actions, such as co-exression; and indirect evidence on motif-
motif interactions, such as domain fusion. It provides a prin-
cipled integration of these data sets, which may be noisy, and
may not correspond to direct physical interaction. In future
work, the flexibility of the framework would allow us to easily
extend it to include more types of information, including
structural information. For example, we can use motif-motif
binding in PDB to construct a more informed model of the
prior distribution for the motif-motif affinity.
InSite makes targeted, testable predictions for specific bind-
ing regions in an interacting protein pair. As we have shown,
these predictions can be used to generate hypotheses regard-
ing the mechanism by which certain mutations in a protein
can disrupt interactions, and give rise to phenotypic changes,
including human disease such as cancer. We put all predic-
tions with cancer annotations or OMIM mutations online,
allowing for a more comprehensive analysis by experts and
follow-on wet-lab experiments. We have also made the InSite
software publicly available via the web to allow this tool to be
used by researchers. Due to the universal mechanisms under-
lying biochemical interactions, the tool can be applied to any
organism, and even to protein-protein interaction data gener-
ated from multiple organisms.
Materials and methods
Sources of data
Sccharomyces cerevisiae
We constructed 'observed interaction' variables for each of
the assays, as follows. For the yeast two-hybrid datasets of
[9,10], these variables are binary-valued. They take the value
'true' if the pair is observed to interact in the assay, and the
value 'false' if both of the two proteins appeared in the assay
but the pair was not observed to interact. However, as the
number of unobserved interactions grows quadratically in the
number of proteins assayed, this procedure would result in
too many non-interacting pairs; we therefore keep only those
pairs that appeared in some other high-throughput dataset,
to allow evidence integration. For the co-AP assays, we
selected the interactions with confidence scores above 0.2
from [4] and all interactions from [2], using their confidence
scores as continuous observation values. We constructed a
'gold standard' set of S. cerevisiae protein-protein interac-
tions from MIPS [15] and DIP [16], downloaded on 21 March
2006. We extracted from MIPS those physical interactions
that are non-high-throughput yeast two-hybrid or affinity
chromatography. For DIP, we picked non-genetic interac-
Genome Biology 2007, Volume 8, Issue 9, Article R192 Wang et al. R192.13
comment reviews reports refereed researchdeposited research interactions information
Genome Biology 2007, 8:R192
tions that are derived from small-scale experiments or veri-
fied by multiple experiments. We use this set of reliable
interactions as 'gold standard' interactions in our model. For
'gold standard' non-interactions, we picked 20,000 random
pairs [35] and removed those that appear in any interaction
assays. For these gold standard pairs, we fixed the value of the
'actual interaction' variable accordingly. In all other protein
pairs, we leave the actual interaction variables as unobserved.
This procedure results in a dataset of 101,065 protein pairs, of
which 4,200 were gold standard interactions and 18,666 gold
standard non-interactions, and a total of 108,924 observa-
tions (Figure S8 in Additional data file 2).
We computed expression correlation using a compendium of
time series data obtained in different environmental condi-
tions [71-79]. The compendium has 76 different conditions
with a total of 403 time points. For each pair of proteins, we
computed the Pearson correlation coefficient across all the
time points. We also annotated our proteins with biological
processes from GO. For each pair of proteins, we computed
the GO distance as the log size of the smallest common cate-
gory shared by the two proteins. The smaller the value, the
more specific category the two proteins belong to, and thus
they are more likely to interact [34].
In one run, we used sequence motifs from the Prosite data-
base [14] excluding the non-specific motifs, mostly post-
translational modification motifs that appear across many
proteins. We removed motifs that are annotated as 'Composi-
tionally biased' or 'DNA or RNA associated'. This gave us 708
different types of motifs with a total of 2,808 motif occur-
rences. In another run, we used sequence motifs from the
Pfam domain database [38], which resulted in 8,089 differ-
ent types of domains with a total of 11,767 domain
occurrences.
We construct a 'domain fusion' variable for each pair of
Prosite motifs or Pfam domains. Its value is 1 if the two motifs
ever co-occur on the same protein in any species. Its value is
0 otherwise. Note that we use the term 'domain fusion' here,
although it can also refer to motifs. We also looked at whether
the two motifs appear together in any biological process cate-
gory based on the mapping table from Pfam to GO [17]. If they
do, we assign the 'shared GO' variable to be 1 and we assign it
to be 0 otherwise.
Human
We used a high confidence yeast two-hybrid assay [6] and
HPRD, a resource that contains known protein-protein inter-
actions manually curated from the literature by expert biolo-
gists [36] (downloaded on 24 January 2006). The union of
these data sets gave us 6,688 reliable interactions. We also
used yeast two-hybrid assay from Stelzl et al. [5] and an assay
that identified co-complex proteins [37] with its confidence
score as our observation value. This gave us 5,723 observa-
tions. As in yeast, we picked 20,000 random pairs as our gold
non-interactions [35] and removed those that appear in any
interaction assays. We used the same Prosite motifs, which
gave us 687 different types of motifs with a total of 3,034
motif occurrences.
Learning procedure
Probabilistic model
Our probabilistic model has three components. The first (Fig-
ure S2 in Additional data file 2, black box) formalizes the
binding model described above: for each protein pair in our
model, and each pair of motifs on the two proteins, we have a
variable indicating whether binding took place at this motif
pair. The prior probability that a specific motif pair binds is
the affinity of the corresponding motif types. The overall
interaction of the proteins is a disjunction of these binding
events, and of an additional 'spurious binding' variable that
accounts both for noise in some interaction data sets and for
binding outside of motifs in our database. The second compo-
nent of our model (Figure S2 in Additional data file 2, red
box) addresses the problem that very few protein interactions
are known with certainty. Yeast two-hybrid assays can be
noisy [24,25], with a non-trivial fraction of both false posi-
tives and false negatives, while affinity purification detects
protein complexes instead of the pairwise physical interac-
tions that are the basis for inferring direct binding sites.
Moreover, indirect evidence such as co-expression, though
useful, only weakly correlates with the actual interactions.
Therefore, to integrate many assays coherently, we use a
naïve Bayes model [24,26,27]. In this model, we have an
'interaction variable' for each protein pair, whose value is
'true' only when the pair actually interacts. This variable is
unobserved in most cases, but serves to aggregate informa-
tion from a set of partial and noisy assays, which are viewed
as 'noisy sensors' for the interaction variable. The quantita-
tive dependencies of these sensors are modeled differently for
different assays, to allow for variations in false positive and
false negative rate [25,80], and for confidence scores accom-
panying certain assays [2,4]. There may be multiple observa-
tion variables attached to a protein pair, whose interaction
probability summarizes the signal from all the assays and is
used to learn the binding affinity. The third component of our
model (Figure S2 in Additional data file 2, blue box) takes into
consideration the noisy evidence on motif-motif interactions.
A binding variable between two motifs may have multiple
pieces of evidence, all of which serve as noisy sensors for the
binding variable and are integrated using a naïve Bayes model
in the same way as in the second component.
More formally, each interacting or non-interacting pair of
proteins P
i
, P
j
is described by an entity T
ij
. A pair of motifs in
two proteins can potentially 'bind' and induce an interaction
between the corresponding proteins. We encode this assump-
tion by introducing a variable T
ij
.B
ab
for each pair of motifs a
in P
i
and b in P
j
, which represents whether the pair of motif
occurrences actually binds. The probability that they bind
R192.14 Genome Biology 2007, Volume 8, Issue 9, Article R192 Wang et al. />Genome Biology 2007, 8:R192
depends on the 'affinity' between the motifs. Therefore, we
define:
P(T
ij
.B
ab
= true) =
θ
ab
and
P(T
ij
.B
ab
= false) = 1 -
θ
ab
where
θ
ab
is the affinity between motifs a and b. Note that this
affinity is a feature of the motif pair and does not depend on
the proteins in which they appear. We place a Dirichlet prior
distribution over the value of
θ
ab
, which is the same for
θ
across all motif pairs. We must also account for interactions
that are not explained by our set of motifs, such as the binding
between amino acids not included in our motif set. Thus, we
add a 'spurious binding' variable T
ij
.S. The probability that
spurious binding occurs is given by:
P(T
ij
.S = true) =
θ
s
(m) = 1 - (1-
θ
s
)
m
where m is proportional to the average (geometrical) number
of amino acids not covered by any motif in the two proteins.
It represents the fact that the more amino acids we have out-
side the motif set, the more likely the interaction is induced by
something other than binding between motifs. Two proteins
interact if and only if some form of binding occurs, whether by
a motif pair or by spurious binding. Thus, we define a variable
T
ij
.I, which represents whether protein P
i
interacts with pro-
tein P
j
, to be a deterministic OR of all the binding variables
T
ij
.S and T
ij
.B
ab
. We note that Riley et al. did not include a
spurious interaction variable in their model, but rather used
0.001, regardless of the protein length, as the probability of
interaction when there is no motif pair between two proteins.
To account for the fact that our experimental assays are not
direct and reliable measurements of physical protein-protein
interactions, we define the observation variables T
ij
.O to be
the interactions observed in the experimental assays and
indirect evidence like co-expression and GO distance, which
are noisy sensors for the actual interaction variable T
ij
.I. Note
that an actual interaction variable may have several observa-
tion variables if the pair appears in multiple assays. For those
assays with binary observations, T
ij
.O
n
is a binary variable and
the probability it is 'true' depends on T
ij
.I and the type of
assay. Therefore, we can account for the different false posi-
tive and false negative rates in different assays. For Gavin et
al., we assume the confidence score T
ij
.O
g
to be Gaussian dis-
tributions, whose mean and variance depends on the T
ij
.I. For
Krogan et al., we assume the confidence score T
ij
.O
k
has a uni-
form distribution if T
ij
.I is false (non-interacting) and has an
exponential distribution if T
ij
.I is true (interacting). For co-
expression, we assume the Pearson correlation coefficient
T
ij
.O
e
to be Gaussian distributions, whose mean and variance
depends on the T
ij
.I. For GO distance, we assume its value
T
ij
.O
o
to be an exponential distribution when T
ij
.I is false and
a mixture of Gaussian and uniform distribution when T
ij
.I is
true (interacting). In the case of human confidence score
T
ij
.O
w
from Ewing et al. [37], we use a mixture of Gaussian
and indicator functions with different parameters depending
on the value of T
ij
.I. Note that each parametric form was
selected by examining the empirical distribution and assess-
ing what model would fit it well.
We use R
ab
to describe a pair of motif a and motif b. We intro-
duce a variable R
ab
.E
g
to represent whether they share the
same GO biological process category and another variable
R
ab.
E
f
for whether they appear together in a domain fusion
event. Both variables are probabilistically dependent on the
binding variable T
ij
.B
ab
and serve as its noisy sensors. Note
that R
ab
is the same regardless of which protein pair T
ij
it
appears in. We use different models for domain fusion and
GO distance to account for their different correlation with the
actual motif-motif interactions. Note that parameters of the
evidence models for protein-protein interactions and motif-
motif interactions are all learned from the data. Some of the
learned values are illustrated in Figure S2 in Additional data
file 2.
An instantiation of our probabilistic model is illustrated in
Figure S2 in Additional data file 2 and the conditional proba-
bilities involved are summarized below:
P(T
ij
.B
ab
= true |
θ
ab
= x) = x
P(T
ij
.S = true |
θ
s
= x) =
θ
s
(m) = 1 - (1 - x)
m
T
ij
.I = OR(T
ij
.B,T
ij
,S)
P(T
ij
.O
n
| T
ij
.I) =
ρ
n
(T
ij
.I)
P(T
ij
.O
g
| T
ij
.I = false) = N(
μ
g0
,
σ
g0
2
)
P(T
ij
.O
g
| T
ij
.I = true) = N(
μ
g1
,
σ
g1
2
)
P(T
ij
.O
k
| T
ij
.I = false) = 1
P(T
ij
.O
k
| T
ij
.I = true) =
λ
k
exp(-
λ
k
(1 - T
ij
.O
k
))
P(T
ij
.O
e
| T
ij
.I = false) = N(
μ
e0
,
σ
e0
2
)
P(T
ij
.O
e
| T
ij
.I = true) = N(
μ
e1
,
σ
e1
2
)
P(T
ij
.O
o
| T
ij
.I = false) =
λ
o
exp(-
λ
o
(8.68 - T
ij
.O
o
))
P(T
ij
.O
o
| T
ij
.I = true) = w
o1
N(
μ
o1
,
σ
o1
2
) + w
o2
U(7,8.68)
P(T
ij
.O
w
| T
ij
.I = false) = w
w1
N(
μ
w0
,
σ
w0
2
) + w
w2
I(T
ij
.O
w
= 0)
+ w
w3
I(T
ij
.O
w
= NA)
PxPx
B
xx
ab s
()()
(, )
()
θ
== == −
−−
θ
αβ
αβ
1
1
11
Genome Biology 2007, Volume 8, Issue 9, Article R192 Wang et al. R192.15
comment reviews reports refereed researchdeposited research interactions information
Genome Biology 2007, 8:R192
P(T
ij
.O
w
| T
ij
.I = true) = w
w4
N(
μ
w1
,
σ
w1
2
) + w
w5
I(T
ij
.O
w
= 0) +
w
w6
I(T
ij
.O
w
= NA)
P(R
ab
.E
g
| T
ij
.B
ab
) =
σ
g
(T
ij
.B
ab
)
P(R
ab
.E
f
| T
ij
.B
ab
) =
σ
f
(T
ij
.B
ab
)
P(T
ij
.E | T
ij
.B
ab
) = P(R
ab
.E
g
| T
ij
.B
ab
)P(R
ab
.E
f
| T
ij
.B
ab
)
where
α
,
β
are the hyper-parameters in the Dirichlet distribu-
tion, 8.68 is the maximum value of the GO distance, n enu-
merates the different type of yeast two-hybrid assays, O
g
is
Gavin et al.'s assay, O
k
is Krogan et al.'s assay, O
e
is co-expres-
sion, O
o
is GO distance, O
w
is Ewing's confidence score, E
g
is
shared GO motif function, E
f
is domain fusion, U() is uniform
distribution, and I() is indicator function. The observation
parameter vector
η
is the union of
η
n
,
μ
,
σ
, w,
λ
,
ρ
,
σ
.
Learning
The model defines a joint probability over the entire set of
attributes, which is the product of all local conditional proba-
bility models shown above. Our learning objective is to find
affinities between motifs
θ
, probability of spurious binding
θ
s
,
and the parameters for the observation models
η
, which max-
imize the probability over observed evidence on protein-pro-
tein interactions T.O, the partial assignment to the actual
interactions T.I, and the observed evidence on motif-motif
interactions R.E. Our algorithm uses an iterative procedure
based on the EM algorithm to find the local maximum. In the
E-step, we compute the conditional probabilities for the bind-
ing variables T.B., T.S., and the actual interaction variables
T.I, given
θ
,
θ
s
,
η
, T.O, R.E, and use those as the soft assign-
ments to the variables. Define:
to be the binding probability given the evidence on motif-
motif interactions, where:
P(R
ab
.E) = P(T
ij
.B
ab
= true)P(R
ab
.E|T
ij
.B
ab
= true) + (1 -
P(T
ij
.B
ab
= true))P(R
ab
.E|T
ij
.B
ab
= false)
By Bayes' rule, we have:
where
P(T
ij
.O) = P(T
ij
.I = true)P(T
ij
.O|T
ij
.I = true) + (1 - P(T
ij
.I =
true))P(T
ij
.O|T
ij
.I = false).
In the M-step, we compute relevant expected sufficient statis-
tics using the computed soft marginal probabilities as soft
assignments. We use maximum likelihood estimation to re-
estimate the parameters
θ
,
θ
s
,
η
. This step can be executed
efficiently in closed form, using standard methods, for the
parameters
θ
,
η
. To estimate
θ
s
, we need to decompose it into
m variables and apply EM to this approximate form (see
Additional data file 1 for details). We repeat the E-step and M-
step until the change of likelihood is less than a threshold.
Since, in the next phase, we force each motif-protein pair to
be non-binding and compare the change of likelihood L
iaj
, we
have to makes sure the threshold used here for convergence is
at least a magnitude smaller than L
iaj
, so the noise would not
overwhelm the signal. Here we set the threshold to be 0.01 in
terms of change of log-likelihood. Note that Riley et al. used
the expected likelihood to test convergence, which does not
optimize the joint likelihood and may not always increase
over the EM steps.
To estimate the two hyper-parameters,
α
,
β
of the Dirichlet
distribution, we used two-fold cross-validation on the PDB
data set. In this regimen, we select the hyper-parameters so as
to optimize performance on one PDB fold, and evaluate per-
formance on the other fold; thus, no data in the test set were
used to estimate any of the parameters or hyper-parameters
in the model.
Binding confidence estimation
Since we explicitly model the binding events between a pair of
motifs and between amino acid pairs outside the motif set, it
gives us a way to compute the confidence that a motif on a
protein binds to another protein. Here the intuition is that if
a motif is non-binding, it is dispensable from the model. We
first run our model until convergence. To predict whether
motif a on protein i is the binding site to protein j, we force a
not to bind with any motif on protein j (Figure S4 in Addi-
tional data file 2). We rerun our algorithm with the above con-
straint and use the change in likelihood as the confidence
score of our prediction, which we denote to be L
iaj
. A high
score indicates that forcing a not to be the binding site
induces a big change in likelihood and is unfavorable. A low
score suggests the binding site is dispensable from the model
with competing hypotheses that can explain the observed
interactions, and thus the prediction is questionable. Unlike
PT T I PT O T I
ij ij ij ij
TOT
ij ij
(|.) (.|.)
.
.
.
O
O
=
∈
∏
PT B true R
PR T B true
PR
ij ab ab ab
ab ab ij ab
ab
(. | )
(|. )
(
==
′
=
=
.E
.E
.E
θ
θ
))
PT B true
PT T I true
PT
ij ab
ab ij ij
ij
(. | )
(|. )
()
==
′
=
T.O; ,
O
O
θη
θ
.
.
PT S true
mPT T I true
PT true
ij
sijij
ij
(. | )
()( | . )
(
==
=
=
T.O; ,
.O
.O
θη
θ
))
PT I true
PTItruePT TItrue
PT
ij
ij ij ij
i
(. |
(. )( | . )
(
==
==
T.O; ,
.O
θη
)
jj
.O)
PT I true m
ij s ab
TB T
ij ab ij
(. ) ( ()) ( )
.
==−− ⋅ −
′
∈
∏
11 1
θθ
.B
R192.16 Genome Biology 2007, Volume 8, Issue 9, Article R192 Wang et al. />Genome Biology 2007, 8:R192
the motif affinities
θ
ab
learned from the previous step, here
our confidence score L
iaj
depends on both proteins i and j and
is different for different proteins.
Model initialization
If a motif pair does not appear between any pair of interacting
proteins, we set its affinity to be 0, an assignment guaranteed
to maximize the joint likelihood; this helps simplify our
model structure. We set the initial affinity for the remaining
motif pairs based on the frequency with which they appear
between interacting protein pairs [81]. The observation
parameters
η
for the evidence models are initialized based on
empirical counts.
PDB co-crystallized structure
We extracted all structures from PDB that have at least two
co-crystallized chains, and whose chains are nearly identical
to S. cerevisiae proteins. We define two residues to be in con-
tact if the closest distance between their two respective heavy
atoms is less than 5 Å. This definition is similar to that of [59].
A motif is said to bind to a protein if they contain a residue
pair that is in contact.
OMIM
To relate our predictions to mutations that cause human
genetic diseases, we extracted the allelic variants from OMIM
[31], which describes where the mutations occur and their
related diseases. We get a total of 737 mutations covering 131
motifs in 97 proteins of our training data.
Cancer polymorphism
To relate our predictions to mutations in cancer, we extracted
more than 1,000 somatic mutations found in 274 megabases
of DNA corresponding to the coding exons of 518 protein
kinase genes in 210 diverse human cancers [32]. We focused
only on those proteins that are predicted to contain driver
mutation. This results in a total of 652 mutations covering
489 motifs in 249 proteins of our training set.
Abbreviations
AUC, area under the ROC curve; EM, expectation maximiza-
tion; GO, Gene Ontology; HPRD, Human Protein Reference
Database; InSite, Interaction Site; MS, mass spectrometry;
OMIM, Online Mendelian Inheritance in Man; PDB, Protein
Data Bank; Pol II, RNA polymerase II; ROC, receiver operat-
ing characteristic; TAP, tandem affinity purification.
Authors' contributions
All authors read and approved the final manuscript.
Additional data files
The following additional data are available with the online
version of this paper. Additional data file 1 is the supplemen-
tary material on the EM algorithm for the spurious binding
variable and captions for supplementary figures. Additional
data file 2 is supplementary figures.
Additional data file 1Supplementary figuresFigure S1 shows motif coverage of protein sequences compared with coverage of the protein-protein interaction binding sites. Fig-ure S2 is an illustration of the Bayesian network used in the first phase of InSite. Figure S3 is a schematic illustration of our EM-based learning algorithm. Figure S4 is an illustration of the Baye-sian network used in the second phase of InSite. Figure S5 shows the number of motifs and their lengths on each protein. Figure S6 shows the number of occurrences for each pair of motif types. Fig-ure S7 evaluates motif-protein binding site predictions with or without indirect evidence relative to solved PDB structures. Figure S8 shows the statistics for each protein-protein interaction dataset.Click here for fileAdditional data file 2Supplementary material on the EM algorithm for the spurious binding variable and captions for supplementary figuresSupplementary material on the EM algorithm for the spurious binding variable and captions for supplementary figuresClick here for file
Acknowledgements
We thank Dana Pe'er, Aviv Regev, Nir Friedman, and Doug Brutlag for use-
ful discussions and suggestions. This work was funded by the National Sci-
ence Foundation under Grant DBI-0345474 and by a Stanford Bio-X grant.
References
1. Gavin AC, Bosche M, Krause R, Grandi P, Marzioch M, Bauer A,
Schultz J, Rick JM, Michon AM, Cruciat CM, et al.: Functional organ-
ization of the yeast proteome by systematic analysis of pro-
tein complexes. Nature 2002, 415:141-147.
2. Gavin AC, Aloy P, Grandi P, Krause R, Boesche M, Marzioch M, Rau
C, Jensen LJ, Bastuck S, Dumpelfeld B, et al.: Proteome survey
reveals modularity of the yeast cell machinery. Nature 2006,
440:631-636.
3. Ho Y, Gruhler A, Heilbut A, Bader GD, Moore L, Adams SL, Millar A,
Taylor P, Bennett K, Boutilier K, et al.: Systematic identification
of protein complexes in Saccharomyces cerevisiae by mass
spectrometry. Nature 2002, 415:180-183.
4. Krogan NJ, Cagney G, Yu H, Zhong G, Guo X, Ignatchenko A, Li J, Pu
S, Datta N, Tikuisis AP, et al.: Global landscape of protein com-
plexes in the yeast Saccharomyces cerevisiae. Nature 2006,
440:637-643.
5. Stelzl U, Worm U, Lalowski M, Haenig C, Brembeck FH, Goehler H,
Stroedicke M, Zenkner M, Schoenherr A, Koeppen S, et al.: A human
protein-protein interaction network: a resource for annotat-
ing the proteome. Cell 2005, 122:957-968.
6. Rual JF, Venkatesan K, Hao T, Hirozane-Kishikawa T, Dricot A, Li N,
Berriz GF, Gibbons FD, Dreze M, Ayivi-Guedehoussou N, et al.:
Towards a proteome-scale map of the human protein-pro-
tein interaction network. Nature 2005, 437:1173-1178.
7. Giot L, Bader JS, Brouwer C, Chaudhuri A, Kuang B, Li Y, Hao YL,
Ooi CE, Godwin B, Vitols E, et al.: A protein interaction map of
Drosophila melanogaster. Science 2003, 302:1727-1736.
8. Walhout AJ, Sordella R, Lu X, Hartley JL, Temple GF, Brasch MA, Thi-
erry-Mieg N, Vidal M: Protein interaction mapping in C. elegans
using proteins involved in vulval development.
Science 2000,
287:116-122.
9. Uetz P, Giot L, Cagney G, Mansfield TA, Judson RS, Knight JR, Lock-
shon D, Narayan V, Srinivasan M, Pochart P, et al.: A comprehen-
sive analysis of protein-protein interactions in Saccharomyces
cerevisiae. Nature 2000, 403:623-627.
10. Ito T, Chiba T, Ozawa R, Yoshida M, Hattori M, Sakaki Y: A compre-
hensive two-hybrid analysis to explore the yeast protein
interactome. Proc Natl Acad Sci USA 2001, 98:4569-4574.
11. Chakrabarti P, Janin J: Dissecting protein-protein recognition
sites. Proteins 2002, 47:334-343.
12. Kann MG: Protein interactions and disease: computational
approaches to uncover the etiology of diseases. Brief Bioinform
2007. doi:10.1093/bib/bbm031
13. Finn RD, Mistry J, Schuster-Bockler B, Griffiths-Jones S, Hollich V,
Lassmann T, Moxon S, Marshall M, Khanna A, Durbin R, et al.: Pfam:
clans, web tools and services. Nucleic Acids Res 2006:D247-251.
14. Falquet L, Pagni M, Bucher P, Hulo N, Sigrist CJ, Hofmann K, Bairoch
A: The PROSITE database, its status in 2002. Nucleic Acids Res
2002, 30:235-238.
15. Mewes HW, Frishman D, Gueldener U, Mannhaupt G, Mayer K,
Mokrejs M, Morgenstern B, Muensterkotter M, Rudd S, Weil B:
MIPS: a database for genomes and protein sequences. Nucleic
Acids Res 2002, 30:31-34.
16. Xenarios I, Salwinski L, Duan XQJ, Higney P, Kim SM, Eisenberg D:
DIP; the Database of Interacting Proteins: a research tool for
studying cellular networks of protein interactions. Nucleic
Acids Res 2002, 30:303-305.
17. Ashburner M, Ball CA, Blake JA, Botstein D, Butler H, Cherry JM,
Davis AP, Dolinski K, Dwight SS, Eppig JT, et al.: Gene ontology:
tool for the unification of biology. The Gene Ontology
Consortium. Nat Genet 2000, 25:25-29.
18. Guimaraes KS, Jothi R, Zotenko E, Przytycka TM: Predicting
Genome Biology 2007, Volume 8, Issue 9, Article R192 Wang et al. R192.17
comment reviews reports refereed researchdeposited research interactions information
Genome Biology 2007, 8:R192
domain-domain interactions using a parsimony approach.
Genome Biol 2006, 7:R104.
19. Lee H, Deng M, Sun F, Chen T: An integrated approach to the
prediction of domain-domain interactions. BMC Bioinformatics
2006, 7:269.
20. Riley R, Lee C, Sabatti C, Eisenberg D: Inferring protein domain
interactions from databases of interacting proteins. Genome
Biol 2005, 6:R89.
21. Caffrey DR, Somaroo S, Hughes JD, Mintseris J, Huang ES: Are pro-
tein-protein interfaces more conserved in sequence than the
rest of the protein surface? Protein Sci 2004, 13:190-202.
22. Pearl J: Probabilistic Reasoning in Intelligent Systems San Francisco: Mor-
gan Kaufmann; 1988.
23. Deng M, Mehta S, Sun F, Chen T: Inferring domain-domain inter-
actions from protein-protein interactions. Genome Res 2002,
12:1540-1548.
24. Lee I, Date SV, Adai AT, Marcotte EM: A probabilistic functional
network of yeast genes. Science 2004, 306:1555-1558.
25. von Mering C, Krause R, Snel B, Cornell M, Oliver SG, Fields S, Bork
P: Comparative assessment of large-scale data sets of pro-
tein-protein interactions. Nature 2002, 417:399-403.
26. Myers CL, Robson D, Wible A, Hibbs MA, Chiriac C, Theesfeld CL,
Dolinski K, Troyanskaya OG: Discovery of biological networks
from diverse functional genomic data. Genome Biol 2005,
6:R114.
27. Jansen R, Yu H, Greenbaum D, Kluger Y, Krogan NJ, Chung S, Emili
A, Snyder M, Greenblatt JF, Gerstein M: A Bayesian networks
approach for predicting protein-protein interactions from
genomic data. Science 2003, 302:449-453.
28. Zhang LV, Wong SL, King OD, Roth FP: Predicting co-complexed
protein pairs using genomic and proteomic data integration.
BMC Bioinformatics 2004, 5:
38.
29. Berman HM, Westbrook J, Feng Z, Gilliland G, Bhat TN, Weissig H,
Shindyalov IN, Bourne PE: The Protein Data Bank. Nucleic Acids
Res 2000, 28:235-242.
30. Siemens J, Kazmierczak P, Reynolds A, Sticker M, Littlewood-Evans A,
Muller U: The Usher syndrome proteins cadherin 23 and har-
monin form a complex by means of PDZ-domain
interactions. Proc Natl Acad Sci USA 2002, 99:14946-14951.
31. Hamosh A, Scott AF, Amberger JS, Bocchini CA, McKusick VA:
Online Mendelian Inheritance in Man (OMIM), a knowledge-
base of human genes and genetic disorders. Nucleic Acids Res
2005:D514-517.
32. Greenman C, Stephens P, Smith R, Dalgliesh GL, Hunter C, Bignell G,
Davies H, Teague J, Butler A, Stevens C, et al.: Patterns of somatic
mutation in human cancer genomes. Nature 2007,
446:153-158.
33. InSite [ />34. Rhodes DR, Tomlins SA, Varambally S, Mahavisno V, Barrette T, Kaly-
ana-Sundaram S, Ghosh D, Pandey A, Chinnaiyan AM: Probabilistic
model of the human protein-protein interaction network.
Nat Biotechnol 2005, 23:951-959.
35. Ben-Hur A, Noble WS: Choosing negative examples for the
prediction of protein-protein interactions. BMC Bioinformatics
2006, 7(Suppl 1):S2.
36. Peri S, Navarro JD, Amanchy R, Kristiansen TZ, Jonnalagadda CK,
Surendranath V, Niranjan V, Muthusamy B, Gandhi TK, Gronborg M,
et al.: Development of human protein reference database as
an initial platform for approaching systems biology in
humans. Genome Res 2003, 13:2363-2371.
37. Ewing RM, Chu P, Elisma F, Li H, Taylor P, Climie S, McBroom-Cera-
jewski L, Robinson MD, O'Connor L, Li M, et al.: Large-scale map-
ping of human protein-protein interactions by mass
spectrometry. Mol Syst Biol 2007, 3:89.
38. Bateman A, Coin L, Durbin R, Finn RD, Hollich V, Griffiths-Jones S,
Khanna A, Marshall M, Moxon S, Sonnhammer EL, et al.: The Pfam
protein families database. Nucleic Acids Res 2004:D138-141.
39. Enright AJ, Iliopoulos I, Kyrpides NC, Ouzounis CA: Protein inter-
action maps for complete genomes based on gene fusion
events. Nature
1999, 402:86-90.
40. Marcotte EM, Pellegrini M, Ng HL, Rice DW, Yeates TO, Eisenberg
D: Detecting protein function and protein-protein interac-
tions from genome sequences. Science 1999, 285:751-753.
41. Cramer P, Bushnell DA, Kornberg RD: Structural basis of
transcription: RNA polymerase II at 2.8 angstrom
resolution. Science 2001, 292:1863-1876.
42. Ohlin AK, Landes G, Bourdon P, Oppenheimer C, Wydro R, Stenflo
J: Beta-hydroxyaspartic acid in the first epidermal growth
factor-like domain of protein C. Its role in Ca2+ binding and
biological activity. J Biol Chem 1988, 263:19240-19248.
43. OMIM [ />44. Inohara N, Ding L, Chen S, Nunez G: harakiri, a novel regulator
of cell death, encodes a protein that activates apoptosis and
interacts selectively with survival-promoting proteins Bcl-2
and Bcl-X(L). EMBO J 1997, 16:1686-1694.
45. Meijerink JP, Mensink EJ, Wang K, Sedlak TW, Sloetjes AW, de Witte
T, Waksman G, Korsmeyer SJ: Hematopoietic malignancies
demonstrate loss-of-function mutations of BAX. Blood 1998,
91:2991-2997.
46. Zha H, Aime-Sempe C, Sato T, Reed JC: Proapoptotic protein
Bax heterodimerizes with Bcl-2 and homodimerizes with
Bax via a novel domain (BH3) distinct from BH1 and BH2. J
Biol Chem 1996, 271:7440-7444.
47. George NM, Evans JJ, Luo X: A three-helix homo-oligomeriza-
tion domain containing BH3 and BH1 is responsible for the
apoptotic activity of Bax. Genes Dev 2007, 21:1937-1948.
48. Reed JC, Zha H, Aime-Sempe C, Takayama S, Wang HG: Structure-
function analysis of Bcl-2 family proteins. Regulators of pro-
grammed cell death. Adv Exp Med Biol 1996, 406:99-112.
49. Zankl A, Bonafe L, Calcaterra V, Di Rocco M, Superti-Furga A: Win-
chester syndrome caused by a homozygous mutation affect-
ing the active site of matrix metalloproteinase 2. Clin Genet
2005, 67:261-266.
50. Nakamura H, Fujii Y, Inoki I, Sugimoto K, Tanzawa K, Matsuki H,
Miura R, Yamaguchi Y, Okada Y: Brevican is degraded by matrix
metalloproteinases and aggrecanase-1 (ADAMTS4) at dif-
ferent sites. J Biol Chem 2000, 275:38885-38890.
51. Michel F, Grimaud L, Tuosto L, Acuto O: Fyn and ZAP-70 are
required for Vav phosphorylation in T cells stimulated by
antigen-presenting cells. J Biol Chem 1998, 273:31932-31938.
52. VAV1 [ />VAV1ID195ch19p13.html]
53. Gray JJ, Moughon S, Wang C, Schueler-Furman O, Kuhlman B, Rohl
CA, Baker D: Protein-protein docking with simultaneous opti-
mization of rigid-body displacement and side-chain
conformations. J Mol Biol 2003, 331:281-299.
54. Kim PM, Lu LJ, Xia Y, Gerstein MB: Relating three-dimensional
structures to protein networks provides evolutionary
insights. Science 2006, 314:1938-1941.
55. Lu L, Arakaki AK, Lu H, Skolnick J: Multimeric threading-based
prediction of protein-protein interactions on a genomic
scale: application to the Saccharomyces cerevisiae proteome.
Genome Res 2003, 13:1146-1154.
56. Aloy P, Russell RB: Interrogating protein interaction networks
through structural biology. Proc Natl Acad Sci USA 2002,
99:5896-5901.
57. Marti-Renom MA, Rossi A, Al-Shahrour F, Davis FP, Pieper U,
Dopazo J, Sali A: The AnnoLite and AnnoLyze programs for
comparative annotation of protein structures. BMC
Bioinformatics 2007, 8(Suppl 4):S4.
58. Ofran Y, Rost B: Predicted protein-protein interaction sites
from local sequence information. FEBS Lett 2003, 544:236-239.
59. Koike A, Takagi T: Prediction of protein-protein interaction
sites using support vector machines. Protein Eng Des Sel 2004,
17:165-173.
60. Liu Y, Liu N, Zhao H: Inferring protein-protein interactions
through high-throughput interaction data from diverse
organisms. Bioinformatics 2005,
21:3279-3285.
61. Gomez SM, Noble WS, Rzhetsky A: Learning to predict protein-
protein interactions from protein sequences. Bioinformatics
2003, 19:1875-1881.
62. Ng SK, Zhang Z, Tan SH: Integrative approach for computa-
tionally inferring protein domain interactions. Bioinformatics
2003, 19:923-929.
63. Nye TM, Berzuini C, Gilks WR, Babu MM, Teichmann SA: Statistical
analysis of domains in interacting protein pairs. Bioinformatics
2005, 21:993-1001.
64. Jothi R, Cherukuri PF, Tasneem A, Przytycka TM: Co-evolutionary
analysis of domains in interacting proteins reveals insights
into domain-domain interactions mediating protein-protein
interactions. J Mol Biol 2006, 362:861-875.
65. Su QJ, Lu L, Saxonov S, Brutlag DL: eBLOCKs: enumerating con-
served protein blocks to achieve maximal sensitivity and
specificity. Nucleic Acids Res 2005:D178-182.
66. Huang JY, Brutlag DL: The EMOTIF database. Nucleic Acids Res
2001, 29:202-204.
R192.18 Genome Biology 2007, Volume 8, Issue 9, Article R192 Wang et al. />Genome Biology 2007, 8:R192
67. Bonneau R, Tsai J, Ruczinski I, Chivian D, Rohl C, Strauss CE, Baker
D: Rosetta in CASP4: progress in ab initio protein structure
prediction. Proteins 2001:119-126.
68. Do CB, Woods DA, Batzoglou S: CONTRAfold: RNA secondary
structure prediction without physics-based models. Bioinfor-
matics 2006, 22:e90-98.
69. Rivas E, Eddy SR: A dynamic programming algorithm for RNA
structure prediction including pseudoknots. J Mol Biol 1999,
285:2053-2068.
70. Yanover C, Weiss Y: Approximate inference and protein fold-
ing. In Proceedings to Neural Information Processing Systems: December
9-14; Vancouver Edited by: Becker S, Thrun S, Obermayer K. Cam-
bridge, MA: MIT Press; 2003:1457-1464.
71. Zakrzewska A, Boorsma A, Brul S, Hellingwerf KJ, Klis FM: Tran-
scriptional response of Saccharomyces cerevisiae to the
plasma membrane-perturbing compound chitosan. Eukaryot
Cell 2005, 4:703-715.
72. Mercier G, Berthault N, Touleimat N, Kepes F, Fourel G, Gilson E,
Dutreix M: A haploid-specific transcriptional response to irra-
diation in Saccharomyces cerevisiae. Nucleic Acids Res 2005,
33:6635-6643.
73. Causton HC, Ren B, Koh SS, Harbison CT, Kanin E, Jennings EG, Lee
TI, True HL, Lander ES, Young RA: Remodeling of yeast genome
expression in response to environmental changes. Mol Biol Cell
2001, 12:323-337.
74. Lai LC, Kosorukoff AL, Burke PV, Kwast KE: Dynamical remode-
ling of the transcriptome during short-term anaerobiosis in
Saccharomyces cerevisiae: differential response and role of
Msn2 and/or Msn4 and other factors in galactose and glucose
media. Mol Cell Biol 2005, 25:4075-4091.
75. O'Rourke SM, Herskowitz I: A third osmosensing branch in
Sac-
charomyces cerevisiae requires the Msb2 protein and func-
tions in parallel with the Sho1 branch. Mol Cell Biol 2002,
22:4739-4749.
76. Gasch AP, Spellman PT, Kao CM, Carmel-Harel O, Eisen MB, Storz
G, Botstein D, Brown PO: Genomic expression programs in the
response of yeast cells to environmental changes. Mol Biol Cell
2000, 11:4241-4257.
77. Gasch AP, Huang M, Metzner S, Botstein D, Elledge SJ, Brown PO:
Genomic expression responses to DNA-damaging agents
and the regulatory role of the yeast ATR homolog Mec1p.
Mol Biol Cell 2001, 12:2987-3003.
78. DeRisi JL, Iyer VR, Brown PO: Exploring the metabolic and
genetic control of gene expression on a genomic scale. Sci-
ence 1997, 278:680-686.
79. Kitagawa E, Akama K, Iwahashi H: Effects of iodine on global gene
expression in Saccharomyces cerevisiae. Biosci Biotechnol Biochem
2005, 69:2285-2293.
80. Legrain P, Selig L: Genome-wide protein interaction maps
using two-hybrid systems. FEBS Lett 2000, 480:32-36.
81. Sprinzak E, Margalit H: Correlated sequence-signatures as
markers of protein-protein interaction. J Mol Biol 2001,
311:681-692.