Báo cáo y học: ":Identification of novel stem cell markers using gap analysis of gene expression data" ppsx
Bạn đang xem bản rút gọn của tài liệu. Xem và tải ngay bản đầy đủ của tài liệu tại đây (2.42 MB, 19 trang )
Genome Biology 2007, 8:R193
Open Access
2007Krzyzanowski and Andrade-NavarroVolume 8, Issue 9, Article R193
Method
Identification of novel stem cell markers using gap analysis of gene
expression data
Paul M Krzyzanowski
*†
and Miguel A Andrade-Navarro
*†
Addresses:
*
Molecular Medicine, Ottawa Health Research Institute, 501 Smyth Road, Ottawa, Ontario, K1H 8L6, Canada.
†
Faculty of Medicine,
University of Ottawa, 451 Smyth Road, Ottawa, Ontario, K1H 8M5, Canada.
Correspondence: Paul M Krzyzanowski. Email:
© 2007 Krzyzanowski and Andrade-Navarro.; licensee BioMed Central Ltd.
This is an open access article distributed under the terms of the Creative Commons Attribution License ( which
permits unrestricted use, distribution, and reproduction in any medium, provided the original work is properly cited.
Gap analysis for stem cell markers<p>A method for the detection of marker genes in large heterogeneous collections of gene expression data is described and applied to DNA microarray data generated from 83 mouse stem cell-related samples.</p>
Abstract
We describe a method for detecting marker genes in large heterogeneous collections of gene
expression data. Markers are identified and characterized by the existence of demarcations in their
expression values across the whole dataset, which suggest the presence of groupings of samples.
We apply this method to DNA microarray data generated from 83 mouse stem cell related samples
and describe 426 selected markers associated with differentiation to establish principles of stem
cell evolution.
Background
Gene expression microarrays allow thousands of transcripts
in a cellular sample to be quantified simultaneously. (For
reviews of the technology and applications, see the reports by
Heller [1] and Sloughton [2].) Continuing improvements in
microarray technology, in terms of transcript density, techni-
cal robustness, and cost, have led to widespread usage of
arrays in experiments. The size of single studies has grown
and can encompass the analysis of up to hundreds of arrays
simultaneously [3-5]. This vast explosion of reusable data
being generated has resulted in efforts being directed at pro-
ducing expression data repositories in which the data are
curated and presented in an ordered manner [6-8]. The large
number of data points makes such resources an exceptional
source of biologic information.
Some common uses of gene expression data are the identifi-
cation of co-regulated genes across many samples [9], identi-
fication of differentially expressed genes in samples of
interest [10], and, more recently, analysis of alternative splic-
ing [11-13] and genome-wide surveillance of transcription
[14-16]. They can also be used to identify marker genes asso-
ciated with specific sets of samples. As distinguishing fea-
tures, such markers can be used as diagnostic tests for disease
[17,18] or for the identification and purification of particular
cell types [19,20]. The identification of multiple markers for a
particular phenotype may also reveal biologic mechanisms by
which certain genes act in concert.
A simple method to identify marker gene candidates is to
identify genes that are differentially expressed between a set
of control samples and samples from a condition of interest.
A two-state comparison can be made, and genes associated
with each type of sample can be identified and used as mark-
ers. Current gene expression databases typically contain data
from many types of samples, and this heterogeneity provides
the potential for more powerful analyses. One can, for exam-
ple, identify transcripts that are specific to a sample (or sam-
ples) of interest, or conduct novel comparisons between
different combinations of transcription profiles. The
increased size of the databases also increases the number of
possible two-state comparisons exponentially, which poses a
computational problem. Overcoming this problem requires a
computational method.
Published: 17 September 2007
Genome Biology 2007, 8:R193 (doi:10.1186/gb-2007-8-9-r193)
Received: 4 May 2007
Accepted: 17 September 2007
The electronic version of this article is the complete one and can be
found online at />R193.2 Genome Biology 2007, Volume 8, Issue 9, Article R193 Krzyzanowski and Andrade-Navarro />Genome Biology 2007, 8:R193
We have developed a methodology that uses large heteroge-
neous gene expression datasets to identify genes that can
function as markers. In summary, we examine the distribu-
tion of expression values of each probe set to identify gaps.
These gaps can be used to partition the database into groups
of low-expressing and high-expressing samples, which sug-
gest the existence of distinct subpopulations of samples. We
then score other probe sets based on their ability to reproduce
these database partitions. The characteristics of samples in
each database partition identify the context in which genes
may act as markers, which aids in the subsequent evaluation
of genes in terms of their putative marker roles.
In this study we illustrate our methodology in the analysis of
a database of stem-cell related DNA microarray samples that
we previously developed (StemBase [7]). In particular, we
study 83 mouse stem cell related samples analyzed using the
Affymetrix MOE430 genechip set (Affymetrix Inc., Santa
Clara, CA, USA), which includes approximately 45,000 probe
sets. Unbiased application of the method produces a set of
4,449 cell and tissue markers, including 45 out of 71 known
stem cell markers (69%). Analysis of the markers that segre-
gate six types of stem cells (hematopoietic, mast, mammos-
pheres, osteoblasts, and two embryonic) from their
differentiated counterparts suggests 426 high confidence
markers, 206 of which are highly expressed in the stem cell
and 222 are highly expressed in the differentiated counter-
part (two being highly expressed in stem cells in some cases,
and in the differentiated counterpart in others). Of those 426
markers, 17 are involved in multiple distinct lineages that
include at least one non-embryonic cell type; nine markers
are highly expressed in the stem cells, six are highly expressed
in the differentiated cells, and two exhibit opposite variation
in different stem-derivative cell pairs. Analysis of the func-
tions of the 222 genes that are highly expressed in the differ-
entiated cells indicates enrichment of extracellular gene
products and enzyme inhibitors (12 genes, five of them
serpins).
The set of 426 stem cell markers allows us to focus on gene
superfamilies that have undergone repeated gene duplication
events for a phylogenetic analysis of the evolution of proteins
involved in stem cell function. By sequence similarity analy-
sis, we identify four such families (nuclear receptors, cyto-
chrome P450, Rab family GTPases, and early B-cell factors)
with multiple members in this set. The study of examples
from each reveals multiple events of gene duplication along
the vertebrate lineage giving rise to genes with a very high
degree of sequence similarity, but very different patterns of
expression in stem cells. This leads to a hypothesis that many
stem cell related genes expressed in particular tissues arose
by duplication and specialization of stem cell related genes
originally expressed in other tissues. Superfamilies with large
rates of duplication in the vertebrate lineage may have func-
tions related to the development of an increasingly complex
organism, including the generation and control of tissue-spe-
cific stem cell pools. All results and data presented here are
available and can be queried through a web server [21].
Results
We applied our method to a set of DNA microarray data from
83 samples from mouse stem cells and derivatives. Samples
included embryonic, hematopoietic, mammosphere, retinal,
neurosphere, adipose, and muscle cells (Table 1). All data
were obtained using the Affymetrix MOE430 platform
(Affymetrix Inc.) and subjected to quality controls as previ-
ously described [7].
Table 1
Set of mouse samples selected for our analysis from StemBase
Class Samples Replicates SampleIDs
Adipose derived stem cells 1 3 S199
Dermis derived stem cells 1 3 S200
Embryonal carcinoma 4 12 S129, S130, S131, S132
Embryonic 8 23 S219, S220, S164, S165, S166, S167, S168, S169
Embryonic fibroblasts 2 6 S180, S286
Embryonic stem cell differentiation 35 105 S153, S154, S155, S156, S157, S158, S159, S181, S174, S241, S175, S206, S207, S208,
S209, S210, S211, S212, S213, S215, S216, S217, S242, S243, S244, S251, S252, S245,
S250, S246, S247, S248, S249, S127, S128
Hematopoietic 12 33 S233, S234, S235, S236, S237, S147, S291, S292, S293, S294, S295, S296
Mammary 5 15 S255, S256, S311, S312, S313
Muscle derived stem cells 3 7 S274, S184, S197
Neural 3 10 S271, S272, S198
Osteoblast differentiation 7 21 S185, S186, S188, S190, S192, S194, S196
Retinal derived stem cells 2 3 S232, S240
Various stem cells (SC) are represented in the data set. All original data including sample and experiment descriptions are accessible from the
StemBase homepage [64].
Genome Biology 2007, Volume 8, Issue 9, Article R193 Krzyzanowski and Andrade-Navarro R193.3
Genome Biology 2007, 8:R193
At a U-score cutoff of 0.9 (see Materials and methods, below),
our method identified 893 different two-state classifications
with which to segregate the 83 sample dataset. Figure 1 shows
three exemplar distributions of hybridization values for three
probe sets that clearly segregate the dataset and are desirable
choices for markers. Interpretation of the segregation pattern
becomes obvious from the distribution itself as the group of
samples with low gene expression values is separated from
the group of samples with high expression values by a gap.
Simplicity of interrogation allowed us to create a web tool
(accessible on the internet [21]) to query these classifications
so that users can determine whether a given gene is a marker,
and find which samples it represents. Also, the tool allows us
to find the markers separating two sets of samples of choice.
Properties of the set of potential markers
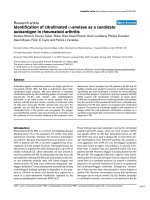
Classifications contained varying numbers of probe sets. Fig-
ure 2a shows that patterns with small numbers of markers are
more numerous. The 893 classifications also separated differ-
ent numbers of samples into groups. Most patterns assigned
small numbers of samples to 'upregulated' groups (for exam-
ple, the gene was highly expressed in three samples versus
80). Over 80% of the patterns separate ten or fewer samples
from the remainder of the database as a highly expressed
group (Figure 2b). The complete set of putative markers asso-
ciated with the 893 patterns includes 10,401 probe sets, or
approximately 25% of the probes on the microarray, which is
intuitively quite a large fraction.
We expected that patterns defined by smaller numbers of
marker genes would be more likely to include genes impor-
tant for stem cell related functions. To investigate this, we
examined the distribution of known stem cell markers in this
set and whether the method was able to select them preferen-
tially within small clusters.
Known stem cell markers in dataset
We investigated whether known stem cell markers were iden-
tified in our dataset in order to understand the properties and
usefulness of the selected patterns within the context of stem
cell research.
By examining the literature, we selected 88 marker genes that
represented the variety of stem cell types in our dataset (Table
2). We identified the corresponding entries in the Entrez
Gene database for 72 of the 88 marker genes. In seven of the
remaining cases we were unable to identify definitively the
correct gene because of ambiguity of the provided gene iden-
tifier (for example, 'laminin' could indicate one of several pos-
sible genes), and in nine cases the identifier could not be
related to any entry in the database (for example, 'neural-
stemmin'). Of these 72 Entrez Gene IDs, 71 had at least one
associated probe set on the Affymetrix MOE430A/B chip set.
Our set of 10,401 'potential marker' probe sets, which con-
tains patterns with a maximum of 200 associated probe sets
(described under Filtering marker lists by size and number of
classified samples, below), contained probe sets for 49 of
these 71 marker genes (69%).
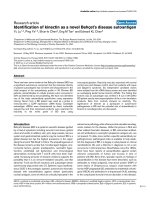
Distributions of hybridization values for probe setsFigure 1
Distributions of hybridization values for probe sets. Each histogram depicts the number of replicates (from a total of 241) with a given hybridization value
for a given probe set. For illustrative purposes, we display the distribution of hybridization values of three probe sets selected using the gap method as
markers corresponding to (a) a known neural stem cell marker (Nestin; probe set 1449022_at), (b) a novel stem cell marker encoding a protein of known
function (phospholipase Pla2g7; probe set 1430700_a_at) that we observed to be upregulated in bone marrow mast cell precursors and in undifferentiated
mammospheres, and (c) a novel stem cell marker corresponding to an uncharacterized transcript upregulated in undifferentiated V6.5 and J1 murine
embryonic stem cells (2410146L05Rik; probe set 1460471_at). Details on these three cases can be obtained through our online webserver [21] by viewing
group numbers 73, 497, and 265, respectively. (d) For comparison, we show the distribution for a housekeeping gene (Eef1a1; probe set 1424635_at), a
ribosomal translation elongation factor protein, which is always expressed and was not classified as a marker in our analysis. For robustness, the
segregation of the samples (indicated by red and blue bars in the three marker distributions for the down and upregulated groups, respectively) is derived
by analysis of the global set of patterns (see Materials and methods) and might not correspond perfectly to the distribution observed here. See, for
example, a single replicate in the distribution of Nestin, which is left of the gap in the distribution but was (correctly) associated to the upregulated (blue)
group.
Relative hybridization level (log
2
scale)
Number of replicates
Expres sion Levels of 1424635_at.A
0
10
20
30
40
50
0
20
40
60
80
0
10
20
30
40
50
60
0
20
40
60
80
0
5
10
15
0
2
468
0
2
4
68
10
0
2
4
68
10
(a) (b) (c) (d)
R193.4 Genome Biology 2007, Volume 8, Issue 9, Article R193 Krzyzanowski and Andrade-Navarro />Genome Biology 2007, 8:R193
As previously observed, we obtained numerous patterns that
segregate small subsets of samples and that are defined by
small numbers of genes. To test our hypothesis that these
would tend to contain relevant genes (in this case, genes use-
ful for characterizing stem cells), we examined the recall and
precision of our method for the 71 known markers as the max-
imum marker list length was reduced from 200 to 3 (Figure
3). Limiting the list to patterns defined by 63 or fewer mark-
ers reduced the total number of probe sets assigned marker
roles from 10,401 to 5,848 (44% reduction) while losing only
four known stem cell markers, representing a recall rate of
63% (45 out 71; point marked with a circle in Figure 3). This
supports our theory that marker genes are more often con-
tained in small clusters.
The 705 patterns defined by 63 or fewer markers segregated
a mean of nine samples (median 5) in the upregulated group
and were associated with a mean of 21 markers (median 15).
This set associates 5,848 probe sets (4,449 genes) with at
least one pattern, accounting for approximately 13% of the
probe sets on the MOE430 microarray platform. We propose
that many of those can be developed into useful markers. We
define this as 'selected marker' set.
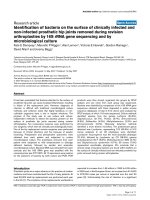
We compared the performance of our method with a popular
method for analysis of gene expression data, namely k-
means, which is a standard clustering algorithm (see Materi-
als and methods, below). Both methods performed similarly
in producing groups of genes that are expected to be enriched
for stem cell markers (Figure 3). However, our method differs
from a clustering algorithm in that we identify markers that
segregate sets of samples whereas clustering algorithms
group markers with similar expression patterns. Accordingly,
the groups of associated markers produced by the gap method
were somewhat different from the clusters obtained using k-
means (mean overlap of 69.8%).
Overview of the selected marker set
To illustrate the variety of patterns identified, Figure 4 shows
the expression patterns of the 49 probe sets that represent
previously known stem cell marker genes identified by the
algorithm (yellow), together with another 1,252 genes that
were assigned a perfect score by the algorithm (blue). All
major divisions in the dataset appear clearly defined, with
samples related to one of hematopoietic, sphere [22], or
embryonic sample types forming major groups. For example,
hematopoietic samples define many patterns with probe sets
identified uniquely within them.
Gene Ontology statistics of the selected marker set
Since the selection of markers was done without reference to
the identity of the samples, we would expect to find not just
stem cell markers but also general markers of cell and tissue
identity (for example, distinguishing differentiated blood
cells from epithelial cells). To investigate in general terms the
function of the genes that were selected in the marker set, we
collected the 5,848 probe sets defining the 705 selected pat-
terns (with 3 to 63 associated probe sets). These
corresponded to 4,449 Entrez Gene IDs, for which we deter-
mined the over-representation of Gene Ontology (GO) anno-
tations. Using the 'potential marker' set of 7,478 genes (which
defined groups with up to 200 probe sets) as a reference, we
found several significantly enriched functional categories
(Table 3).
Significantly enriched functions (P < 0.001) include those
that allow cells to interact and respond to environmental cues
('defense response', 'cell communication', 'signal transducer
Properties of the set of 893 patternsFigure 2
Properties of the set of 893 patterns. (a) Number of patterns with a given number of probe sets associated with a score of 90%. (b) Number of patterns
with a given number of samples segregated in the high expression group.
0
20
40
60
80
100
120
140
160
0 1020304050607080
Number of patterns
Number of patterns
Probe sets associated
Samples in high group
(a)
(b)
20
30
40
50
60
200
150
100
50
0
10
0
Genome Biology 2007, Volume 8, Issue 9, Article R193 Krzyzanowski and Andrade-Navarro R193.5
Genome Biology 2007, 8:R193
activity', and 'receptor activity'), to interact with the
immediate neighborhood of the cell ('extracellular matrix
region', 'extracellular matrix', 'membrane', and 'cell adhe-
sion'), and functions related to development ('multicellular
organismal development' and 'organ development'). Finding
these development-related functions is reasonable given that
our set of samples is focused on stem cells. The abundance of
functions related to the interaction of cells with their environ-
ment, on the other hand, may generally reflect that cell iden-
tity is largely defined at their surfaces; we would expect to see
these functions in the analyses of other collections of gene
expression data sampling multiple tissues.
Examination of markers of stem cell differentiation
One distinctive feature of the gap method is that genes are
selected based on their ability to define binary groupings of
samples. This is meaningful and often desired from the point
of view of an experimental researcher. Understanding the sig-
nificance of the marker becomes simpler as the pattern itself
gives a classification of the sample set.
Likewise, the identified sample partitions allow simple,
direct, and intuitive ways to manipulate the gene expression
data. We illustrate this here by applying a selection procedure
to the set of patterns obtained above to focus on markers that
are active in any of several lineages of stem cell differentiation
included in our dataset.
Generally, we are interested in the properties of probe sets
that separate undifferentiated and differentiated sets of stem
cells. We chose six pairs of stem cell samples and their differ-
entiated derivatives from our dataset (two embryonic stem
cell lines, hematopoietic stem cells [HSCs], osteoblasts, mam-
mospheres, and mast cell progenitors; Additional data file 3)
and selected probe sets that segregated at least one sample
pair with high confidence (99% association score); specifi-
cally, the probe set exhibited high expression in the undiffer-
entiated sample and low expression in the differentiated
sample, or vice versa. This selection identified 488 probe sets
(called the 'stem cell related' set) corresponding to 426 genes,
of which 206 exhibited high expression in the undifferenti-
ated sample and 222 in the differentiated counterpart. Two
genes showed high expression in the undifferentiated sample
for some cell types, and in the differentiated sample in others:
Ugt1a2 detected by probe set 1426260_a_at, and a gene
encoding a hypothetical coiled-coil domain-containing pro-
tein detected by probe set 1444761_at. This set of 426 genes
included five out of the 71 known stem cell markers used for
benchmarking (Krt1-14, Mtap2, Ncam1, Spp1, and Vim).
Examination of the GO terms of the set resulted in a very
short list of significant functions (P < 0.01). Separate analyses
of genes upregulated in undifferentiated and differentiated
states failed to identify GO terms over-represented in the
genes that were highly expressed in stem cells. The only rele-
vant terms for the genes expressed in the differentiated genes
(Table 3) were related to the extracellular environment
('extracellular region' and 'extracellular matrix'), but with less
statistical significance than those for the selected list of 4,449
cell markers. It is known that stem cells often rely on the
maintenance of a stable microenvironment (the niche) for
physical support and extrinsic cues (for a review, see Li and
Xie [23]). The GO term 'enzyme inhibitor activity', not rele-
vant for the larger marker set, appeared as relevant (P =
0.001) for a set of 12 genes, five of which belonged to the fam-
ily of serpins (SERine Protease INhibitors; serpins a1b, a3n,
b9, g1, and h1).
Serpins are a large class of proteins that are found in all mul-
ticellular eukaryotes and predominantly function as serine
protease inhibitors, but they can also function as caspase and
cysteine protease inhibitors and, in rare cases, as hormone
transporters, chaperones, or tumor suppressors. In contrast
to eukaryotes, prokaryotic serpins are rare and most serpin-
containing prokaryotes have only a single serpin gene [24]. In
agreement with our findings, variation in serpin gene expres-
sion was recently observed during differentiation in the
myeloid lineage [25,26]. Here we give some insight into the
functions of the six serpins we identified in our study.
Serpinb9 is an estrogen-inducible caspase inhibitor that can
inhibit granzyme B-mediated apoptosis, a key mechanism by
which cytolytic lymphocytes are able to destroy target cells. It
is expressed at high levels in testis and placenta, and may con-
tribute to the ability of immune-privileged cells to evade
destruction [27]. Recently, it was shown that serpinb9 plays a
role in allowing embryonic stem cells (ESCs) to evade a simi-
lar fate [28]. Serpins a3n and a3g have been shown to be
strongly influenced by LIM-homeobox 2 expression in a
hematopoietic system [29].
Serpina3g was previously reported to be highly enriched in
HSCs, in concordance with our observations [30]. Similar in
function to serpinb9, serpina3n has been implicated in pro-
viding protection from granzyme B mediated cell death in a
study of Sertoli cell secreted factors [31]. Interestingly,
Serpinh1 is one of the exceptions of the serpin family; it is a
chaperone molecule that plays a role in the maturation of pro-
collagen [32]. With relevance to stem cell biology, Serpinh1
knockout ESCs produce embryoid bodies with aberrant mor-
phology [33]. In summary, the abundance of serpins as mark-
ers might reflect generalized mechanisms of immune system
avoidance that are activated in cells undergoing
differentiation.
This complete set of cell markers offers a good basis from
which to study principles of stem cell gene function. For
example, of the 426 genes selected as markers, a small
number of genes (17) were involved in several of the six line-
ages selected (at least one of them being non-ESC). Of those,
nine were highly expressed in the stem cells, six were highly
expressed in the differentiated partners, and only two were
R193.6 Genome Biology 2007, Volume 8, Issue 9, Article R193 Krzyzanowski and Andrade-Navarro />Genome Biology 2007, 8:R193
Table 2
Stem cell markers
Ref. Cellular type Gene name Entrez Gene Probe set polled Pattern Score D
[74] Differentiated retinal 309L ? -
Rho1D4 (rhodopsin) ? -
D2P4 (rhodopsin) ? -
CHX10 Chx10 1419628_at.A Not found Not found
PKC
a
-
ROM-1 Rom1 1448996_at.A 879 0.942
Photoreceptor specific homeobox Crx Crx 1418705_at.A Not found Not found
Muller glia 10E4 ? -
[75] Human central nervous system CD24-/lo CD24a 1416034_at.A 573 0.987 2
CD34- CD34 1416072_at.A 72 0.990 2
CD45- Ptprc 1422124_a_at.A 427 0.987
Human neuronal lineage N-CAM Ncam1 1426864_a_at.A 318 1.000
Neural CD133 Prom1 1419700_a_at.A 573 0.930 2
Hematopoietic CD133 Prom1 1419700_a_at.A 573 0.930 2
[76] Proliferating neural Ki-67 Mki67 1426817_at.A 8 0.991
[77] Trophoblast Cdx2 Cdx2 1422074_at.A Not found Not found
Ectoderm Fgf5 Fgf5 1438883_at.B 442 1.000
Neuroectoderm Isl1 Isl1 1422720_at.A 83 0.931
Pluripotent stem cell Nanog Nanog 1429388_at.A 390 0.947
Oct3/4 Pou5f1 1417945_at.A 151 1.000
Rex1 Zfp42 1418362_at.A 547 0.964
Mesoderm Brachyury T 1419304_at.A 232 0.938
[78] Neural stem cell Hu ? -
Neuralstemmin ? -
ABCG2 Abcg2 1422906_at.A Not found Not found 3
LeX/SSEA-1 Fut4 1455843_at.B 771 0.924
Musashi (Msi1) Msi1 1421409_at.A Not found Not found 2
Sox-1 Sox1 1438729_at.B 542 0.958
Sox-2 Sox2 1416967_at.A 71 0.986
[79] Muscle specific MCK (muscle creatine kinase) Ckm 1417614_at.A 104 1.000
MHC (myosin heavy chain) Myh4 1427026_at.A Not found Not found
Myofiber sarcolemma Dystrophin Dmd 1417307_at.A 835 0.958
Basal lamina Laminin
a
-
Myogenic lineage Myf5 Myf5 1420757_at.A Not found Not found
MyoD Myod1 1418420_at.A 32 1.000
Late myogenic lineage MRF4 Myf6 1419150_at.A Not found Not found
Myogenin Myog 1419391_at.A 104 1.000
Satellite cells Pax7 Pax7 1452510_at.A Not found Not found
[80] Neural restricted precursors MAP2 Mtap2 1434194_at.B 108 1.000 2
Beta3 tubulin Tubb3 1415978_at.A Not found Not found
[81] SKP Fibronectin Fn1 1426642_at.A 681 0.984
GAP43 Gap43 1423537_at.A 363 0.959
MAP2 Mtap2 1434194_At.B 108 1.000 2
Nestin Nes 1449022_at.A 73 0.980 2
p75NTR Ngfr 1421241_at.A Not found Not found
Vimentin Vim 1450641_at.A 770 0.977
[82] Hematopoietic stem cell BCRP1 Abcg2 1422906_at.A Not found Not found
Epidermal side population BCRP1 Abcg2 1422906_at.A Not found Not found 3
alpha6-integrin Itga6 1422444_at.A Not found Not found 2
beta1-integrin Itgb1 1426918_at.A 13 0.967 2
keratin 14 Krt1-14 1460347_at.A 386 0.983
Sca-1 Ly6a 1417185_at.A 637 0.929 2
Genome Biology 2007, Volume 8, Issue 9, Article R193 Krzyzanowski and Andrade-Navarro R193.7
Genome Biology 2007, 8:R193
CD34- CD34 1416072_at.A 72 0.990 2
E-cadherin Cdh1 1448261_at.A 48 0.993
Keratin 19 Krt1-19 1417156_at.A 268 0.989 2
CD71- Tfrc 1452661_at.A 845 0.958
[83] Muller glia; retinal Gln synthetase Glul 1426235_a_at.A 573 0.901
Retinal syntaxin
a
-
Pax6 Pax6 1419271_at.A 374 0.960
rhodopsin Rho 1425171_at.A Not found
[84] Neural (NeuN) Neuron specific protein ? -
Neuron-specific enolase Eno2 1418829_a_at.A Not found Not found -
Osteoblasts Alkaline phosphatase Akp2 1423611_at.A Not found Not found -
BMP2 Bmp2 1423635_at.A Not found Not found -
BMP4 Bmp4 1422912_at.A Not found Not found -
BMP Receptor 1 Bmpr1a 1425492_at.A 581 0.939
Bmpr1b 1437312_at.B 446 0.917
BMP Receptor 2 Bmpr2 1434310_at.B 602 0.954
PTH receptor Pthr2 1452129_at.A Not found
Type 1 collagen
a
-
bone sialoprotein Ibsp 1417484_at.A Not found
PTH receptor Pthr1 1417092_at.A 368 0.964
RunX-1 Runx1 1422865_at.A 295 0.982
osteonectin Sparc 1448392_at.A 581 1.000
osteopontin spp1 1449254_at.A 737 0.996
General stem cell factor receptor CD117 Kit 1459588_at.B 243 0.912
Muscle merosin Lama2 1426285_at.A 799 0.986
Cartilage related extracellular matrix aggrecan Agc1 1449827_at.A Not found Not found -
collagen II
a
-
collagen IV
a
-
PRELP Prelp 1416322_at.A 231 0.958
Adipose derived stem cell CD49d+ Itga4 1421194_at.A Not found Not found -
CD106- ? -
[85] Mammary stem cell Bmi-1 Bmi1 Not on array
p21 Cdkn1a 1424638_at.A 400 0.967
CD49f Itga6 1422444_at.A Not found Not found 2
Cytokeratin 19 Krt1-19 1417156_at.A 268 0.989 2
Sca-1 Ly6a 1417185_at.A 637 0.930 2
Musashi (Msi1) Msi1 1421409_at.A Not found Not found 2
Cytokeratin 5/6 ? -
[86] Neural enrichment CD24 CD24a 1416034_at.A 573 0.990 2
Skin CD29 Itgb1 1426918_at.A 13 0.970 2
[87] Neural GFAP Gfap 1426508_at.A 249 0.924
Neurofilament Nefl 1426255_at.A 151 0.935
Nestin Nes 1449022_at.A 73 0.980 2
Photoreceptors Recoverin Rcvrn 1450215_at.A Not found Not found -
Epithelial lineage Cytokeratin (904-clone 34betaB4?)
a
-
CK18 Krt1-18 1448169_at.A 83 0.917
AE1 Slc4a1 1416464_at.A 41 1.000
[88] Epithelial lineage AE3 Slc4a3 1418485_at.A 391 0.931
Note that some markers may be included in multiple rows of the table (as many as indicated in the right-most column), because a number of genes have been identified as
markers of more than one cell type (for example, Abcg2 for hematopoietic and neural cells [78,82], or Nestin for neural and skin-derived precursors [SKPs] [81,87]). Some of
the markers could not be assigned to an Entrez gene either because the marker name was ambiguous (indicated by '
a
') or was absent from the database of gene names
(indicated by '?'). Patterns can be examined online via the web server [21]. All patterns for which a polled probe set is a marker can also be examined at the web server. Note
that the chip containing the probe set is indicated by '.A' or '.B' appended to the identifier, because some probe sets are included in both the MOE430A and the MOE430B
chips.
Table 2 (Continued)
Stem cell markers
R193.8 Genome Biology 2007, Volume 8, Issue 9, Article R193 Krzyzanowski and Andrade-Navarro />Genome Biology 2007, 8:R193
expressed in both (Additional data file 3). This indicates not
only that a single gene can be involved in multiple stem cell
differentiation lineages but also that if it does then it will most
often act in a similar way across those lineages.
This set allowed us also to study stem cell evolution. We were
interested in determining whether there would be a relation
between sequence similarity and involvement in stem cell
function and involvement in one or many lineages. Large
gene families with frequent duplication and reuse are valua-
ble in these investigations because the members will have var-
ying degrees of sequence similarity. Our set of stem cell
markers provides a starting point to search for these families.
To identify superfamilies within our set of stem cell markers,
we performed an exhaustive pairwise sequence comparison
of the protein sequences of the 426 stem cell markers (see
Materials and methods, below, and Additional data file 3).
Manual examination of the results to select full length simi-
larity identified four superfamilies containing three or more
members: serpins (cluster #18 in Additional data file 3), the
nuclear receptor family (cluster #4), the cytochrome P450
family (cluster #17), and the Rab family GTPases (cluster
#10). As serpins are described above, we opted to investigate
further members from the additional families within the con-
text of gene evolution in relation to stem cell function and
expression pattern (Figure 5).
Nuclear receptors: Nr2f2
The proteins of the family of nuclear steroid and hormone
receptors are dimerizing transcription factors characterized
by a DNA binding domain and a carboxyl-terminal hormone
binding domain; they are implicated in cell proliferation, dif-
ferentiation, and apoptosis [34]. Three members of this
family were identified in the set of 426 stem cell markers
(Nr2f2, Essrb, and Rora). We examined Nr2f2 in greater
detail.
Nuclear receptor subfamily 2, group F (Nr2f)2/COUP-TF2
represses Notch signaling activity in determination of vein
identity [35], but it is also expressed in multiple tissues and
organs of the embryo and is required for early outgrowth of
limb buds [36]. In our set of samples, probe set 1416159_at,
which detects this gene's transcript, segregates the V6.5 dif-
ferentiated murine embryonic stem cell (mESC) sample from
the rest (Figure 6). The 80% identical Nr2f1/COUP-TF1
(detected by probe set 1418157_at) segregates the samples of
retinal spheres, neurospheres, and 10 T1/2 embryonic fibrob-
lasts, but not any of V6.5 or other mESC samples, differenti-
ated or not. By contrast, the probe sets for another close
paralog Nr2f6/COUP-TF3 (1460647_a_at and 1460648_at)
were not identified as markers.
The genes nr2f1 and nr2f2 share a common ancestral gene
that is represented in the fly. The Drosophila homolog of
nr2f1 and nr2f2, svp (seven up), regulates stem cell identity
of neuroblasts in order to control the identity of differentiated
progeny cells [37]. In this case, there is a conservation of
involvement in stem cell function from the divergence
between Protostomia and Deuterostomia. Phylogenetic
analysis (Figure 5) indicates that the gene is conserved as a
single copy, possibly until divergence of Gnathostomata. All
Teleostei appear to have the duplicated version of the gene.
However, the patterns of gene expression in stem cells are
very different (Figure 6), indicating the specialization of the
duplicated copies of the gene.
Cytochrome P450 family: Cyp1b1
Cytochrome P450 proteins (CYPs) are a family of enzymes
that are present in bacteria and Eukarya that participate in
the metabolism of exogenous or endogenous chemicals
[38,39]. Four members of this gene family were identified in
the set of 426 stem cell markers (Cyp1b1, Cyp24a1, Cyp4f18,
and Cyp7b1). All four were highly expressed in various differ-
entiated cells and expressed at a low level in their undifferen-
tiated counterparts. We conducted a detailed analysis of
Cyp1b1.
Phylogenetic analysis of Cyp1b1 (Figure 5) suggests the exist-
ence of two very close paralogs: Cyp1a1 and Cyp1a2. No equiv-
alent sequence in the Drosophila genome (or in any other
Protostomia) was identified, but the Echinodermata Strong-
ylocentrotus purpuratus (purple sea urchin) appears to have
an ancestral Cyp1a/b gene (with four copies, possibly
Precision/Recall curves for genes selected by the gap method and k-meansFigure 3
Precision/Recall curves for genes selected by the gap method and k-means.
Precision/recall curves in red are associated with the gap method, and the
point marked with a circle denotes the precision/recall associated with
patterns associated with 63 probe sets or less. Gray curves show
precision/recall for all replicates of k-means clustering, and the average
expected precision/recall curve is shown in black. Recall values are based
on the 71 stem cell markers defined in Table 2, whereas precision is the
fraction of marker genes identified in the total number of predicted
marker genes.
Precision
0.0 0.2 0.4 0.6 0.8 1.0
90% cutoff
95% cutoff
85% cutoff
k-me
a
ns average
k-means replicates
0.005
0.010
0.015
0.020
0.025
0.030
Recall
Genome Biology 2007, Volume 8, Issue 9, Article R193 Krzyzanowski and Andrade-Navarro R193.9
Genome Biology 2007, 8:R193
duplicated after its divergence from Chordates). The ances-
tral gene appears to have duplicated before divergence of
Actinopterygii from Sarcopterygii into the 1a and 1b forms,
and the subsequent duplication of the 1a form appears to be
absent in Sauropsida (for example, chicken) but present in all
mammals (for example, opossum). In birds Cyp1a seems to
have undergone a separate duplication after divergence from
mammals.
In our set, Cyp1b1 segregates differentiated osteoblast cells
and differentiated mammospheres from the rest of the data-
set. Cyp1b1 metabolically activates estradiol (to produce 4-
hydroxy estrogens), which are able to induce estrogen recep-
tors, and mutation of Cyp1b1 may stimulate estrogen-medi-
ated carcinogenesis [40]. It has also been suggested that
Cyp1b1 is involved in axis control during embryonic develop-
ment [41].
Heatmap indicating the distribution of patterns for markersFigure 4
Heatmap indicating the distribution of patterns for markers. The horizontal axis shows 241 mouse samples used in this study. The vertical axis shows
patterns for 1,301 markers either predicted to have high reliability (scoring 100%, n = 1,252; blue) or probe sets belonging to genes ascribed marker roles
based on evidence in the literature (n = 49; yellow). Rows were clustered and diagonalized. Vertical separators were used to distinguish major sample cell
types. Sample identities are grouped as follows: embryonic, blue; P19 embryonal carcinoma, orange; fibroblasts, purple; spheres, yellow; hematopoietic,
red. Gene names are indicated only for the 49 stem cell markers.
R193.10 Genome Biology 2007, Volume 8, Issue 9, Article R193 Krzyzanowski and Andrade-Navarro />Genome Biology 2007, 8:R193
By examination of the larger set of markers, we can see that
Cyp1a1 is a muscle stem cell marker, but its paralog, Cyp1a2,
does not behave as a marker in our dataset. This is supported
by the observation that Cyp1a2
-/-
null mutant mice develop
normally with just some deficiencies in drug metabolism
[42]. To the contrary, Cyp1a1 is potentially involved in many
cancers and might also have a function in murine embryonic
development [43]. CYP1A2 is one of the major CYP1 enzymes
that catalyze 2-hydroxylation of estrogen [44], but the sub-
strate of CYP1A1 is not yet known.
Cyp1a1 and Cyp1a2 are transcribed from the same bidirec-
tional promoter region [45]. Their head-to-head arrangement
is conserved in mammalian genomes, which suggests that the
genomic organization of these genes is of functional signifi-
cance. The fact that these two genes have different behavior as
stem cell markers indicates that there are factors uncoupling
their expression.
Rab family of GTPases: Rab3d
The Rab family of small GTPases are involved in intracellular
cell signaling processes, including tethering and docking of
vesicles to their target compartment, vesicle budding, and
interaction of vesicles with cytoskeletal elements [46].
According to SMART (Simple Modular Architecture Research
Tool; 4 April 2007), there are 66 mouse Rab proteins (defined
as containing a Rab domain and no other annotated domain).
We identified three members of this family in the set of 426
stem cell markers (Rab3d, Rab31, and Rab38). RhoJ was
detected by sequence similarity but discarded after manual
examination because it belongs to a different family. We per-
formed a detailed analysis of Rab3d. In our set of markers
Rab3d expression segregates mast cell precursors. None of its
paralogs, Rab3a, Rab3b, and Rab3c, was identified as a
marker by our methodology.
The ancestral Drosophila gene, Rab3, is expressed in the
nervous system [47]. Echinodermata Strongylocentrotus
purpuratus has only this ancestral gene (Figure 5), but all
Teleostei have four copies of the gene, suggesting duplication
after the divergence of Chordata and Echinodermata.
In agreement with Rab3 expression patterns in the fly, the
four Rab3 paralogs are expressed in mouse brain, where they
regulate vesicular release; genetic deletion of individual par-
alogs does not affect viability or fertility in mice, but knockout
of all four genes results in early perinatal mortality [48].
However, these genes are expressed elsewhere. For example,
Rab3a is detected in acrosomal membranes of mouse sperm
[49]. Rab3d is expressed in the exocrine pancreas and the
parotid gland, where it is involved in secretory granule matu-
ration [50]. Finally, Rab3b and Rab3d are expressed in mast
cells [51], which explains our observation that Rab3d segre-
gates mast cell precursors.
Early B-cell factors: Ebf2 and Ebf3
In each of the four superfamilies analyzed above (serpins,
nuclear receptors, cytochrome P450, and Rab GTPases), we
note that most members exhibited the same gene expression
behavior along differentiation (being highly expressed in
either stem cells or in their differentiated counterparts).
However, this is not the general case. If we consider all 49
clusters of protein sequences (Additional data file 3), about
half (26 of 49 [53%]) have some family members that are
Table 3
Gene Ontology terms of marker sets
All Selected set High in differentiated GO GOID
N1 N2 P2 N3 P3
7,478 4,449 222 Total
976 727 2.85 × 10
-22
81 1.60 × 10
-16
Extracellular region GO:0005576
169 131 0.001824 17 0.009344 Extracellular matrix GO:0031012
72 57 >1 12 0.00106 Enzyme inhibitor activity GO:0004857
2,061 1,390 8.07 × 10
-15
73 >1 Membrane GO:0016020
865 618 2.44 × 10
-11
25 >1 Signal transducer activity GO:0004871
587 421 4.00 × 10
-7
15 >1 Receptor activity GO:0004872
925 637 8.62 × 10
-7
43 >1 Multicellular organismal development GO:0007275
312 235 6.34 × 10
-6
16 >1 Defense response GO:0006952
911 614 0.000403 32 >1 Cell communication GO:0007154
270 201 0.000485 17 >1 Cell adhesion GO:0007155
436 310 0.000596 18 >1 Organ development GO:0048513
Column labels are as follows: N1 is the number of genes for a Gene Ontology (GO) category in the unselected marker set; N2 and P2 are the
number of genes and P value for the smaller marker set; N3 and P3 are the number of genes and P value for the markers highly expressed in
differentiated stem cells; GO is the description of the GO term; and GOID is the GO identifier. P values are computed using the 'All' set of markers
as background. GO terms displayed if they represent more than ten genes have at least one associated P value below 0.01 and do not overlap more
than 80% with another displayed term.
Genome Biology 2007, Volume 8, Issue 9, Article R193 Krzyzanowski and Andrade-Navarro R193.11
Genome Biology 2007, 8:R193
highly expressed in stem cells and others that are highly
expressed in the differentiated counterparts; the remaining
23 are highly expressed in stem cells (10) or are highly
expressed in differentiated cells (13). An example of the
former is given by the two early B-cell factors Ebf2 and Ebf3,
which we study here in detail.
The four mouse members of the Ebf family of helix-loop-helix
transcription factors have non-redundant adipogenic poten-
tial in multiple cellular models [52]. Interestingly, both Ebf2
and Ebf3 are detected in our set, but with opposite effects.
Ebf2 is upregulated in mammospheres and Ebf3 in differen-
tiated mammospheres. The other two mouse members of this
family, namely Ebf1 and Ebf4, are detected in the selected
marker set. Ebf1 (probe set 1416301_a_at) is identified as
segregating several bone marrow samples. Ebf4 (probe set
1435044_at) is identified as segregating differentiated V6.5
mESCs [53]. This family constitutes an example of genes aris-
ing by duplication of an ancestral gene (represented in Dro-
sophila by the Collier/knot transcription factor, which is
involved in Hedgehog patterning [54] and control of
hematopoiesis [55]), with multiple and varied stem cell
related functions arising as the gene duplicates.
Discussion
We have developed an unsupervised approach to identifying
coordinately acting biomarkers using heterogeneous micro-
array data, which can be generalized to any set of gene expres-
sion data regardless of the platform on which they were
generated. This method is a ground-up approach that first
determines the extent of the information available in a set of
array data through a discretization step to classify samples
Phylogenetic distribution of stem cell markers and their close paralogs in four protein familiesFigure 5
Phylogenetic distribution of stem cell markers and their close paralogs in four protein families. Major taxa along the Coelomata lineage are depicted in bold
black text with deduced numbers of genes from these families in parentheses. Phylogenetic relations between species were taken from the National
Center for Biotechnology Information's Taxonomy Browser, except for the relation between Cephalocordata and Urochordata, which was taken from
Vienne and Pontarotti [72]. Species names are given in italic black text. Colored text indicates paralogs for four families: red for cyp1, orange for ebf, blue
for nr2f1, and green for rab3. Numbers in parentheses indicate multiple copies of gene (for example, in Actinopterygii genes). Many genes are duplicated in
Actinopterygii because of a whole-genome duplication event postulated to have occurred along the ray-finned fish lineage [73]. Most expansion of these four
families occurs after divergence of Deuterostomia and before divergence of Teleostei. Underlined genes for mouse indicate genes identified in the selected
marker set. The database identifiers of the sequences are given in Additional data file 4. The inset on the lower right corner shows schematic phylogenetic
trees for the murine members of the four families. All branches shown had bootstrap values above 0.5. Outlier sequences used for each family (not
displayed): D. melanogaster rab3 for rab3, S. purpuratus cytp1 for cytp1, D. melanogaster svp for nrf2f1, and D. melanogaster knot for ebf.
Coe
l
omata (3)
D
e
u
t
e
r
o
s
t
o
m
i
a
(
4
)
P
r
o
t
o
s
t
o
m
i
a
Drosophila
M
e
t
a
t
h
e
r
i
a
(
1
3
)
M
o
u
s
e
/
h
u
m
a
n
/
c
o
w
/d
o
g
E
u
t
h
e
r
i
a
Opossum
M
a
m
m
a
l
i
a
(
1
2
)
S
a
u
r
o
p
s
i
d
a
G
a
l
l
u
s
A
m
n
i
o
t
a
(
1
1
)
X
e
n
o
p
u
s
A
m
p
h
i
b
i
a
S
a
r
c
o
p
t
e
r
y
g
i
i
(
1
1
)
D
a
n
i
o
/
Tetraodon
A
c
t
i
n
o
p
t
e
r
y
g
i
i
C
h
o
r
d
a
t
a
E
c
h
i
n
o
d
e
r
m
a
t
a
S
t
r
o
n
g
y
l
o
c
e
n
t
r
o
tu
s
C
r
a
n
i
a
t
a
U
r
o
c
h
o
r
d
a
t
a
C
i
o
n
a
H
y
p
e
r
o
a
r
t
i
a
P
e
t
r
o
m
i
z
o
n
G
n
a
t
h
o
s
to
m
a
t
a
C
h
o
n
d
r
i
c
h
t
h
y
e
s
T
e
l
e
o
s
t
e
i
(
1
1
)
S
c
y
l
i
o
r
h
i
n
u
s
C
e
p
h
a
l
o
c
h
o
r
d
a
t
a
B
r
a
n
c
h
i
o
s
to
m
a
rab
3b
rab3a
rab
3c
r
ab
3
d
n
r
2f1
nr2f2
e
b
f1
ebf3
e
b
f4
eb
f
2
cy
p
1a1
cy
p
1a
2
c
y
p1
b
1
nr2f1,nr2f2nr2f1, nr2f2
nr2f1,
nr2f2
nr2f1,
nr2f2
nr2f1, nr2f2COUPCOUPsvp
rab3a, rab3b,
rab3c, rab3d
r
ab3a, rab3b,
rab3c, rab3d
rab3b,
rab3c
rab3b,
rab3c
rab3a (2)
,rab3b,
r
ab3c?, rab3d (2)
?rab3ra
b3
ebf1
,ebf2,
ebf3, ebf4
ebf1, ebf2, ebf3
ebf1,
ebf2, ebf3
ebf2,
ebf3
e
b
f
1(2),
ebf2 (2), ebf3
?ebf
C
oll
ier/k
n
ot
cyp1a1
,cyp1a2,
cyp1b1
cyp1a1, cyp1a2,
cyp1a?, cyp1b1
cyp1a (2),
cyp1b1
cyp1a
c
y
p
1a (2),
cyp1b1 (2)
?cyp1a/b (4)
R193.12 Genome Biology 2007, Volume 8, Issue 9, Article R193 Krzyzanowski and Andrade-Navarro />Genome Biology 2007, 8:R193
and initialize patterns. Genes are then associated with pat-
terns based on the presence of a clear demarcation threshold
in their expression values, which can reproduce the classifica-
tion of samples. These genes can therefore act as markers for
the samples segregated in the subset.
Microarray technology has followed a trend toward increased
feature density and increased coverage, and is customarily
used to address large exploratory questions. Our develop-
ment of this method was motivated by the desire to present
experimental groups with information that clearly shows
which genes differentiate samples of interest within the larger
context of many samples in the database (for instance, which
genes are upregulated in my samples of interest?), and what
other samples are similar to these samples of interest (in
which other samples are these genes upregulated?).
By identifying probe sets that exhibit bimodal expression
level patterns, we directly cater to researchers wishing to
assess the significance of particular genes in conditions of
interest through methods such as polymerase chain reaction
or northern blotting. The interactive graphical presentation
of expression values as distributions is exceptionally effective
for assessing the ease with which a proposed marker gene
might be validated, and the samples that it can be used to
identify.
In the application we present, our approach focuses on probe
sets. As genome annotations have changed, probe set annota-
tions may be altered, changing the probe set to gene mapping
or the annotated gene functions. This is understood to be an
intrinsic problem in array design [56], and many probe sets
on Affymetrix arrays are of unknown identity or are sparsely
annotated. However, these obstacles do not render a probe
set useless for the purposes of marker identification, because
each probe set has a target sequence that is fixed at the time
of array design. This sequence can be used to detect the
molecular RNA species that is acting as a marker. Further-
more, the obvious inference when using cDNA microarrays is
that the associated genes can function as markers at the pro-
tein level. Identification of a marker probe set implies the
existence of a molecule (mRNA or protein) that can poten-
tially be used as a molecular marker to discriminate between
cell types. Even if probe set annotations are missing or
inaccurate, follow-up experiments can be performed to vali-
date or identify the molecules involved and determine
Sample segregation for selected markersFigure 6
Sample segregation for selected markers. Samples segregated in the high expression group for probe set markers from the nuclear receptor (nr2f1 and
nr2f2), cytochrome P450 family (cytp1a1 and cytp1b1), serpin family (Serpins a1b, a3g, a3n, b9, g1, and h1), and Rab GTPase (rab3d) superfamilies. The
nr2f1/nr2f2 and cytp1a1/cytp1b1 gene pairs are highly similar in sequence but their expression patterns are notably different. Undifferentiated and
differentiated sample pairs are shaded in pink and blue, respectively.
Genome Biology 2007, Volume 8, Issue 9, Article R193 Krzyzanowski and Andrade-Navarro R193.13
Genome Biology 2007, 8:R193
whether development of an mRNA or protein molecular
marker is feasible.
Our gap method stands apart from existing methods of
microarray clustering. Standard clustering algorithms such
as hierarchical or k-means clustering have two commonly
raised impediments. The first is that both methods group
genes based on global similarity of expression patterns. That
is a restrictive test, which is not necessarily useful in the
search for a marker. Second, and more importantly, both
methods assign each gene and condition to a single cluster,
which may not always be desirable. Proteins can have
multiple functions in different contexts. In general, these
clustering methods are best used when trying to identify co-
regulation or co-expression of genes in a series of samples
that are relatively homogeneous. In contrast, we are striving
not to identify strict co-expression of many genes on a global
level but, rather, to identify sets of genes with expression level
thresholds that demarcate similar sets of samples in a heter-
ogeneous microarray dataset. This selection procedure is
more appropriate to the selection of markers.
Previously established methods also study gene expression
values across sets of samples to identify biomarkers. Our
method has some differences from those methods that we
believe make it more useful for some applications. The meth-
ods from Pepe and coworkers [57], SAM (significance analy-
sis of microarrays) [10], and PAM (prediction analysis for
microarrays) [58] require the investigator to separate the
samples into two classes; this might be appropriate for simple
situations but it would be cumbersome for a dataset with mul-
tiple cell types and conditions, especially if a researcher is
exploring novel ways to arrange the data. Our unsupervised
classification method is more appropriate for such a case.
Like our method, the method presented by Beattie and Rob-
inson [59] can produce patterns in an unsupervised manner.
However, the binary patterns are obtained through an analog
to digital transformation via a one-dimensional clustering
step. We believe that our use of a threshold value to discover
binary patterns is more intuitive for experimental biologists,
and will simplify the development of following validation
studies. As explained above, a clear demarcation of expres-
sion level between the two groups influences the decision for
follow up more than the overall structure of the data in each
state. Ideally, we would like to present candidates that also
exhibit large fold changes with high statistical significance.
The logic of using a threshold value that is directly related to
the relative mRNA concentrations represents a margin of
safety for the detection of differential expression, and is com-
monly illustrated by the use of a 'twofold rule' in the litera-
ture. Put simply, a biologist is more likely to follow up on a
candidate marker that has clear separation of expression
level, over other candidates that may have better statistical
support but would pose a challenge for validation because of
a tight range of expression.
Furthermore, the approach of Beattie and Robinson [59]
assembles clusters by combining genes that generate identi-
cal binary patterns. Our observations indicate that the level of
noise in gene expression data must be accounted for and
some degree of fuzziness must be allowed in any analysis.
Essentially, one stray sample should not ruin the association
of two genes across a large number of samples (here, 83).
Logically, the possibility that such stray hybridizations are
encountered increases with increasing dataset size. One such
example is illustrated in Figure 1a. We believe that cluster for-
mation by a measure of discrimination that is more resilient
to small degrees of overlap in the distributions (caused by
experimental error) will yield more fruitful results and that
adhering to matches between digital patterns for cluster for-
mation may be unnecessarily strict. The original data can be
always retrieved and a closer examination can be used to ver-
ify whether the classification suggested by each probe set is
true. This allows genes to be detected as markers of similar
patterns.
To illustrate the usefulness of our methodology in cases in
which unsupervised patterns with resilience to noise are
needed, we applied the method to a database of 83 samples
from a variety of mouse stem cells and derivatives. Our results
indicate that this method produced a list of candidate mark-
ers (selected marker set) that was fivefold enriched for a set of
71 known stem cell markers; we identified 45 of these while
reducing the total number of probe sets under consideration
from 45,137 to 5,848.
To verify the performance of our method, we clustered the
dataset using k-means, a standard clustering algorithm (see
Materials and methods, below), and found the precision and
recall values to be similar. The overlap of results with the k-
means clusters was appreciable (69.8%). However, our
method cannot be considered as simply a duplication of the
results of k-means, because our method groups genes by their
ability to segregate the database and not by the similarity of
their patterns of expression. Another important difference is
that our method generates groupings of samples while identi-
fying markers - something that k-means lacks. If one were to
choose to develop marker genes from the results generated
with k-means, a subsequent analysis of the expression profile
in each k-means cluster would be required to identify the
samples in which the cluster of genes might be more highly
expressed. This can be done with a single set of genes but
would require an additional automated method to process all
k-means clusters if a meta-analysis were desired (such as our
identification of genes related to differentiation in multiple
cell types). Thus, the gap method presented here provides
important additional data that is useful for a variety of subse-
quent explorations.
The selected marker set of genes was enriched in genes with
particular features: products located on the exterior of the
cell, and functions related to cell communication and differ-
R193.14 Genome Biology 2007, Volume 8, Issue 9, Article R193 Krzyzanowski and Andrade-Navarro />Genome Biology 2007, 8:R193
entiation (Table 3). This could be expected because our col-
lection of data contains samples from diverse cells and
tissues, and cell identity is mostly related to the cell surfaces
and to the ways in which cells interact with their
environment, including communication with other cells. In
addition, because our dataset is enriched for differentiating
tissues, a number of major functions related to development
appeared in the list.
Although the selected set of markers is somewhat biased
toward the objectives of analysis of stem cells, it also includes
markers that, for example, distinguish one lineage from
another (for instance, adult versus embryonic expressed
genes). Our methodology facilitates focusing attention
toward markers for samples that one is interested in. Here,
we focused a more detailed analysis on markers segregating
at least one of a short list of six differentiation lineages from
the set of 83 samples. The use of these 83 samples as back-
ground increases the likelihood of identifying such specific
markers.
A total of 426 genes were identified as stem cell related mark-
ers for the six differentiating lineages. Functional analysis
revealed fewer statistically over-represented functions than
in the selected set of markers. Analysis of the 222 genes seg-
regating the differentiated samples (Table 3) revealed that the
only over-represented GO annotations also significant for the
selected set of markers were the association of genes to the
extracellular region and the extracellular matrix. It is known
that extracellular interactions are important between stem
cells, their progeny, and their immediate environment in the
maintenance of the stem cell state, control of stem cell popu-
lations, and associated progeny [23]. The one GO annotation
over-represented only in this set was enzyme inhibition (for
12 genes). This annotation is represented in the list by five
members of the serpin superfamily. A literature search sug-
gests that these genes may play a role in suppression of
immune system effects against differentiating cells. The
absence of other functional enrichments suggests that there
may be no specific gene function that endows cells with the
property of 'stemness', in the same way that there appears to
be no single stemness gene for all stem cells [60].
This set of 426 markers of stem cell differentiation allowed us
to make some general observations regarding stem cell func-
tion and evolution. First, we observe that if a gene is a marker
for differentiation in multiple lineages, then it will act the
same way in most cases. Of the 17 genes identified as markers
in multiple lineages, only two were found to be highly
expressed in one differentiated population and in another
undifferentiated population.
To examine whether patterns of expression in stem cells were
retained for gene homologs, we studied gene families repre-
sented in the set of markers. Identification of 49 clusters of
related protein sequences indicated that gene expression
behavior was not conserved within those families because
more than half of the clusters (26) included genes with con-
flicting gene expression segregation properties. However, we
also wanted to study how expression patterns in stem cells
were conserved with protein sequence identity. For this we
looked for the largest families within the set that reflect a
large number of gene duplication events and therefore offer
multiple levels of sequence identity between their members.
We selected four families with two to four true paralogs in the
marker set: nuclear receptors, cytochrome P450s, Rab
GTPases, and early B-cell factors. These superfamilies share
general functional activities, but they have obtained addi-
tional functional or tissue specificities through mutation and
selection following gene duplication. Phylogenetic analysis of
one example from each family (Figure 5) led to the study of
the evolution of a total of 13 genes. An ancestral gene existed
for each of the four families before divergence of Deuterosto-
mia, with three being present in the Protostome D. mela-
nogaster (knot, rab3, and svp). The genes svp and knot are
involved in stem cell differentiation. The two genes arising
from duplication of svp and the four genes arising from dupli-
cations of
knot are all detected as markers in our selected
marker set. Similar observations are made for the gene
Cyp1a/b; this gene underwent two duplications to produce a
family of three genes, with two involved in differentiation and
identified in our set of markers. We propose that the ancestral
versions of this gene (for example, in S. purpuratus) are
involved in differentiation. The Rab3 family illustrates a case
in which duplication of an ancestral gene (which has synaptic
functions in D. melanogaster) produces Rab3d, which plays
a role in mast cell development, and Rab3a/Rab3b/Rab3c,
which we do not identify as differentiation-related markers.
The four murine genes conserve some neural function like
that of the ancestral Rab3, but they appear to have obtained
other functions and tissues in which they are expressed.
Based on the results above we can hypothesize that the dupli-
cation of a gene involved in a development related function is
likely to result in genes that are also involved in development.
Our second observation is that, in contrast, the range of
expression is not necessarily conserved between close para-
logs. Ebf2 and Ebf3, for example, are highly expressed in
undifferentiated and differentiated mammospheres,
respectively. Other cases can be observed in Figure 6. We did
not identify redundant markers, that is, paralogous genes
with the same segregation properties.
Our third observation is that clusters of genes with stem cell
related functions appeared during a window of evolutionary
time. Expansion of gene families associated with develop-
mental functions is demonstrated by the number of paralogs
of each family present in different organisms (Figure 5). Of 13
genes from the four families, three are present in Drosophila
(svp, Rab3, and knot), four in S. purpuratus (COUP, an
ancestral version of Cyp1a/b, Rab3, and an ancestral Ebf),
and probably 11 in Teleostei. By the time of the Metatherian
Genome Biology 2007, Volume 8, Issue 9, Article R193 Krzyzanowski and Andrade-Navarro R193.15
Genome Biology 2007, 8:R193
divergence, all 13 genes are present and there are no subse-
quent duplications. A substantial portion of gene family
expansions was complete by the divergence of Teleostei from
Chondrichthyes, which agrees with our previous phylogenetic
analysis of genes involved in mESC differentiation [61]. The
implication of this is that use of model organisms such as
Danio rerio (zebrafish) and Xenopus in stem cell research
may yield insights that can be translated into mammalian sys-
tems, provided that the appropriate paralogous genes are
chosen for study. Our analysis also suggests that the comple-
tion of the genomes of members of the Urochordata, Cepha-
lochordata, Hyperoartia, and Chondrichthyes taxa will
provide great insight into the evolution of genes that are
involved in the regulation of cellular and tissue complexity, in
particular of those genes related to stem cell differentiation.
With this analysis we identified many stem cell specific mark-
ers in parallel, allowing us to establish some concepts regard-
ing the evolution of stem cells. This demonstrates the value of
the new tools described in this work. The study of genes from
our marker lists will allow identification of mechanisms and
cell populations that together contribute to stem cell function
in a variety of different tissues.
Conclusion
We have demonstrated a method for detection of markers
from heterogeneous collections of samples of DNA microar-
ray data of gene expression. We have applied this method to a
highly heterogeneous set of stem cell gene expression data,
with the objective being to detect markers relevant to stem
cells, which a specific contextual question. The gap method
detected markers through the unbiased generation of second-
ary data, which facilitated directed analysis of the results.
We believe that our method is more appropriate for the iden-
tification of targets for biomarker development than standard
analytical techniques such as hierarchical clustering, when
applied to DNA microarray data. The gap method is generally
applicable to other large heterogeneous datasets in which one
desires to find markers that act in a small proportion of the
samples.
Materials and methods
Environment
Manipulation of data and statistical calculations were per-
formed in the R language (version 2.3.1), available over the
internet [62]. Packages implemented for biologic applications
are available from the Bioconductor project [63], which runs
in the R computing environment.
Source of experimental data
Raw data in the form of Affymetrix CEL files for the appropri-
ate samples were obtained from StemBase [64]. A subset of
mouse samples based on the MOE430A/B DNA chip set was
selected, encompassing samples from embryonic and adult
stem cells and their derivatives. Expression values were gen-
erated from .CEL files using the GCRMA package [65] imple-
mented in Bioconductor. Initial analyses allowed us to
identify some samples whose values were in general outliers
(because of nonstandard RNA preparation procedures).
These were discarded and the expression values were re-com-
puted with GCRMA on the reduced dataset. The data set used
here contained 241 replicates (unique chips) derived from 83
different samples (of unique biological origin; Table 1). The
expression signals were organized in a matrix with columns
for samples and rows for probe sets, with the entries in the
matrix representing the hybridization level.
Generation of database partitions
To identify possible permutations of partitions for the expres-
sion matrix, we used a strategy to identify individual probe
sets whose distribution of expression values appeared to have
a break in continuity (a gap). This was motivated by the
observation that known marker genes are expressed at two or
more obviously distinct levels (see the example for Nestin in
Figure 1a).
Briefly, for each probe set in the expression matrix, we
ordered the expression values and calculated the differences
between consecutive values. Large difference values suggest a
demarcation in the expression values for a particular probe
set, which may be the result of two underlying subpopulations
of samples. If the difference exceeds a cut-off value, samples
on either side of the gap are assigned to two groups (low/high
expression) and encoded as binary vectors. The cut-off value
used in this analysis was 50%, that is, a 1.5-fold difference,
which on a log2 scale translates to approximately 0.6 units.
This value was chosen to generate a number of partitions that
did not produce an excessive rate of false positive clusters (see
'Filtering marker lists by size and number of classified sam-
ples', below). Note that we consider the possibility of finding
more than one gap.
We used majority voting rules to correct each binary vector so
that all replicates of any given sample were either 0 or 1. Ties
were assigned a 0. For example, if two out of three replicates
were assigned a 1, then the remaining replicate was also
assigned a 1. This ensures that database queries corresponded
to the underlying vectors used in the analysis. These corrected
vectors were used to score probe sets in each cluster, and they
were also used to generate visualizations on the web server
associated with this work [21].
Identification of markers for each partition
We identified groups of probe sets that can act as markers for
each pattern of up/down regulation defined by the binary
patterns as follows. For each binary vector (which represents
one way of partitioning the database into two), we calculated
Mann-Whitney U scores for each probe set on the microarray.
The U statistics were calculated from the expression values in
R193.16 Genome Biology 2007, Volume 8, Issue 9, Article R193 Krzyzanowski and Andrade-Navarro />Genome Biology 2007, 8:R193
each group designated as highly expressed versus the expres-
sion values exceeding the 90
th
percentile of the group with low
expression. This modified U statistic is linearly correlated to
the partial area under the curve described by Pepe and
coworkers [57] at a false positive rate of 10% (data not
shown). The advantage of using the U-statistic here lies in its
decreased computational cost as compared with the calcula-
tion and integration of the area under the curve. The U scores
were converted into a percentage of their maximum value for
each group. Probe sets were ranked by these scores, and those
exceeding 90% of the maximum U score were saved as candi-
date markers for each binary vector. The choice of this thresh-
old was determined to produce satisfactory results according
to the precision/recall curves computed below.
For illustrative purposes, this section is the most computa-
tionally intensive step and requires approximately 30 CPU
hours to complete.
Filtering marker lists by size and number of classified
samples
Because our analysis examines thousands of probe sets, the
analysis above is likely to identify many non-significant
markers by chance. A simple way to eliminate those is to
accept only sample partitions that are identified by multiple
probe sets. To establish a lower threshold for the length of
marker list to be accepted, we generated marker lists using a
randomized version of the expression matrix. The expression
values for each probe set were randomly reassigned to sam-
ples in order to destroy their biologic ordering while individ-
ually maintaining their range and distribution. We then
generated marker lists for each binary vector as described
above. Approximately 98% of patterns formed from the rand-
omized matrix were associated with two or fewer probe sets,
suggesting that such patterns are likely to arise by chance.
Thus, in our analysis of the stem cell dataset we decided to
report only patterns associated with three or more probe sets.
We also observed that the patterns with the largest numbers
of probe sets identified major groups of tissue specific genes
and therefore were not useful because they reproduced obvi-
ous sample partitions. For example, a cluster of 242 probe
sets was identified that distinguished all blood related sam-
ples (hematopoietic and general bone marrow related) from
others in the database. We therefore did not report clusters
with more than 200 probe sets. This selection resulted in a list
of 893 patterns involving a total of 10,401 probe sets for 7,478
genes. We define this as the 'potential marker set' (Additional
data file 1).
Calculation of precision/recall curves
In order to assess the method's performance in detecting 71
known stem cell marker genes (Table 2), we gradually
decreased the upper limit of allowable cluster size in the data-
set and calculated precision/recall values on the sets of clus-
ters that passed the criteria at each step (Figure 3). This
analysis was used to choose a 90% cut-off for generating clus-
ters (used in 'Identification of markers for each partition',
above) with the gap method, and to define a smaller set of
markers (from the 705 patterns with 63 or fewer markers),
the 'selected marker' set (Additional data file 2).
Benchmarking of method with k-means clustering
In order to compare the gap method with an established
method of grouping genes, we identified clusters of probe sets
with k-means clustering according to their patterns of gene
expression. We specified 1,000 clusters, which is similar to
the number of clusters generated by the protocol described
above, and selected the genes classified in those groups. The
default algorithm for the 'kmeans' function in R was used. We
computed the precision/recall values for k-means clustering
by gradually decreasing the maximum allowable cluster size,
as above. Because the k-means algorithm is not deterministic,
to estimate the expected precision/recall we generated a
mean precision/recall curve from 100 repetitions of k-means
clustering. This curve is compared with curves generated
using our clustering method in Figure 3.
We compared the overlap between the sets of genes selected
using the gap method and k-means. For each of the k-means
control runs, we selected the genes from the set of clusters
that produced a recall of at least 45 known stem cell markers
(this is the approximate recall level in Figure 3). The overlap
between that k-means iteration and the gap method was com-
puted as the fraction of genes selected by both methods
divided by the total number of genes selected by either
method. The mean overlap between the gap method and all k-
means iterations was 69.8%.
Enrichment of Gene Ontology annotations
We examined the functions of genes associated with each pat-
tern by characterizing the enrichment of their GO annota-
tions [66]. Because many genes are represented on the array
by multiple probe sets, we mapped probes to their corre-
sponding Entrez GeneIDs and calculated functional enrich-
ment on a per gene basis. Affymetrix probe sets were mapped
to Entrez GeneIDs using the 11 April 2006 release of NetAffx
annotations [67]. Where probe sets had multiple GeneID
mappings, the first one was selected because we observed that
in the majority of such cases the first identifier tends to be the
only one with a published symbol as opposed to one that was
automatically generated. Links from GeneIDs to GO annota-
tions were obtained from [68] on 9 May 2006 and traced up
through the GO ontology to identify 'ancestral' terms. We cal-
culated the cumulative hypergeometric P values for each GO
annotation as per the method proposed by Tavazoie and
coworkers [69]. Raw P values were then subjected to a Bon-
ferroni correction to take into account the number of GO cat-
egories considered. These adjusted P values are reported in
this analysis. The analysis of GO enrichment in the selected
and high-in-differentiated sets of markers (Table 3) was done
using the potential marker set as background.
Genome Biology 2007, Volume 8, Issue 9, Article R193 Krzyzanowski and Andrade-Navarro R193.17
Genome Biology 2007, 8:R193
Representation of markers associated to samples
To generate an overview of the markers associated with dif-
ferent samples by the gap method represented in Figure 4,
binary patterns were clustered with complete linkage hierar-
chical clustering based on their Euclidean distances. Major
clusters were manually identified from the hierarchical tree
and assembled into groups. Each row group was then associ-
ated with the column that contained the maximum value of
the averaged binary vectors in the group. Row groups were
then arranged by increasing column numbers.
Analysis of protein families involved in stem cell
differentiation
We chose six pairs of samples from our database representing
undifferentiated and differentiated states of stem cells (Addi-
tional data file 3). We selected all probe sets segregating at
least one of those pairs with a score exceeding 99%. These
probe sets were mapped to RefSeq protein sequence IDs
based on NetAffx annotations dated 12 July 2006. The 488
selected probes mapped to 420 RefSeq protein IDs, and these
420 protein sequences were obtained from the National
Center for Biotechnology Information RefSeq database [70]
on 23 February 2007. Pairwise protein BLAST [71] (blastp)
was performed on this set of sequences and the expect ('e')
values were arranged into a pairwise matrix. Cells with no
observed protein hit were replaced with e = 1, and the diago-
nal was filled with e = 0. This matrix was converted to a binary
matrix by assigning 1 to cells containing an e value larger than
10
-6
and 0 to the remaining cells, which was then hierarchi-
cally clustered in R using binary distances for generation of
the distance matrix. Finally, we manually chose three illustra-
tive groups of genes after inspection of sequences and results.
Online search engine
Marker databases were created using the MySQL database
management system, with a web interface written in PHP.
Abbreviations
CYP, cytochrome P450 protein; Ebf, early B-cell factor; ESC,
embryonic stem cell; GO, Gene Ontology; HSC, hematopoi-
etic stem cell; mESC, murine embryonic stem cell; Nf2f,
nuclear receptor subfamily 2, group F.
Authors' contributions
PMK and MAA developed the method and prepared the
manuscript.
Additional data files
The following additional data files are available with the
online version of this paper.
Additional data file 1 includes the 10,401 probe sets in the
'potential marker' set. Additional data file 2 includes the
5,848 probe sets in the 'selected marker' set. Additional data
file 3 includes the 488 probe sets in 'stem cell related' set.
Additional data file 4 includes identifiers of the proteins used
in the phylogenetic analysis.
Additional data file 1The 10,401 probe sets in the 'potential marker' setColumns indicate Affymetrix probe set identifier (1 Affy id), chip set (2 chip), gene symbol (3 gene), and (4 patterns). A marker might be associated to multiple patterns, and those are encoded in column 4 using the marker server pattern identifier followed by the score for the pattern between brackets, with information for different pat-terns separated by a colon. Patterns can be retrieved at the marker server [21] using the marker server identifier or they can be queried with the Affymetrix probe set identifier.Click here for fileAdditional data file 2The 5,848 probe sets in the 'selected marker' setThe meaning of the columns is identical to that given for Additional data file 1.Click here for fileAdditional data file 3The 488 probe sets in 'stem cell related' setColumns indicate Affymetrix probe set identifier (1 Affy id), chip set (2 chip), gene symbol (3 gene), and marker server pattern identifier chosen (4 pattern). Columns five and six are related to the cluster-ing analysis (see Materials and methods): National Center for Bio-technology Information NCBI identifier for the protein sequence used (5 protein) and label for the protein cluster (6 cluster). Col-umns seven to 18 indicate segregation (value of 1) in pairs of stem cell samples and their differentiated derivatives, respectively: J1 mESC (7 J1-U and 8 J1-D), V6.5 mESC (9 V6.5-U and 10 V6.5-D), mast cell precursors (11 Mast-U and 12 Mast-D), mammospheres (13 MaSC-U and 14 MaSC-D), osteoblasts (15 Osteo-U and 16 Osteo-D), and hematopoietic cells (17 HSC-U and 18 HSC-D). Col-umn 19 (multi) indicates (value 0/1) 17 genes differentially expressed along multiple stem cell lineages (one at least being non-mESC). Samples used were S255 versus S256 for mammary stem cells (undifferentiated and differentiated, respectively), S294 ver-sus five samples (S291, S292, S293, S295, and S296) for hemat-opoietic stem cells (HSC), S128 versus S127 for J1 ESCs, S153 versus S175 for V6.5 ESCs, S185 versus S196 for osteoblasts, and S236 versus S237 for mast cells.Click here for fileAdditional data file 4Identifiers of the proteins used in the phylogenetic analysisProtein identifiers (GenBank) of the sequences used for the phylo-genetic analysis depicted in Figure 5. Occasionally, the label used (for example, Ebf) differs from the gene name in the database. Labels used are derived from the phylogenetic analysis.Click here for file
Acknowledgements
We thank the members of our group for helpful discussions and, in partic-
ular, Carolina Perez-Iratxeta for assistance with the identification of GO
term ancestors and to Christopher Porter for critical review of the manu-
script. Thanks to Michael McBurney (OHRI) for many useful comments on
the web tool and to Jeffrey Dilworth (OHRI) for comments on the manu-
script. This project has been supported with funds from the Ontario Inno-
vation Trust, the Canadian Foundation for Innovation, the Ontario
Research and Development Challenge Funds, and the Stem Cell Network.
MAA is a Canada Research Chair in Bioinformatics. PMK is a recipient of a
Trainee Award from the Stem Cell Network and enjoys an Ontario Grad-
uate Scholarship of Science and Technology matched by the Ottawa Health
Research Institute. Last but not least, we thank the Stem Cell Network
members who contributed samples to StemBase and to Pearl Campbell and
the members of her group who generated the DNA microarray data.
References
1. Heller MJ: DNA microarray technology: devices, systems, and
applications. Annu Rev Biomed Eng 2002, 4:129-153.
2. Stoughton RB: Applications of DNA microarrays in biology.
Annu Rev Biochem 2005, 74:53-82.
3. Su AI, Cooke MP, Ching KA, Hakak Y, Walker JR, Wiltshire T, Orth
AP, Vega RG, Sapinoso LM, Moqrich A, et al.: Large-scale analysis
of the human and mouse transcriptomes. Proc Natl Acad Sci
USA 2002, 99:4465-4470.
4. Wang Y, Klijn JG, Zhang Y, Sieuwerts AM, Look MP, Yang F, Talantov
D, Timmermans M, Meijer-van Gelder ME, Yu J, et al.: Gene-expres-
sion profiles to predict distant metastasis of lymph-node-
negative primary breast cancer. Lancet 2005, 365:671-679.
5. Zhang W, Morris QD, Chang R, Shai O, Bakowski MA, Mitsakakis N,
Mohammad N, Robinson MD, Zirngibl R, Somogyi E, et al.: The func-
tional landscape of mouse gene expression. J Biol 2004, 3:21.
6. Sherlock G, Hernandez-Boussard T, Kasarskis A, Binkley G, Matese
JC, Dwight SS, Kaloper M, Weng S, Jin H, Ball CA, et al.: The Stan-
ford Microarray Database. Nucleic Acids Res 2001, 29:152-155.
7. Perez-Iratxeta C, Palidwor G, Porter CJ, Sanche NA, Huska MR,
Suomela BP, Muro EM, Krzyzanowski PM, Hughes E, Campbell PA, et
al.: Study of stem cell function using microarray experiments.
FEBS Lett 2005, 579:1795-1801.
8. Barrett T, Suzek TO, Troup DB, Wilhite SE, Ngau WC, Ledoux P,
Rudnev D, Lash AE, Fujibuchi W, Edgar R: NCBI GEO: mining mil-
lions of expression profiles - database and tools. Nucleic Acids
Res 2005, 33:D562-566.
9. Eisen MB, Spellman PT, Brown PO, Botstein D: Cluster analysis
and display of genome-wide expression patterns. Proc Natl
Acad Sci USA 1998, 95:14863-14868.
10. Tusher VG, Tibshirani R, Chu G: Significance analysis of micro-
arrays applied to the ionizing radiation response. Proc Natl
Acad Sci USA 2001, 98:5116-5121.
11. Yeakley JM, Fan JB, Doucet D, Luo L, Wickham E, Ye Z, Chee MS, Fu
XD: Profiling alternative splicing on fiber-optic arrays. Nat
Biotechnol 2002, 20:353-358.
12. Pan Q, Shai O, Misquitta C, Zhang W, Saltzman AL, Mohammad N,
Babak T, Siu H, Hughes TR, Morris QD, et al.: Revealing global reg-
ulatory features of mammalian alternative splicing using a
quantitative microarray platform. Mol Cell 2004, 16:929-941.
13. Johnson JM, Castle J, Garrett-Engele P, Kan Z, Loerch PM, Armour
CD, Santos R, Schadt EE, Stoughton R, Shoemaker DD: Genome-
wide survey of human alternative pre-mRNA splicing with
exon junction microarrays. Science 2003, 302:2141-2144.
14. Shoemaker DD, Schadt EE, Armour CD, He YD, Garrett-Engele P,
McDonagh PD, Loerch PM, Leonardson A, Lum PY, Cavet G, et al.:
Experimental annotation of the human genome using micro-
array technology. Nature 2001, 409:922-927.
15. David L, Huber W, Granovskaia M, Toedling J, Palm CJ, Bofkin L,
Jones T, Davis RW, Steinmetz LM: A high-resolution map of tran-
scription in the yeast genome. Proc Natl Acad Sci USA 2006,
R193.18 Genome Biology 2007, Volume 8, Issue 9, Article R193 Krzyzanowski and Andrade-Navarro />Genome Biology 2007, 8:R193
103:5320-5325.
16. Bertone P, Stolc V, Royce TE, Rozowsky JS, Urban AE, Zhu X, Rinn
JL, Tongprasit W, Samanta M, Weissman S, et al.: Global identifica-
tion of human transcribed sequences with genome tiling
arrays. Science 2004, 306:2242-2246.
17. Sieuwerts AM, Look MP, Meijer-van Gelder ME, Timmermans M,
Trapman AM, Garcia RR, Arnold M, Goedheer AJ, de Weerd V, Por-
tengen H, et al.: Which cyclin E prevails as prognostic marker
for breast cancer? Results from a retrospective study involv-
ing 635 lymph node-negative breast cancer patients. Clin Can-
cer Res 2006, 12:3319-3328.
18. Wang Y, Jatkoe T, Zhang Y, Mutch MG, Talantov D, Jiang J, McLeod
HL, Atkins D: Gene expression profiles and molecular mark-
ers to predict recurrence of Dukes' B colon cancer. J Clin
Oncol 2004, 22:1564-1571.
19. Inacio J, Fonseca A: Reinstatement of Rhodotorula colostri
(Castelli) Lodder and Rhodotorula crocea Shifrine & Phaff,
former synonyms of Rhodotorula aurantiaca (Saito) Lodder.
FEMS Yeast Res 2004, 4:557-561.
20. Singh SK, Clarke ID, Hide T, Dirks PB: Cancer stem cells in nerv-
ous system tumors. Oncogene 2004, 23:7267-7273.
21. Marker Server Entrance [ />erver/]
22. Grenier G, Scime A, Asakura A, Perez-Iratxeta C, Andrade-Navarro
MA, Labosky PA, Rudnicki MA: Resident endothelial precursors
in muscle, adipose and dermis contribute to post-natal
vasculogenesis. Stem Cells 2007 in press.
23. Li L, Xie T: Stem cell niche: structure and function. Annu Rev
Cell Dev Biol 2005, 21:605-631.
24. Law RH, Zhang Q, McGowan S, Buckle AM, Silverman GA, Wong W,
Rosado CJ, Langendorf CG, Pike RN, Bird PI, Whisstock JC: An
overview of the serpin superfamily. Genome Biol 2006, 7:
216.
25. Kennedy SA, van Diepen AC, van den Hurk CM, Coates LC, Lee TW,
Ostrovsky LL, Miranda E, Perez J, Davies MJ, Lomas DA, et al.:
Expression of the serine protease inhibitor neuroserpin in
cells of the human myeloid lineage. Thromb Haemost 2007,
97:394-399.
26. Missen MA, Haylock D, Whitty G, Medcalf RL, Coughlin PB: Stage
specific gene expression of serpins and their cognate pro-
teases during myeloid differentiation. Br J Haematol 2006,
135:715-724.
27. Krieg SA, Krieg AJ, Shapiro DJ: A unique downstream estrogen
responsive unit mediates estrogen induction of proteinase
inhibitor-9, a cellular inhibitor of IL-1beta-converting
enzyme (caspase 1). Mol Endocrinol 2001, 15:1971-1982.
28. Abdullah Z, Saric T, Kashkar H, Baschuk N, Yazdanpanah B, Fleis-
chmann BK, Hescheler J, Kronke M, Utermohlen O: Serpin-6
expression protects embryonic stem cells from lysis by anti-
gen-specific CTL. J Immunol 2007, 178:3390-3399.
29. Richter K, Wirta V, Dahl L, Bruce S, Lundeberg J, Carlsson L, Williams
C: Global gene expression analyses of hematopoietic stem
cell-like cell lines with inducible Lhx2 expression. BMC
Genomics 2006, 7:75.
30. Terskikh AV, Easterday MC, Li L, Hood L, Kornblum HI, Geschwind
DH, Weissman IL: From hematopoiesis to neuropoiesis: evi-
dence of overlapping genetic programs. Proc Natl Acad Sci USA
2001, 98:7934-7939.
31. Sipione S, Simmen KC, Lord SJ, Motyka B, Ewen C, Shostak I, Rayat
GR, Dufour JM, Korbutt GS, Rajotte RV, Bleackley RC: Identifica-
tion of a novel human granzyme B inhibitor secreted by cul-
tured sertoli cells. J Immunol 2006, 177:5051-5058.
32. Ishida Y, Kubota H, Yamamoto A, Kitamura A, Bachinger HP, Nagata
K: Type I collagen in Hsp47-null cells is aggregated in endo-
plasmic reticulum and deficient in N-propeptide processing
and fibrillogenesis. Mol Biol Cell 2006, 17:2346-2355.
33. Matsuoka Y, Kubota H, Adachi E, Nagai N, Marutani T, Hosokawa N,
Nagata K: Insufficient folding of type IV collagen and forma-
tion of abnormal basement membrane-like structure in
embryoid bodies derived from Hsp47-null embryonic stem
cells.
Mol Biol Cell 2004, 15:4467-4475.
34. Mangelsdorf DJ, Thummel C, Beato M, Herrlich P, Schutz G, Umes-
ono K, Blumberg B, Kastner P, Mark M, Chambon P, Evans RM: The
nuclear receptor superfamily: the second decade. Cell 1995,
83:835-839.
35. You LR, Lin FJ, Lee CT, DeMayo FJ, Tsai MJ, Tsai SY: Suppression of
Notch signalling by the COUP-TFII transcription factor reg-
ulates vein identity. Nature 2005, 435:98-104.
36. Lee CT, Li L, Takamoto N, Martin JF, Demayo FJ, Tsai MJ, Tsai SY:
The nuclear orphan receptor COUP-TFII is required for
limb and skeletal muscle development. Mol Cell Biol 2004,
24:10835-10843.
37. Kanai MI, Okabe M, Hiromi Y: seven-up Controls switching of
transcription factors that specify temporal identities of Dro-
sophila neuroblasts. Dev Cell 2005, 8:203-213.
38. Hannemann F, Bichet A, Ewen KM, Bernhardt R: Cytochrome P450
systems - biological variations of electron transport chains.
Biochim Biophys Acta 2007, 1770:330-344.
39. Bernhardt R: Cytochromes P450 as versatile biocatalysts. J
Biotechnol 2006, 124:128-145.
40. Sasaki M, Kaneuchi M, Fujimoto S, Tanaka Y, Dahiya R: CYP1B1
gene in endometrial cancer. Mol Cell Endocrinol 2003,
202:171-176.
41. Stoilov I, Rezaie T, Jansson I, Schenkman JB, Sarfarazi M: Expression
of cytochrome P4501b1 (Cyp1b1) during early murine
development. Mol Vis 2004, 10:629-636.
42. Liang HC, Li H, McKinnon RA, Duffy JJ, Potter SS, Puga A, Nebert
DW: Cyp1a2
-/-
null mutant mice develop normally but show
deficient drug metabolism. Proc Natl Acad Sci USA 1996,
93:1671-1676.
43. Campbell SJ, Henderson CJ, Anthony DC, Davidson D, Clark AJ,
Wolf CR: The murine Cyp1a1 gene is expressed in a
restricted spatial and temporal pattern during embryonic
development. J Biol Chem 2005, 280:5828-5835.
44. Long JR, Egan KM, Dunning L, Shu XO, Cai Q, Cai H, Dai Q, Holtzman
J, Gao YT, Zheng W: Population-based case-control study of
AhR (aryl hydrocarbon receptor) and CYP1A2 polymor-
phisms and breast cancer risk. Pharmacogenet Genomics 2006,
16:237-243.
45. Ueda R, Iketaki H, Nagata K, Kimura S, Gonzalez FJ, Kusano K,
Yoshimura T, Yamazoe Y: A common regulatory region func-
tions bidirectionally in transcriptional activation of the
human CYP1A1 and CYP1A2 genes. Mol Pharmacol 2006,
69:1924-1930.
46. Zerial M, McBride H: Rab proteins as membrane organizers.
Nat Rev Mol Cell Biol 2001, 2:107-117.
47. DiAntonio A, Burgess RW, Chin AC, Deitcher DL, Scheller RH,
Schwarz TL: Identification and characterization of Drosophila
genes for synaptic vesicle proteins. J Neurosci 1993,
13:4924-4935.
48. Schluter OM, Schmitz F, Jahn R, Rosenmund C, Sudhof TC: A com-
plete genetic analysis of neuronal Rab3 function. J Neurosci
2004, 24:6629-6637.
49. Ward CR, Faundes D, Foster JA: The monomeric GTP binding
protein, rab3a, is associated with the acrosome in mouse
sperm. Mol Reprod Dev 1999, 53:413-421.
50. Riedel D, Antonin W, Fernandez-Chacon R, Alvarez de Toledo G, Jo
T, Geppert M, Valentijn JA, Valentijn K, Jamieson JD, Sudhof TC, Jahn
R: Rab3D is not required for exocrine exocytosis but for
maintenance of normally sized secretory granules. Mol Cell
Biol 2002, 22:6487-6497.
51. Oberhauser AF, Balan V, Fernandez-Badilla CL, Fernandez JM: RT-
PCR cloning of Rab3 isoforms expressed in peritoneal mast
cells. FEBS Lett 1994,
339:171-174.
52. Jimenez MA, Akerblad P, Sigvardsson M, Rosen ED: Critical role for
Ebf1 and Ebf2 in the adipogenic transcriptional cascade. Mol
Cell Biol 2007, 27:743-757.
53. Wang SS, Betz AG, Reed RR: Cloning of a novel Olf-1/EBF-like
gene, O/E-4, by degenerate oligo-based direct selection. Mol
Cell Neurosci 2002, 20:404-414.
54. Vervoort M, Crozatier M, Valle D, Vincent A: The COE transcrip-
tion factor Collier is a mediator of short-range Hedgehog-
induced patterning of the Drosophila wing. Curr Biol 1999,
9:632-639.
55. Krzemien J, Dubois L, Makki R, Meister M, Vincent A, Crozatier M:
Control of blood cell homeostasis in Drosophila larvae by the
posterior signalling centre. Nature 2007, 446:325-328.
56. Perez-Iratxeta C, Andrade MA: Inconsistencies over time in 5%
of NetAffx probe-to-gene annotations. BMC Bioinformatics 2005,
6:183.
57. Pepe MS, Longton G, Anderson GL, Schummer M: Selecting differ-
entially expressed genes from microarray experiments. Bio-
metrics 2003, 59:133-142.
58. Tibshirani R, Hastie T, Narasimhan B, Chu G: Diagnosis of multiple
cancer types by shrunken centroids of gene expression. Proc
Natl Acad Sci USA 2002, 99:6567-6572.
59. Beattie BJ, Robinson PN: Binary state pattern clustering: a
Genome Biology 2007, Volume 8, Issue 9, Article R193 Krzyzanowski and Andrade-Navarro R193.19
Genome Biology 2007, 8:R193
digital paradigm for class and biomarker discovery in gene
microarray studies of cancer. J Comput Biol 2006, 13:1114-1130.
60. Vogel G: Stem cells. 'Stemness' genes still elusive. Science 2003,
302:371.
61. Sene KH, Porter CJ, Palidwor G, Perez-Iratxeta C, Muro EM, Camp-
bell PA, Rudnicki MA, Andrade-Navarro MA: Gene function in
early mouse embryonic stem cell differentiation. BMC
Genomics 2007, 8:85.
62. The R Project for Statistical Computing [http://www.r-
project.org]
63. Gentleman RC, Carey VJ, Bates DM, Bolstad B, Dettling M, Dudoit S,
Ellis B, Gautier L, Ge Y, Gentry J, et al.: Bioconductor: open soft-
ware development for computational biology and
bioinformatics. Genome Biol 2004, 5:R80.
64. StemBase homepage []
65. Wu Z, Irizarry RA: Stochastic models inspired by hybridization
theory for short oligonucleotide arrays. J Comput Biol 2005,
12:882-893.
66. Ashburner M, Ball CA, Blake JA, Botstein D, Butler H, Cherry JM,
Davis AP, Dolinski K, Dwight SS, Eppig JT, et al.: Gene ontology:
tool for the unification of biology. The Gene Ontology
Consortium. Nat Genet 2000, 25:25-29.
67. Liu G, Loraine AE, Shigeta R, Cline M, Cheng J, Valmeekam V, Sun S,
Kulp D, Siani-Rose MA: NetAffx: Affymetrix probesets and
annotations. Nucleic Acids Res 2003, 31:82-86.
68. NCBI gene annotation data [ />gene2go.gz]
69. Tavazoie S, Hughes JD, Campbell MJ, Cho RJ, Church GM: System-
atic determination of genetic network architecture. Nat
Genet 1999, 22:281-285.
70. NCBI Mouse RefSeq data [ />M_musculus/mRNA_Prot]
71. Altschul SF, Madden TL, Schaffer AA, Zhang J, Zhang Z, Miller W, Lip-
man DJ: Gapped BLAST and PSI-BLAST: a new generation of
protein database search programs. Nucleic Acids Res 1997,
25:3389-3402.
72. Vienne A, Pontarotti P: Metaphylogeny of 82 gene families
sheds a new light on chordate evolution. Int J Biol Sci 2006,
2:32-37.
73. Christoffels A, Koh EG, Chia JM, Brenner S, Aparicio S, Venkatesh B:
Fugu genome analysis provides evidence for a whole-
genome duplication early during the evolution of ray-finned
fishes. Mol Biol Evol 2004, 21:1146-1151.
74. Tropepe V, Coles BL, Chiasson BJ, Horsford DJ, Elia AJ, McInnes RR,
van der Kooy D: Retinal stem cells in the adult mammalian
eye. Science 2000, 287:2032-2036.
75. Uchida N, Buck DW, He D, Reitsma MJ, Masek M, Phan TV, Tsu-
kamoto AS, Gage FH, Weissman IL: Direct isolation of human
central nervous system stem cells. Proc Natl Acad Sci USA 2000,
97:14720-14725.
76. Kee N, Sivalingam S, Boonstra R, Wojtowicz JM: The utility of Ki-
67 and BrdU as proliferative markers of adult neurogenesis.
J Neurosci Methods 2002, 115:97-105.
77. Mitsui K, Tokuzawa Y, Itoh H, Segawa K, Murakami M, Takahashi K,
Maruyama M, Maeda M, Yamanaka S: The homeoprotein Nanog
is required for maintenance of pluripotency in mouse epi-
blast and ES cells. Cell 2003, 113:631-642.
78. Pevny L, Rao MS: The stem-cell menagerie. Trends Neurosci 2003,
26:351-359.
79. Charge SB, Rudnicki MA: Cellular and molecular regulation of
muscle regeneration. Physiol Rev 2004, 84:209-238.
80. Rao M: Stem and precursor cells in the nervous system. J
Neurotrauma 2004, 21:415-427.
81. Toma JG, McKenzie IA, Bagli D, Miller FD: Isolation and character-
ization of multipotent skin-derived precursors from human
skin. Stem Cells
2005, 23:727-737.
82. Yano S, Ito Y, Fujimoto M, Hamazaki TS, Tamaki K, Okochi H: Char-
acterization and localization of side population cells in
mouse skin. Stem Cells 2005, 23:834-841.
83. Inoue T, Kagawa T, Fukushima M, Shimizu T, Yoshinaga Y, Takada S,
Tanihara H, Taga T: Activation of canonical Wnt pathway pro-
motes proliferation of retinal stem cells derived from adult
mouse ciliary margin. Stem Cells 2006, 24:95-104.
84. Strem BM, Hicok KC, Zhu M, Wulur I, Alfonso Z, Schreiber RE, Fra-
ser JK, Hedrick MH: Multipotential differentiation of adipose
tissue-derived stem cells. Keio J Med 2005, 54:132-141.
85. Kalirai H, Clarke RB: Human breast epithelial stem cells and
their regulation. J Pathol 2006, 208:7-16.
86. Shackleton M, Vaillant F, Simpson KJ, Stingl J, Smyth GK, Asselin-Labat
ML, Wu L, Lindeman GJ, Visvader JE: Generation of a functional
mammary gland from a single stem cell. Nature 2006,
439:84-88.
87. Kohno R, Ikeda Y, Yonemitsu Y, Hisatomi T, Yamaguchi M, Miyazaki
M, Takeshita H, Ishibashi T, Sueishi K: Sphere formation of ocular
epithelial cells in the ciliary body is a reprogramming system
for neural differentiation. Brain Res 2006, 1093:54-70.
88. Xia Y, Yamagata K, Krukoff TL: Differential expression of the
CD14/TLR4 complex and inflammatory signaling molecules
following i.c.v. administration of LPS. Brain Res 2006,
1095:85-95.