Báo cáo y học: "Harnessing naturally randomized transcription to infer regulatory relationships among genes" pptx
Bạn đang xem bản rút gọn của tài liệu. Xem và tải ngay bản đầy đủ của tài liệu tại đây (3.68 MB, 13 trang )
Genome Biology 2007, 8:R219
Open Access
2007Chenet al.Volume 8, Issue 10, Article R219
Method
Harnessing naturally randomized transcription to infer regulatory
relationships among genes
Lin S Chen
*
, Frank Emmert-Streib
*†
and John D Storey
*†
Addresses:
*
Department of Biostatistics, University of Washington, 1705 NE Pacific St, Seattle, WA 98195, USA
†
Department of Genome
Sciences, University of Washington, 1705 NE Pacific St, Seattle, WA 98195, USA
Correspondence: John D Storey. Email:
© 2007 Chen et al.; licensee BioMed Central Ltd.
This is an open access article distributed under the terms of the Creative Commons Attribution License ( which
permits unrestricted use, distribution, and reproduction in any medium, provided the original work is properly cited.
Inferring regulatory relationships among genes<p>An approach is developed that utilizes randomized genotypes to rigorously infer causal regulatory relationships among genes at the transcriptional level. The approach is applied to an experiment in yeast, yielding new insights into the topology of the yeast transcriptional regulatory network.</p>
Abstract
We develop an approach utilizing randomized genotypes to rigorously infer causal regulatory
relationships among genes at the transcriptional level, based on experiments in which genotyping
and expression profiling are performed. This approach can be used to build transcriptional
regulatory networks and to identify putative regulators of genes. We apply the method to an
experiment in yeast, in which genes known to be in the same processes and functions are
recovered in the resulting transcriptional regulatory network.
Background
It is now possible to measure DNA variation, RNA expression
levels, and protein expression levels from thousands of genes
in a given biologic sample [1-3]. Of great interest is inferring
the 'wiring diagram', or the way in which many genes regulate
one another and interact, from these sources of high-through-
put data [4,5]. However, this goal is complicated by the fact
that RNA levels, protein levels, phenotypes, and environmen-
tal conditions may all affect one another [6-10], creating
intractable sources of confounding. This has made it difficult
to distinguish correlation from causal regulatory effects, lim-
iting the success and applicability of constructed genome-
wide regulatory networks [11].
A number of integrative genomics studies have recently been
conducted, in which large-scale genotyping and expression
profiling is performed on individuals with randomized
genetic backgrounds [12-15]. Typically, linkage analyses have
been performed on these studies in order to detect quantita-
tive trait loci (QTLs) underlying gene 'expression traits'
[10,12-17]. Although these studies have shown that expres-
sion variation is highly heritable, this approach does not typ-
ically directly identify specific genes or mechanisms that are
responsible for expression variation without additional
experimentation. Instead of employing this experimental
approach to genetically dissect expression traits, we have
developed a method called 'Trigger' (Transcriptional Regula-
tion Inference from Genetics of Gene ExpRession) for infer-
ring causal regulatory relationships among all possible pairs
of genes.
Randomization is the 'gold standard' for inferring causality of
one variable on another [18-20]. This concept has success-
fully been applied in clinical trials to establish the causal
effects of drugs on disease. Because DNA variation has a sub-
stantial and widespread effect on transcriptional variation
[12-15,21-25], we show that randomizing DNA content pro-
vides a natural mechanism for randomizing RNA levels. By
utilizing this randomization, we present a new theoretical
result defining three testable conditions that, when true,
imply that a directed causal relationship exists among a pair
of transcripts, where this causal relationship is robust against
confounding caused by hidden variables. Using this theoreti-
cal result, we develop a method to test directly for this causal
Published: 11 October 2007
Genome Biology 2007, 8:R219 (doi:10.1186/gb-2007-8-10-r219)
Received: 21 May 2007
Revised: 24 July 2007
Accepted: 11 October 2007
The electronic version of this article is the complete one and can be
found online at />Genome Biology 2007, 8:R219
Genome Biology 2007, Volume 8, Issue 10, Article R219 Chen et al. R219.2
relationship, which allows us to estimate the probability that
the specific causal model is true. These probabilities can in
turn be used to build meaningful regulatory networks, in
which the certainty of any such network is easily quantified by
the false discovery rate (FDR) [26]. In addition, the proposed
approach explicitly identifies genes whose expression levels
are responsible for variation of expression traits, overcoming
a limitation of identifying only their QTLs.
The concept of causal modeling has previously been consid-
ered within the context of genetic variation [27-32]. Several of
these existing approaches search for the best-fitting causal
model among genes or traits linked to a common locus. The
consideration of causality in those papers is justified by the
joint linkage of traits to a common locus, thereby reducing the
total number of causal models [29-31], but it is not justified by
a randomization process. Whereas it has clearly been recog-
nized that changes in linkage status when conditioning on
traits in a specific order is strong evidence for a causal rela-
tionship among the traits [27,28,32], Trigger directly uses the
'Mendelian randomized' genotypes to test rigorously for cau-
sality. This allows for a strict definition of causality that can
be directly tested. The proposed method has the notable fea-
ture that the test for causality is robust against false positives
due to common hidden causal variables. The proposed
method also provides a single significance measure for each
potential causal relationship in such a way that they can be
individually interpreted as well as combined to estimate an
overall FDR of the network. Trigger avoids the ambiguities
caused by selecting among several models by an often subjec-
tively chosen model selection criterion.
We apply the proposed method to an experiment on yeast
[12,33], in which two distinct strains were crossed to produce
112 independent recombinant segregant lines, and genome-
wide genotyping and expression profiling were performed on
each segregant line. Applying Trigger to this study yields
genome-wide regulatory probabilities that can be used to con-
struct networks with any desired FDR. We identify regulatory
relationships among genes that recapitulate previous find-
ings, provide new predictions, and yield new information
about the topology of the yeast transcriptional regulatory
network.
Results and discussion
For an individual organism, DNA has the useful feature that
it is usually a static variable, meaning that it is fixed and will
not change with changing RNA levels, protein levels, pheno-
types, or environmental conditions. By performing designed
crosses of genetically distinct inbred or isogenic lines, one can
randomize the genotypes of an organism from two or more
genetic backgrounds, thereby producing independent realiza-
tions of DNA content from offspring to offspring [6]. At the
same time, one may measure gene expression, or any other
molecular or clinical phenotype of interest, on each resulting
recombinant line.
We have developed Trigger as an approach for inferring reg-
ulatory relationships among all pairs of genes at the genome-
wide level, based on these genetic cross experiments in which
high-throughput expression profiling is also performed (Fig-
ure 1). However, one may also incorporate any other molecu-
lar or clinical phenotype of interest into the algorithm.
Probabilities of transcriptional regulation
Suppose that there are m genes with transcription levels
measured on recombinant offspring from an experimental
genetic cross. (In the yeast experiment we consider, m =
6,216.) The goal is to use the data from such an experiment to
estimate the probability that the transcription of gene i has a
causal regulatory effect on the transcription of any other gene
j, which we denote by P
ij
, where 'causal regulatory effect'
means that a change in the transcription level of gene i results
in a predictable change in the level of gene j. This is not nec-
essarily through a direct molecular interaction; however, if we
directly modulate the transcriptional level of gene i, then this
should result in a corresponding change in the transcriptional
level of gene j. Trigger provides a conservative estimate of
these probabilities, denoted by for i = 1, , m and j = 1, ,
m.
These estimated regulatory probabilities can be used to build
a regulatory network based on a directed graph. The probabil-
ity that a directed edge exists from gene i to gene j in the net-
work is estimated by . One can directly threshold the
entries, essentially setting those not meeting the threshold
equal to zero. For example, one could remove all potential
edges with < 90% while including those with ≥ 90%.
Therefore, a directed edge would be drawn from gene i to gene
j if and only if ≥ 90% (Figure 2). The resulting network has
an easily quantified and interpretable FDR, and each directed
edge has an estimated probability that it is true (see Materials
and methods [below] and Additional data file 1).
In addition to constructing a regulatory network from these
estimated probabilities, each gene i can be examined as a
putative regulator, and hence a quantitative trait gene or
'quantitative trait transcript' [34]. Specifically, the probability
that a specific gene i is a regulator for each other gene j is esti-
mated as . A threshold can be applied to these estimated
probabilities to obtain the FDR of the significant genes (see
Materials and methods [below] and Additional data file 1).
This particular application of Trigger allows one to move
beyond identifying QTL of expression traits to identifying a
specific underlying causal quantitative trait transcript.
ˆ
P
ij
ˆ
P
ij
ˆ
P
ij
ˆ
P
ij
ˆ
P
ij
ˆ
P
ij
Genome Biology 2007, Volume 8, Issue 10, Article R219 Chen et al. R219.3
Genome Biology 2007, 8:R219
Causal models of transcriptional regulation
Trigger is based on a rigorous mathematical framework that
we developed for utilizing randomized genetic backgrounds
and genome-wide expression in order to test rigorously for
causality among transcription levels. The approach starts
with a pair of transcripts and a locus to which both are linked.
Let L be the locus, T
i
transcript i, and T
j
transcript j.
The goal is to identify triplets (L, T
i
, T
j
) such that L → T
i
→ T
j
,
where the arrow '→' means causation. The definition of
'causal' has been a topic of much interest [18,19]. Although
definitions of causality differ slightly among the many articles
published on this topic, in essence T
i
→ T
j
means that the ideal
manipulation of T
i
will change the distribution of T
j
, whereas
the ideal manipulation of T
j
will not disturb the distribution of
T
i
. 'Ideal manipulation' of a variable means to change the var-
iable in a manner that leaves every other variable unchanged,
at the moment when the manipulation occurs [35]. This
framework also applies to causality among random variables.
With the genetic cross experimental design, the genotype at a
fixed locus L is a random variable, whose random outcome
occurs before and independently from the subsequently
measured expression values. For example, in the yeast exper-
iment analyzed below, two haploid parental strains (BY and
RM) were crossed to produce 112 recombinant haploid segre-
gant strains. Because of the random segregation of chromo-
somes during meiosis, the inheritance of L = BY or L = RM is
random. Therefore, when measuring the alleles at a single
locus L across 112 segregants, we observe 112 genotypes being
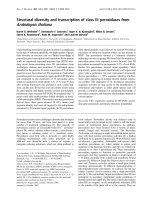
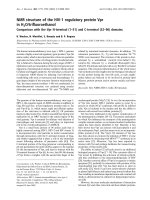
An illustration of the properties required to infer the causal relationship L → T
i
→ T
j
Figure 1
An illustration of the properties required to infer the causal relationship L → T
i
→ T
j
. (a) All gene expression traits are normalized to follow a N(0,1)
distribution. By the causality equivalence theorem, in order to conclude that L → T
i
→ T
j
, it must be the case that (b) T
i
is linked to L, where the mean
expression among segregants with allele at L inherited from the BY parental strain is different from the mean expression among segregants with allele at L
inherited from the RM parental strain; (c) T
j
is also linked to L; and (d) the expression of T
j
given T
i
is no longer linked to L. Trigger is an algorithm to
estimate the probability that all three conditions (shown in panels b to d) hold simultaneously.
Genome Biology 2007, 8:R219
Genome Biology 2007, Volume 8, Issue 10, Article R219 Chen et al. R219.4
generated from some probability distribution. (See Materials
and methods [below] for explicit details on the assumptions
we make about the randomized genotypes among the loci.)
Because the randomization of L takes place before the expres-
sion levels of T
i
are measured, this implies that if T
i
is linked
to locus L then L → T
i
. This property is due to the well estab-
lished principles in statistics showing that an association
between two variables when one of them is properly rand-
omized implies causation [19,20]. Additionally, the randomi-
zation of L is carried through to the variation in T
i
whenever
L → T
i
. If L → T
i
, then segregants with L = BY have a different
mean expression for T
i
than segregants with L = RM. There-
fore, the randomization of L provides a randomization of the
mean level of expression for T
i
. Figure 1a shows the transcrip-
tional levels for a given gene, and Figure 1b shows a case in
which it is linked to some locus L. Because the inherited allele
L = BY or L = RM is random for each segregant, the mean
level of expression for T
i
is random when L → T
i
.
Importantly, some of the variation in T
i
will not be explained
by L, specifically the random fluctuations of the transcription
levels within each genotype (Figure 1b). Therefore, it is not
possible to conclude that T
i
→ T
j
whenever T
i
and T
j
are signif-
icantly associated to L. This follows because there could be a
common hidden variable affecting both T
i
and T
j
. (Note that if
T
i
were perfectly randomized, then there would be no causal
hidden variable for T
i
, which demonstrates the power of ran-
domization.) Suppose that a hidden variable H is such that H
→ T
i
and H → T
j
. Because of this common hidden causal var-
iable, any association between T
i
and T
j
would not allow us to
conclude that T
i
→ T
j
even though T
i
has been partially rand-
omized. In other words, the partial randomization of T
i
caused by L is now confounded by the effect of H. The com-
mon causal hidden variable H does not prevent T
i
→ T
j
from
occurring; rather, we just are unable to draw any conclusion
when this is the case, unless we are willing to model common
hidden causal variables. Modeling common hidden causal
variables has been shown to be particularly challenging in this
high-dimensional setting [36], and doing so would require
much additional work.
If there is a common causal hidden variable H that affects
both T
i
and T
j
, then the Trigger method is designed to not
make any conclusions about causality. However, if there is
not a common hidden causal variable, then it is now possible,
in a straightforward manner, to determine whether T
i
→ T
j
.
The following new theorem identifies three conditions that
are equivalent to the case in which both L → T
i
→ T
j
and no
common causal hidden variable affects both T
i
and T
j
. (See
Materials and methods [below] for a mathematical proof.)
Causality equivalence theorem
The causal relationship L → T
i
→ T
j
exists and there are no
hidden variables causal for both T
i
and T
j
if and only if the fol-
lowing three conditions hold: L → T
i
, L → T
j
, and L ⊥ T
j
| T
i
.
This theorem is used in the following manner. If L → T
i
, L →
T
j
, and L ⊥ T
j
| T
i
, then we may conclude that L → T
i
→ T
j
exists
and there are no hidden variables causal for both T
i
and T
j
.
The fact that 'there are no hidden variables causal for both T
i
and T
j
' is not an assumption. Rather, it is a verified fact that
follows when the three properties are true, as we show in the
proof given in Materials and methods (below). We would pre-
fer to detect all cases where L → T
i
→ T
j
; however, as
explained above, it is not yet possible to do so in the presence
of common causal hidden variables.
Figure 1 provides a graphical representation of the three
properties that must be satisfied. The last condition, L ⊥ T
j
|
T
i
, denotes that T
j
conditioned on the information in T
i
is
independent from L. The first two conditions basically ensure
that both transcripts are subjected to a common randomiza-
tion. The third condition is the key one for inferring causality
based on these randomizations. Basically, what the third con-
dition determines is whether the causal effect from L on T
j
can
entirely be captured by T
i
. If so, then T
i
is indeed a causal fac-
tor for variation in T
j
, with no hidden variables.
For computational and statistical efficiency, we limit L to be
the locus of gene i (see Additional data file 1), which we denote
as L
i
. We call L
i
→ T
i
the primary cis linkage and L
i
→ T
j
for
any other gene j the 'secondary linkage' here. Because Pr(T
i
→
T
j
) ≥ Pr(L → T
i
→ T
j
), we can obtain a conservative estimate of
P
ij
by estimating Pr(L → T
i
→ T
j
). From the causality equiva-
lence theorem it follows that:
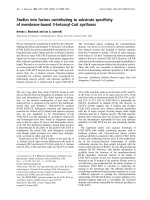
A transcriptional regulatory network drawn from a Trigger probability threshold of 90%Figure 2
A transcriptional regulatory network drawn from a Trigger probability
threshold of 90%. The network consists of 4,394 genes, 2,145 causal
relationships, and 127 causal genes. Genes are represented by orange
circles and causal relationships are represented by directed edges with
black arrows.
Genome Biology 2007, Volume 8, Issue 10, Article R219 Chen et al. R219.5
Genome Biology 2007, 8:R219
Pr(L
i
→ T
i
→ T
j
)
= Pr(L
i
→ T
i
and L
i
→ T
j
and L
i
⊥ T
j
| T
i
)
= Pr(L
i
→ T
i
) × Pr(L
i
→ T
j
| L
i
→ T
i
)
× Pr(L
i
⊥ T
j
| T
i
| L
i
→ T
i
and L
i
→ T
j
)
The Trigger algorithm conservatively estimates P
ij
by estimat-
ing each probability in the above product from left to right
and taking their product. (See Materials and methods [below]
and Additional data file 1.)
Application to yeast
We applied the Trigger algorithm to the yeast experiment
(Materials and methods [below]) and found several interest-
ing characteristics of the resulting regulatory probability
matrix. Table 1 lists the overall significance results with dif-
ferent probability thresholds and Additional data file 2 con-
tains the entire regulatory probability matrix. For example, at
a probability threshold of 90%, we found 4,394 significant
regulatory relationships among 2,145 genes where 127 are
causal. Figure 2 shows a regulatory network drawn from the
Trigger results at this threshold, where a directed edge is
drawn from gene i to gene j if and only if P
ij
≥ 90%. It can be
seen from Figure 2 that we have constructed a highly inter-
connected network where there is clearly a 'hub structure'.
We examined in detail four genes as putative regulators:
CNS1 on chromosome 2, ILV6 on chromosome 3, SAL1 on
chromosome 14, and NAM9 on chromosome 14. Each was
highly significant for cis linkage, and the locus of each puta-
tive regulator had many significant secondary linking genes.
At a 90% posterior probability cut-off (FDR = 6%), 144, 51
and 36 genes were significant for being regulated by CNS1,
ILV6, and SAL1, respectively. At an 80% posterior probability
cut-off (FDR = 11%), 14 genes were significant for being regu-
lated by NAM9. The significant genes, posterior probabilities,
and other relevant information for each putative regulator
can be found in Additional data file 3. Note that each of these
putative regulators is also a significant quantitative trait gene
(or quantitative trait transcript) for each expression trait that
it significantly regulates. Figure 3 shows heat maps of the four
putative regulators and their corresponding significantly reg-
ulated genes. It can be seen that each significant gene is both
linked to the locus of the putative regulator and has correlated
expression with the regulator within each genotype, both of
which are necessary but not sufficient for causality.
In order to determine whether the genes that are significant
for each putative regulator show a coherent functional rela-
tionship, we employed the Gene Ontology (GO) database
[37]. For each putative regulator, we queried the database
among all significant genes and the regulator itself. This
approach takes independently performed experiments and
synthesizes the information obtained from those. The GO
searches allowed us to test specifically whether common
processes, functions, and components are present among
each set of genes. Indeed, we found an abundance of signifi-
cance for enriched GO terms for each set of genes correspond-
ing to a putative regulator.
Figure 4 shows the results of GO analysis for the putative reg-
ulator NAM9, which is a mitochondrial ribosomal component
of the small subunit and inviable under deletion [38]. It is a
structural constituent of ribosome, involved in translation
and mitochondrial small ribosome subunit [39-41]. For the 14
genes significant at an 80% posterior probability threshold
(FDR = 11%), 13 are known to be in the same or similar path-
way as NAM9. The other significant gene is heretofore
uncharacterized. Translation, structural constituent of ribos-
ome, and mitochondrial small ribosome subunit are all highly
significant terms in the GO tree.
Additional data file 1 (Figure S1) shows the results for the
putative regulator CNS1, which is an essential tetratricopep-
tide repeat (TPR)-containing co-chaperone, deletion of which
is inviable [42]. It binds both heat shock protein 82p
(Hsp82p) and Ssa1p (Hsp70), and stimulates the ATPase
activity of SSA1. CNS1 is involved in the protein binding proc-
ess, and its cellular component is associated with cytoplasm
[42-45]. Of the 144 genes significant at the 90% joint poste-
rior probability cut-off (FDR = 6%), a substantial subset is
involved in transferase activity and ribosome biogenesis and
assembly, which coincides with the key role played by CNS1 in
yeast. Many of the 144 genes were also found to be in the same
pathway as CNS1; for example, TRM8 and CNS1 are both
involved in a pathway for protein binding [46,47].
Table 1
Overall significance of the regulatory probability matrix at different probability thresholds
Probability threshold Number of putative
regulators
Total number of genes Number of edges FDR (%)
0.95 76 1,075 1,499 2.7
0.90 127 2,145 4,394 6.0
0.85 194 3,150 8,826 9.4
0.80 255 4,044 15,448 12.9
FDR, false discovery rate.
Genome Biology 2007, 8:R219
Genome Biology 2007, Volume 8, Issue 10, Article R219 Chen et al. R219.6
Additional data file 1 (Figure S2) shows the significant GO
results for ILV6 and its 51 genes under statistically significant
regulation. ILV6 is a regulatory subunit of acetolactate syn-
thase, which catalyzes the first step of branched-chain amino
acid biosynthesis [48,49]. Amino acid biosynthesis and its
associated pathways are significantly enriched GO terms with
P values below 10
-10
. Cyclohydrolase activity and lyase activity
are some other significant pathways identified by GO
analysis.
The putative regulator SAL1 is a probable transporter and a
member of the calcium-binding subfamily of the mitochon-
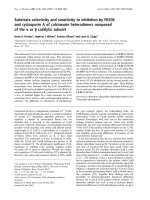
Heat-map display and hierarchical clustering of genes significantly regulated by the four putative regulators consideredFigure 3
Heat-map display and hierarchical clustering of genes significantly regulated by the four putative regulators considered. The top row is the expression of
the putative regulator (red indicates high expression, and blue low expression). All remaining rows are the hierarchically clustered significant genes. Each
column represents a single segregant, where the segregants have been separated by genotype at the putative regulator's locus (black line). The columns
have been ordered according to increasing expression of the putative regulator within each genotype. (a) CNS1 and its 144 significant genes. (b) ILV6 and
its 51 significant genes. (c) SAL1 and its 36 significant genes. (d) NAM9 and its 14 significant genes.
(a) (b)
(c)
(d)
BY
RM
BY
RM
BY
RM
BY
RM
SAL1
NAM9
ILV6
CNS1
Genome Biology 2007, Volume 8, Issue 10, Article R219 Chen et al. R219.7
Genome Biology 2007, 8:R219
drial carrier family, with two EF-hand motifs. It works in
transporter activity and calcium ion binding [50], with its cor-
responding cellular component involved in the mitochondrial
inner membrane [51]. From the GO analysis (Additional data
file 1 [Figure S3]), we can see that a number of the 36 genes
significantly regulated by SAL1 are associated with the mito-
chondrian and membrane GO terms. Six of the 36 signifi-
cantly regulated genes are involved in mitochondrial inner
membrane with high statistical significance (P < 10
-8
), a trend
that is consistent with previous findings [50,51].
It should be noted that in the case of SAL1 no polymorphism
exists in the immediate 500 base regions upstream or down-
stream of the SAL1 open reading frame. The linkage peaks
occur approximately 13 kilobases and 21 kilobases on either
side. This illustrates that linkage does not have to be due to an
unequivocally cis-acting regulatory polymorphism in order
for Trigger to work. On the contrary, there must simply be
some locus to which both expression traits T
i
and T
j
are
linked. We justified limiting the locus L to be in the 50
kilobases region of T
i
based on computational and statistical
increases in efficiency (Additional data file 1).
In addition to these four well characterized putative regula-
tors, we noticed that expression levels of a number of genes
with relatively unknown function (for instance, YSW1, PHM7,
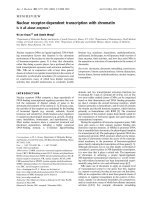
GO trees for NAM9 and 14 significantly regulated genes at 80% posterior probability threshold (FDR 11%)Figure 4
GO trees for NAM9 and 14 significantly regulated genes at 80% posterior probability threshold (FDR 11%). The colors of the boxes indicate the
significance of the various Gene Ontology (GO) terms. NAM9 encodes a mitochondrial ribosomal component of the small subunit, involved in translation
and mitochondrial small ribosome subunit [39-41]. Yeast is unviable under NAM9 deletion [38]. NAM9 is a structural constituent of ribosome, and it can be
seen that seven out of the 14 genes, together with NAM9, are involved in translation. Five of them are also a ribosomal structural constituent and encode
mitochondrial ribosomal subunits. Among the 14 putatively regulated genes, all except one uncharacterized gene are associated with mitochondria. FDR,
false discovery rate.
Genome Biology 2007, 8:R219
Genome Biology 2007, Volume 8, Issue 10, Article R219 Chen et al. R219.8
and so on), were predicted to regulate a number of genes, with
significant GO terms appearing for each set. Therefore, our
results can potentially be used to predict properties of
relatively unknown genes as well. Furthermore, several tran-
scription factors significantly regulated a number of genes,
including HAP1 [52,53] and RAD16 [54,55]. In previous work
it was found that mutations in GPA1 and AMN1 lead to
expression changes in genes whose expression exhibits link-
age to each respective locus [14]. Missense mutations (leading
to amino acid changes in the protein product) were identified
in both GPA1 and AMN1 that appear to be the cause of the
expression changes in the linking genes. In work to be
reported in the future we examine the GPA1 and AMN1 cases
in detail, showing that there appears to be common causal
hidden variables involved. The Trigger approach is extended
to take into account these common causal hidden variables,
allowing us to recapitulate the previous findings regarding
GPA1 and AMN1.
Comparison with other approaches
Mendelian randomization
Recently, 'Mendelian randomization' was proposed as a tech-
nique in genetic epidemiology to study the environmental
determinants of disease [27,28]. Trigger builds upon this con-
cept in the sense that it also employs the randomization of
genotypes as a starting point to infer causality. Essentially, we
have extended this idea by deriving precise conditions under
which the causality of one trait on another can be confirmed
and by providing a statistical technique for estimating the
probability that one trait is causal for another, among poten-
tially thousands of traits.
Model selection approaches
The concepts of 'causality' and 'regulation' have been utilized
in different ways in previous reports concerning the construc-
tion of biologic networks [29,30,32,56-60]. Among those
using the more rigorous definition of causality [35,61], most
published approaches have been to choose among the best fit-
ting causal models by partial correlation or by model selec-
tion. The difference between our work and most previous
work is that we explicitly test for and quantify each causal
relationship of interest by using the randomization of genetic
backgrounds built into the genetic cross experimental system.
Furthermore, we assess the significance of each causal rela-
tionship by estimating the probability that the causal rela-
tionship is true, so that it can be considered in a
straightforward manner with millions of other potential
causal relationships.
We have made some simple comparisons between Trigger
and the model selection and correlation based approaches
(Figure 5). In addition to Trigger showing different signifi-
cance rankings relative to these approaches, it offers an
increase in specificity. Most of the papers employing model
selection have used the 'Akaike information criterion' (AIC)
or derivatives thereof [29,31,32]. Among the about 38 million
triplets (L
i
, T
i
, T
j
), the AIC model selection method [62] clas-
sifies about 15.4 million as causal, whereas Trigger identifies
about 4,400 causal relationships with probability exceeding
90%. For the putative regulator CNS1, about 2,800 genes are
classified as having a causal relationship with CNS1 by model
selection, as opposed to the 144 Trigger found to be signifi-
cant with probability exceeding 90%. The advantages that
Trigger has over AIC and other model selection criteria are as
follows: there is no generally applicable method to obtain an
interpretable measure of significance based on these criteria
(which is especially problematic when considering thousands
of traits); and these approaches force one to model directly all
possible hidden variables, making typically unverifiable
assumptions about their underlying model [11].
Extensions to other data types
We have presented Trigger within the context of inferring
regulatory relationships based on gene expression data from
organisms with randomized genetic backgrounds. However,
this method may actually be applied to a much broader class
of data types. Because the estimation is done in a nonpara-
metric and scale-free manner (Materials and methods
[below] and Additional data file 1), it is possible to combine
any combination of expression, proteomic, metabolomic, and
phenotypic data as the variables among which causal rela-
tionships are inferred. These may be considered separately or
simultaneously, allowing one to discover regulatory relation-
ships, say, among protein levels and transcriptions levels. The
general requirement is that one must acquire organisms with
random genetic backgrounds that are essentially stable as the
expression levels and other potential traits are measured. The
computational approach and statistical principles underlying
the method remain the same for all of these data types.
Conclusion
The Trigger algorithm allows one to infer transcriptional reg-
ulatory relationships among genes at the genome-wide level,
based on experiments in which large-scale genotyping and
expression profiling are performed among individuals with
randomized genetic backgrounds. Moreover, the algorithm
can be applied to any high-throughput phenotypic data in
which genotypes or some other static regulatory mechanism
has been randomized. Trigger works by identifying pairs of
genes with expression levels both affected by a common ran-
domized genotype and then testing for three key properties
that we have mathematically demonstrated to be equivalent
to a directed causal relationship among the pair of gene
expression traits.
We applied Trigger to an experiment in yeast in which 112
independent recombinant segregants were subjected to
genome-wide expression monitoring. The Trigger algorithm
produced a regulatory probability matrix from this experi-
ment that has been made available (Additional data file 2).
This matrix can be used to build networks by a variety of
Genome Biology 2007, Volume 8, Issue 10, Article R219 Chen et al. R219.9
Genome Biology 2007, 8:R219
techniques in which the noise level of any resulting network is
easily assessed by the FDR. Our analysis of the results indi-
cates that the proposed algorithm produces rich and
biologically coherent information, mainly through a GO anal-
ysis of four putative regulators (CNS1, ILV6, SAL1, and
NAM9).
Some caveats and limitations of the proposed approach are
apparent. First, for any gene to be identified in a causal rela-
tionship, it must be linked to some locus. This is because the
expression levels must be subjected to randomization based
on the randomization of the genotypes. Therefore, this
approach will not find all causal relationships. Second, a com-
prehensive genetic network requires additional measure-
ments beyond transcriptional levels. Although it is
straightforward to include all quantitative information in
Trigger, such as transcription, protein, metabolite, and phe-
notype levels, it is not clear how to include important qualita-
tive information, such as known protein interactions or
transcription factor binding sites. The Trigger approach
would have to be extended or combined with an existing
approach to incorporate such data types.
The approach we have proposed is an early step toward mov-
ing beyond correlation and model selection based analyses of
high-throughput molecular profiling data. Trigger offers a
rigorous approach to inferring causality, based on the highly
successful concept of randomized experiments, which has
played a key role in science and medicine since its inception.
This work also contributes to a better understanding of the
ways in which multiple high-throughput data types can be
combined to produce more informative estimates of the
highly complex molecular networks underlying organisms.
Materials and methods
Expression measurements and genotyping
The expression and genotype data were recently reported
elsewhere [12,33]. In that work, 112 segregants (one from
each tetrad) were grown from a cross involving parental
strains BY4716 (isogenic to the laboratory strain S288C) and
the wild isolate RM11-1a. RNA was isolated and cDNA was
hybridized to microarrays in the presence of the same BY ref-
erence material. Each array assayed 6216 yeast open reading
frames. GeneChip Yeast Genome S98 microarrays were pur-
chased from Affymetrix (Santa Clara, CA, USA). Genotyping
was performed using GeneChip Yeast Genome S98 microar-
rays (Affymetrix) on all 112 F
1
segregants. The resulting
genetic map of 3,312 markers covered more than 99% of the
genome.
Assumptions regarding random genotypes
We simply point out here that the main assumption regarding
random genotypes is that the L
i
are random variables occur-
ring before and independently from the subsequently meas-
ured expression values. We also assume that the alleles
A comparison of Trigger with correlation and model selection for inferring existence causal relationship with CNS1Figure 5
A comparison of Trigger with correlation and model selection for inferring
existence causal relationship with CNS1. (a) Significance ranking according
to Trigger versus the ranking according to correlation. Although this plot
is not calculated conditional on linkage to the CNS1 locus, the plot
conditional on linkage yields an equivalent qualitative conclusion. (b)
Significance ranking according to Trigger versus the ranking according to
model selection. For CNS1 and each gene, AIC was employed to selection
among models capturing causality (M1), an inconclusive relationship (M2),
linkage only (M3), and independence (M4). The x-axis is broken up into
models M1 to M4; within each model type the genes were ranked
according to their AIC score. For both correlation and model selection, it
can be seen that there is not a strong relationship with Trigger in terms of
the ranking, although a ranking in both is clearly necessary for a high
Trigger probability. Note that many Trigger probabilities are zero, so the
ranking does not extend all of the way to 6,216.
Correlation significance rank
AIC rank
TRIGGER significance rank
TRIGGER significance rank
(a)
(b)
0
1,000 2,000 3,000 4,000 5,000 6,000
0
1,000
2,000 3,000
0
M4
0
1,000
2,000 3,000
M3M2M1
Genome Biology 2007, 8:R219
Genome Biology 2007, Volume 8, Issue 10, Article R219 Chen et al. R219.10
inherited by different individuals at a fixed locus occurs inde-
pendently; in other words, we assume that the crosses have
been carried out independently. (If related segregants or off-
spring are collected, then Trigger can be adjusted to account
for this.) However, we do not assume that the inheritance at
several loci on a given chromosome occurs independently,
and we make no other assumptions about independence of
inheritance among loci. Segregation distortion, selection, and
other traditionally problematic issues arising when perform-
ing genetic crosses for the purpose of genetic mapping do not
invalidate Trigger.
As in all genetic crosses, the more independent the inherit-
ance of the loci is, the more information there is in the exper-
iment. For example, suppose that loci L
i
and L
k
are dependent
(for instance, they are located on the same chromosome, or
their segregation is dependent because of selection). Suppose
also that L
i
→ T
i
→ T
j
and L
k
→ T
j
, but it is not the case that L
k
→ T
i
. Because L
i
and L
k
are dependent, it will not be the case
that L
i
⊥ T
j
| T
i
, as not all linkage information for T
j
is captured
by T
i
. Specifically, L
i
contains some information about L
k
because of their dependence, so T
j
| T
i
is not independent
from L
i
. This is an example of how dependence of inheritance
of different loci can reduce the power of Trigger. However,
Trigger does not produce false positives because of this, so it
is robust to linkage among loci on the same chromosome or
other forms of dependence among loci.
Proof of causality equivalence theorem
The proof of the theorem follows from well-established theory
in graphical and causal modeling [35,61,63]. Several basic
assumptions are typically made in causal modeling to avoid
nonsensical situations. The 'causal Markov assumption'
states that in a causal model, each variable is independent of
all of its non-descendants given information about all of its
direct causes. The 'faithfulness assumption' states that any
conditional independence relationships in the population
exist in the presence of the causal Markov assumption. Under
the faithfulness assumption, conditional independence of two
variables implies there is no direct edge between the two. Our
proof also relies on the known result that if a hidden variable
is causal for both X and Y, then the directed graph associated
with X and Y can be represented by X → Y [63].
We first show that if L → T
i
→ T
j
with no hidden variables
causal for both T
i
and T
j
, then L → T
i
, L → T
j
, and L ⊥ T
j
| T
i
.
Under these assumptions, the first two properties (L → T
i
and
L → T
j
) are trivially true. Because there are no hidden varia-
bles involved, T
i
is the only direct cause of T
j
, and L is a non-
descendant of T
j
, it follows by the causal Markov assumption
that the third property (L ⊥ T
j
| T
i
) holds.
We now show the more important direction of this equiva-
lence: if L → T
i
, L → T
j
, and L ⊥ T
j
| T
i
, then L → T
i
→ T
j
and
there are no hidden variables causal for both T
i
and T
j
. The
third property (L ⊥ T
j
| T
i
) implies that there is no direct edge
between L and T
j
by the faithfulness assumption.
Let us first consider the case when there are no hidden varia-
bles causal for both T
i
and T
j
, so that the only variables
involved in this causal graph are L, T
i
, and T
j
. Because of the
second property (L → T
j
), and there is no direct edge between
L and T
j
, it must follow that there is a direct edge between T
i
and T
j
. Otherwise, T
j
is completely independent of L, which
violates the second property. Thus, L → T
i
- T
j
, where an edge
without arrowheads implies dependence. If any two variables
are dependent, then one is a cause of the other or there must
be a third variable causal for both [63]. Thus, either T
i
is
causal for T
j
, or T
j
is causal for T
i
, or both cases are true. L can-
not be the common direct cause for both T
i
and T
j
, because no
direct edge exists between L and T
j
. If L is an indirect cause of
T
j
, then T
i
as the only other variable in the graph must be a
direct cause of T
j
, implying that T
i
→ T
j
. If T
j
→ T
i
and the first
property (L → T
i
) holds, then it cannot be the case that the
third property (L ⊥ T
j
| T
i
) holds. Thus, T
j
is not causal for T
i
but it is true that T
i
→ T
j
, implying that L → T
i
→ T
j
.
Now consider the second case in which there might be causal
hidden variables in the graph. Because L is an independently
randomized, static variable, there cannot be any hidden vari-
ables causal for both L and T
i
or both L and T
j
. The only pos-
sible existence of hidden causal variable in this graph is one
affecting both T
i
and T
j
. However, if there is a common hidden
cause for T
i
and T
j
, then T
i
→ T
j
[63]. If this is true, then T
j
| T
i
is dependent with L, contradicting the third property (L T
j
|
T
i
). Therefore, L → T
i
→ T
j
with no hidden variables affecting
either of the two.
Note that it can be shown that the second and third properties
(L → T
j
and L ⊥ T
j
| T
i
, respectively) imply the first property (L
→ T
i
). However, we have designed Trigger to test for all three
properties because conditioning on the first property
increases the power to detect the state of the second and third
properties.
Estimation of regulatory probabilities
The following method was developed to estimate the regula-
tory probabilities. Recall that by the causality equivalence
theorem:
P
ij
= Pr(L
i
→ T
i
→ T
j
)
= Pr(L
i
→ T
i
) × Pr(L
i
→ T
j
| L
i
→ T
i
)
× Pr(L
i
⊥ T
j
| T
i
| L
i
→ T
i
and L
i
→ T
j
)
To compute the joint posterior probability, the probabilities
on the right hand side of the equation are estimated from left
to right in that respective order. The basic algorithm works as
follows (with specific details following) (Note that further
details about steps 1 to 6 can be found in Additional data file 1.)
Genome Biology 2007, Volume 8, Issue 10, Article R219 Chen et al. R219.11
Genome Biology 2007, 8:R219
Step 1
Transform the expression data for each gene to follow a Nor-
mal distribution with mean 0 and variance 1.
Step 2
For each transcript, T
i
(i = 1, 2, , m), test the null hypothesis
of no cis linkage to L
i
versus the alternative hypothesis of cis
linkage to L
i
by performing a standard likelihood ratio test to
obtain observed statistics X
i
(i = 1, 2, , m). Permute the
expression data B times and perform the test on the permuted
data to obtain null statistics (b = 1, 2, , B). This is
equivalent to testing L
i
→ T
i
.
Step 3
For each pair (L
i
, T
i
) from step 2, carry out the following. For
all other transcripts T
j
(j ≠ i), test the null hypothesis of no
linkage to L
i
versus the alternative hypothesis of linkage to L
i
under the assumption that L
i
→ T
i
. Similarly to above, apply a
standard likelihood ratio test to obtain observed statistics Y
ij
.
Permute the expression data B times under the assumption
that L
i
→ T
i
, and perform the test on the permuted data to
obtain null statistics (b = 1, 2, , B).
Step 4
For each triplet (L
i
, T
i
, T
j
), carry out the following. Estimate
the conditional distribution of T
j
| T
i
, which is tractable under
the Normal transformation. Test the null hypothesis of inde-
pendence between L
i
and T
j
| T
i
versus the alternative hypo-
thesis of dependence between L
i
and T
j
| T
i
. Again, apply a
standard likelihood ratio test to obtain observed statistics Z
ij
for this test. Permute the expression data B times under the
assumption that L
i
→ T
i
and L
i
→ T
j
, and perform the test on
the permuted data to obtain null statistics (b = 1, 2, ,
B).
Step 5
For each test from steps 2 to 4, the set of observed statistics
and null statistics can be used to estimate the probability that
the hypothesis of interest is true, based on previous method-
ology [17,26,64]. For example, the observed statistics X
i
(i = 1,
2, , m) and null statistics (i = 1, 2, , m; b = 1, 2, , B)
from step 2 can be used to form an empirical Bayes estimate
of Pr(L
i
→ T
i
), which is equivalent to an estimate of the
probability that the alternative hypothesis is true for each i =
1, 2, , m. The statistics from step 3 are used to estimate Pr(L
i
→ T
j
| L
i
→ T
i
), and the statistics from step 4 are used to esti-
mate Pr(L
i
⊥ T
j
| T
i
| L
i
→ T
i
and L
i
→ T
j
).
Step 6
Multiply the three estimated probabilities together to get an
estimate of P
ij
= Pr(L
i
→ T
i
→ T
j
), where:
False discovery rate estimation
A significance threshold can be applied to the probabilities for
either the entire regulatory probability matrix or for a specific
putative regulator. For the entire probability matrix, this
would entail applying a threshold λ to the , where we call
L
i
→ T
i
→ T
j
significant if and only if ≥ λ. For a given puta-
tive regulator, the exact same thresholding would take place,
except only the for a fixed putative regulator, gene i,
would be considered. The estimate of the FDR corresponding
to λ, FDR(λ), is as follows:
Where 1( ≥ λ) is 1 or 0 according to whether ≥ λ or not,
respectively, and # { ≥ λ} is the total number of ≥ λ
[17,65]. Further details and justification can be found in Addi-
tional data file 1.
Abbreviations
FDR, false discovery rate; GO, Gene Ontology; Hsp, heat
shock protein; QTL, quantitative trait locus; Trigger, Tran-
scriptional Regulation Inference from Genetics of Gene
ExpRession.
Authors' contributions
LSC and JDS conceived the research, developed the methods,
and wrote the paper. LSC analyzed the data. FES provided the
visual organization of the network drawn in Figure 2.
Additional data files
The following additional data are available with the online
version of this paper. Additional data file 1 contains the sup-
plementary text and figures. Additional data file 2 contains
the entire matrix of regulatory probabilities for all genes,
where the rows are genes acting as regulators and the col-
umns are genes under regulation. Thus, the (i, j) entry of this
matrix is the probability that the expression level of gene i is
causal for the expression level of gene j. Additional data file 3
contains the list of significantly regulated genes, posterior
probabilities, and other relevant information for each of the
four putative regulators considered in detail.
Additional data file 1Supplementary text and figuresPresented are supplementary text and figures, as referenced in the main text.Click here for fileAdditional data file 2Entire matrix of regulatory probabilities for all genesPresented is the entire matrix of regulatory probabilities for all genes, where the rows are genes acting as regulators and the col-umns are genes under regulation. Thus, the (i,j) entry of this matrix is the probability that the expression level of gene i is causal for the expression level of gene j.Click here for fileAdditional data file 3Significantly regulated genes, posterior probabilities, and other rel-evant informationPresented is a list of significantly regulated genes, posterior proba-bilities, and other relevant information for each of the four putative regulators considered in detail.Click here for file
Acknowledgements
We would like to thank Leonid Kruglyak for generously sharing data. We
would also like to thank Joshua Akey, Troels Marstrand, Thomas Richard-
X
i
b0
Y
ij
b0
Z
ij
b0
X
i
b0
ˆˆ
()
ˆ
(|)
ˆ
(||PLTLTLTLTTLTL
ij ii i jii ijiii i
=→×→ →× →Pr Pr Pr and ? →→ T
j
)
ˆ
P
ij
ˆ
P
ij
ˆ
P
ij
FDR
P
ij
ij
P
ij
P
ij
ˆ
()
(
ˆ
,
)(
ˆ
)
#{
ˆ
}
λ
λ
λ
=
−
∑
≥
≥
11
ˆ
P
ij
ˆ
P
ij
ˆ
P
ij
ˆ
P
ij
Genome Biology 2007, 8:R219
Genome Biology 2007, Volume 8, Issue 10, Article R219 Chen et al. R219.12
son, and James Ronald for several helpful conversations. This research was
supported in part by NIH grant R01 HG002913.
References
1. Schena M, Shalon D, Davis RW, Brown PO: Quantitative monitor-
ing of gene expression patterns with a complementary DNA
microarray. Science 1995, 270:467-470.
2. MacBeath G, Schreiber SL: Printing proteins as microarrays for
high-throughput function determination. Science 2000,
289:1760-1763.
3. Matsuzaki H, Dong S, Loi H, Di X, Liu G, Hubbell E, Law J, Berntsen
T, Chadha M, Hui H, et al.: Genotyping over 100,000 SNPs on a
pair of oligonucleotide arrays. Nat Methods 2004, 1:109-111.
4. Barabasi AL, Oltvai Z: Network biology: Understanding the
cell's functional organization. Nat Rev Genet 2004, 5:101-113.
5. Ideker T: Systems biology 101: what you need to know. Nat
Biotechnol 2004, 22:473-475.
6. Lynch M, Walsh B: Genetics and Analysis of Quantitative Traits Sinauer
Associates, Sunderland, MA USA; 1998.
7. Weinzierl R: Mechanisms of Gene Expression: Structure, Function and
Evolution of the Basal Transcriptional Machinery World Scientific Publish-
ing Company, Hackensack, NJ USA; 1999.
8. Gasch AP, Spellman PT, Kao CM, Carmel-Harel O, Eisen MB, Storz
G, Botstein D, Brown PO: Genomic expression programs in the
response of yeast cells to environmental changes. Mol Biol Cell
2000, 11:4241-4257.
9. Lee TI, Rinaldi NJ, Robert F, Odom DT, Bar-Joseph Z, Gerber GK,
Hannett NM, Harbison CR, Thompson CM, et al.: Transcriptional
regulatory networks in Saccharomyces cerevisiae . Science
2002, 298:799-804.
10. Brem RB, Storey JD, Whittle J, Kruglyak L: Genetic interactions
between polymorphisms that affect gene expression in
yeast. Nature 2005, 436:701-703.
11. Chu TJ, Glymour C, Scheines R, Spirtes P: A statistical problem
for inference to regulatory structure from associations of
gene expression measurements with microarrays. Bioinfor-
matics 2003, 19:1147-1152.
12. Brem RB, Yvert G, Clinton R, Kruglyak L: Genetic dissection of
transcriptional regulation in budding yeast.
Science 2002,
296:752-755.
13. Schadt EE, Monks SA, Drake TA, Lusis AJ, Che N, Colinayo V, Ruff
TG, Milligan SB, Lamb JR, Cavet G, et al.: Genetics of gene expres-
sion surveyed in maize, mouse, and man. Nature 2003,
422:297-302.
14. Yvert G, Brem RB, Whittle J, Akey JM, Foss E, Smith EN, Mackelprang
R, Kruglyak L: Trans-acting regulatory variation in Saccharomy-
ces cerevisiae and the role of transcription factors. Nat Genet
2003, 35:57-64.
15. Cheung VG, Conlin LK, Weber TM, Arcaro M, Jen KY, Morley M,
Spielman RS: Natural variation in human gene expression
assessed in lymphoblastoid cells. Nat Genet 2003, 33:422-425.
16. Lan H, Stoehr JP, Nadler ST, Schueler KL, Yandell BS, Attie AD:
Dimension reduction for mapping mRNA abundance as
quantitative traits. Genetics 2003, 164:1607-1614.
17. Storey JD, Akey JM, Kruglyak L: Multiple locus linkage analysis of
genomewide expression in yeast. PLoS Biology 2005, 3:e267
18. Rubin D: Estimating causal effects of treatments in rand-
omized and nonrandomized studies. J Educ Psychol 1974,
66:688-701.
19. Holland P: Statistics and Causal Inference. J Am Stat Assoc 1986,
81:945-960.
20. Greenland S: Randomization, statistics, and causal inference.
Epidemiology 1990, 1:421-429.
21. Cowles CR, Hirschhorn JN, Altshuler D, Lander ES: Detection of
regulatory variation in mouse genes. Nat Genet 2002,
32:432-437.
22. Oleksiak MF, Churchill GA, Crawford DL: Variation in gene
expression within and among natural populations. Nat Genet
2002, 32:261-266.
23. Jin W, Riley RM, Wolfinger RD, White KP, Passador-Gurgel G, Gib-
son G: The contributions of sex, genotype and age to tran-
scriptional variance in Drosophila melanogaster.
Nat Genet
2001, 29:389-395.
24. Yan H, Yuan W, Velculescu VE, Vogelstein B, Kinzler KW: Allelic
variation in human gene expression. Science 2002, 297:1143.
25. Rockman MV, Wray GA: Abundant raw material for cis-regula-
tory evolution in humans. Mol Biol Evol 2002, 19:1991-2004.
26. Storey JD, Tibshirani R: Statistical significance for genome-wide
studies. Proc Natl Acad Sci USA 2003, 100:9440-9445.
27. Gray R, Wheatley K: How to avoid bias when comparing bone
marrow transplantation with chemotherapy. Bone Marrow
Transplant 1991:9-12.
28. Smith GD, Ebrahim S: 'Mendelian randomization': can genetic
epidemiology contribute to understanding environmental
determinants of disease? Int J Epidemiol 2003, 32:1-22.
29. Schadt EE, Lamb J, Yang X, Zhu J, Edwards S, Guhathakurta D, Sie-
berts SK, Monks S, Reitman M, Zhang C, et al.: An integrative
genomics approach to infer causal associations between
gene expression and disease. Nat Genet 2005, 37:710-717.
30. Bing N, Hoeschele I: Genetical genomics analysis of a yeast seg-
regant population for transcription network inference.
Genetics 2005, 170:533-542.
31. Kulp D, Jagular M: Causal inference of regulator-target pairs by
gene mapping of expression phenotypes. BMC Genomics 2006,
7:125.
32. Li R, Tsaih SW, Shockley K, Stylianou IM, Wergedal J, Paigen B,
Churchill GA: Structural model analysis of multiple quantita-
tive traits. PLoS Genetics 2006, 2:e114.
33. Brem RB, Kruglyak L: The landscape of genetic complexity
across 5700 gene expression traits in yeast. Proc Natl Acad Sci
USA 2005, 102:1572-1577.
34. Passador-Gurgel G, Hsieh WP, Hunt P, Deighton N, Gibson G:
Quantitative trait transcripts for nicotine resistance in Dro-
sophila melanogaster . Nat Genet 2007, 39:264-268.
35. Spirtes P, Glymour C, Scheines R: Causation, Prediction, and Search 2nd
edition. MIT Press, Cambridge, MA USA; 2000.
36. Spirtes P, Glymour C, Scheines R: Constructing Bayesian net-
work models of gene expression networks from microarray
data. Proceedings of the Atlantic Symposium on Computational Biology,
Genome Information Systems & Technology; 2000.
37. Ashburner M, Ball CA, Blake JA, Botstein D, Butler H, Cherry JM,
Davis AP, Dolinski K, Dwight SS, Eppig JT: Gene ontology: Tool for
the unification of biology. The Gene Ontology Consortium.
Nat Genet 2000, 25:25-29.
38. Steinmetz LM, Scharfe C, Deutschbauer AM, Mokranjac D, Herman
ZS, Jones T, Chu AM, Giaever G, Prokisch H, Oefner PJ, et al.: Sys-
tematic screen for human disease genes in yeast. Nat Genet
2002, 31:400-404.
39. Boguta M, Dmochowska A, Borsuk P, Wrobel K, Gargouri A,
Lazowska J, Slonimski PP, Szczesniak B, Kruszewska A: NAM9
nuclear suppressor of mitochondrial ochre mutations in Sac-
charomyces cerevisiae codes for a protein homologous to S4
ribosomal proteins from chloroplasts, bacteria, and
eucaryotes. Mol Cell Biol 1992, 12:402-412.
40. Boguta M, Chacinska A, Murawski M, Szczesniak B: Expression of
the yeast NAM9 gene coding for mitochondrial ribosomal
protein. Acta Biochim Pol 1997, 44:251-258.
41. Biswas TK, Getz GS: The single amino acid changes in the yeast
mitochondrial S4 ribosomal protein cause temperature-sen-
sitive defect in the accumulation of mitochondrial 15S
rRNA. Biochemistry 1999, 38:13042-13054.
42. Marsh JA, Kalton HM, Gaber RF: Cns1 is an essential protein
associated with the hsp90 chaperone complex in Saccharo-
myces cerevisiae that can restore cyclophilin 40-dependent
functions in cpr7Delta cells. Mol Cell Biol 1998, 18:7353-7359.
43. Dolinski KJ, Cardenas ME, Heitman J: CNS1 encodes an essential
p60/Sti1 homolog in Saccharomyces cerevisiae that sup-
presses cyclophilin 40 mutations and interacts with Hsp90.
Mol Cell Biol 1998, 18:7344-7352.
44. Nathan DF, Vos MH, Lindquist S:
Identification of SSF1, CNS1,
and HCH1 as multicopy suppressors of a Saccharomyces
cerevisiae Hsp90 loss-of-function mutation. Proc Natl Acad Sci
USA 1999, 96:1409-1414.
45. Hainzl O, Wegele H, Richter K, Buchner J: Cns1 is an activator of
the Ssa1 ATPase activity. J Biol Chem 2004, 279:23267-23273.
46. Stoldt V, Rademacher F, Kehren V, Ernst JF, Pearce DA, Sherman F:
Review: the Cct eukaryotic chaperonin subunits of Saccharo-
myces cerevisiae and other yeasts. Yeast 1996, 12:523-529.
47. Kim S, Willison KR, Horwich AL: Cystosolic chaperonin subunits
have a conserved ATPase domain but diverged polypeptide-
binding domains. Trends Biochem Sci 1994, 19:543-548.
48. Pang SS, Duggleby RG: Expression, purification, characteriza-
tion, and reconstitution of the large and small subunits of
Genome Biology 2007, Volume 8, Issue 10, Article R219 Chen et al. R219.13
Genome Biology 2007, 8:R219
yeast acetohydroxyacid synthase. Biochemistry 1999,
38:5222-5231.
49. Cullin C, Baudin-Baillieu A, Guillemet E, Ozier-Kalogeropoulos O:
Functional analysis of YCL09C: evidence for a role as the
regulatory subunit of acetolactate synthase. Yeast 1996,
12:1511-1518.
50. Chen XJ: Sal1p, a calcium-dependent carrier protein that sup-
presses an essential cellular function associated with the
Aac2 isoform of ADP/ATP translocase in Saccharomyces cer-
evisiae . Genetics 2004, 167:607-617.
51. Belenkiy R, Haefele A, Eisen MB, Wohlrab H: The yeast mitochon-
drial transport proteins: new sequences and consensus resi-
dues, lack of direct relation between consensus residues and
transmembrane helices, expression patterns of the trans-
port protein genes, and protein-protein interactions with
other proteins. Biochim Biophys Acta 2000, 1467:207-218.
52. Pfeifer K, Kim KS, Kogan S, Guarente L: Functional dissection and
sequence of yeast HAP1 activator. Cell 1989, 56:291-230.
53. Keng T: HAP1 and ROX1 form a regulatory pathway in the
repression of HEM13 transcription in Saccharomyces cerevi-
siae . Mol Cell Biol 1992, 12:2616-2623.
54. Reed SH, You Z, Friedberg EC: The yeast RAD7 and RAD16
genes are required for postincision events during nucleotide
excision repair: in vitro and in vivo studies with rad7 and
rad16 mutants and purification of a Rad7/Rad16-containing
protein complex. J Biol Chem 1998, 273:29481-29488.
55. Guzder SN, Sung P, Prakash L, Prakash S: Yeast Rad7-Rad16 com-
plex, specific for the nucleotide excision repair of the non-
transcribed DNA strand, is an ATP-dependent DNA damage
sensor. J Biol Chem 1997, 272:21665-21668.
56. Weaver DC, Workman CT, Stormo GD: Modeling regulatory
networks with weight matrices.
Pac Symp Biocomput 1999,
4:112-123.
57. D'haeseleer P, Liang S, Somogyi R: Genetic network inference:
from co-expression clustering to reverse engineering. Bioin-
formatics 2000, 16:707-726.
58. Friedman N, Linial M, Nachman I, Pe'er D: Using Bayesian Net-
works to analyze expression data. J Comput Biol 2000, 7:601-620.
59. Friedman N: Inferring cellular networks using probabilistic
graphical models. Science 2004, 303:799-805.
60. Zhu J, Lum PY, Lamb J, GuhaThakurta D, Edwards SW, Thieringer R,
Berger JP, Wu MS, Thompson J, Sachs AB, et al.: An integrative
genomics approach to the reconstruction of gene networks
in segregating populations. Cytogenet Genome Res 2004,
105:363-374.
61. Pearl J: Causality: Models, Reasoning, and Inference Cambridge Univer-
sity Press; 2000.
62. Akaike H: A new look at the statistical model identification.
IEEE Trans Automatic Control 1974, 19:716-723.
63. Richardson T, Spirtes P: Ancestral graph Markov models. Ann
Stat 2002, 30:962-1030.
64. Storey JD: A direct approach to false discovery rates. J Roy Stat
Soc Ser B 2002, 64:479-498.
65. Newton MA, Noueiry A, Sarkar D, Ahlquist P: Detecting differen-
tial gene expression with a semiparametric hierarchical mix-
ture method. Biostatistics 2004, 5:155-176.
66. Lehmann EL: Nonparametrics: Statistical Methods Based on Ranks
Holden-Day; 1975.
67. Lehmann EL: Testing Statistical Hypotheses 2nd edition. Springer-Ver-
lag; 1986.
68. Anderson JA, Blair V: Penalized maximum likelihood estima-
tion in logistic regression and discrimination. Biometrika 1982,
69:123-136.