Báo cáo y học: " Gene expression profiling of Hfe-/- liver and duodenum in mouse strains with differing susceptibilities to iron loading: identification of transcriptional regulatory targets of Hfe and potential hemochromatosis modifiers" pdf
Bạn đang xem bản rút gọn của tài liệu. Xem và tải ngay bản đầy đủ của tài liệu tại đây (726.05 KB, 16 trang )
Genome Biology 2007, 8:R221
Open Access
2007Coppinet al.Volume 8, Issue 10, Article R221
Research
Gene expression profiling of Hfe
-/-
liver and duodenum in mouse
strains with differing susceptibilities to iron loading: identification of
transcriptional regulatory targets of Hfe and potential
hemochromatosis modifiers
Hélène Coppin
*†
, Valérie Darnaud
*†
, Léon Kautz
*†
, Delphine Meynard
*†
,
Marc Aubry
‡§
, Jean Mosser
‡§
, Maria Martinez
*†
and Marie-Paule Roth
*†
Addresses:
*
INSERM, U563, Centre de Physiopathologie de Toulouse Purpan, Toulouse, F-31300 France.
†
Université Toulouse III Paul-
Sabatier, IFR 30, Toulouse, F-31400 France.
‡
CNRS, UMR6061, Génétique et Développement, Rennes, F-35000 France.
§
Université de Rennes
1, IFR 140, Rennes, F-35000 France.
Correspondence: Marie-Paule Roth. Email:
© 2007 Coppin et al.; licensee BioMed Central Ltd.
This is an open access article distributed under the terms of the Creative Commons Attribution License ( which
permits unrestricted use, distribution, and reproduction in any medium, provided the original work is properly cited.
Abstract
Background: Hfe disruption in mouse leads to experimental hemochromatosis by a mechanism
that remains elusive. Affymetrix GeneChip
®
Mouse Genome 430 2.0 microarrays and
bioinformatics tools were used to characterize patterns of gene expression in the liver and the
duodenum of wild-type and Hfe-deficient B6 and D2 mice (two inbred mouse strains with divergent
iron loading severity in response to Hfe disruption), to clarify the mechanisms of Hfe action, and
to identify potential modifier genes.
Results: We identified 1,343 transcripts that were upregulated or downregulated in liver and 370
in duodenum of Hfe
-/-
mice, as compared to wild-type mice of the same genetic background. In liver,
Hfe disruption upregulated genes involved in antioxidant defense, reflecting mechanisms of
hepatoprotection activated by iron overload. Hfe disruption also downregulated the expression of
genes involved in fatty acid β-oxidation and cholesterol catabolism, and of genes participating in
mitochondrial iron traffic, suggesting a link between Hfe and the mitochondrion in regulation of
iron homeostasis. These latter alterations may contribute to the inappropriate iron deficiency
signal sensed by the duodenal enterocytes of these mice, and the subsequent upregulation of the
genes encoding the ferrireductase Dcytb and several iron transporters or facilitators of iron
transport in the duodenum. In addition, for several genes differentially expressed between B6 and
D2 mice, expression was regulated by loci overlapping with previously mapped Hfe-modifier loci.
Conclusion: The expression patterns identified in this study contribute novel insights into the
mechanisms of Hfe action and potential candidate genes for iron loading severity.
Published: 18 October 2007
Genome Biology 2007, 8:R221 (doi:10.1186/gb-2007-8-10-r221)
Received: 8 June 2007
Revised: 16 October 2007
Accepted: 18 October 2007
The electronic version of this article is the complete one and can be
found online at />Genome Biology 2007, 8:R221
Genome Biology 2007, Volume 8, Issue 10, Article R221 Coppin et al. R221.2
Background
Hereditary hemochromatosis (HH) accounts for most of the
iron overload disorders that occur in individuals of European
descent. It is an autosomal-recessive condition that is charac-
terized by increased absorption of iron from the gastrointes-
tinal tract and progressive accumulation of catalytically active
iron in parenchymal organs. This iron excess can cause tissue
damage and result in serious medical complications, includ-
ing cirrhosis, primary liver cancer, diabetes, cardiomyopathy,
endocrine dysfunction, and arthritis [1]. In Northern Europe,
most patients with HH are homozygous for a single mutation
(C282Y) in the HFE gene (which encodes the hereditary
hemochromatosis [HFE] protein) [2]. Although the C282Y
mutation disrupts a disulfide bond required for proper fold-
ing of the HFE molecule, the exact mechanisms by which HFE
regulates iron homeostasis remain elusive. HFE expression
can result in either the accumulation or the depletion of intra-
cellular iron stores, depending on the cell type, suggesting
that HFE interacts with other proteins that are involved in
either the import or the export of iron [3,4]. The challenge
remains to identify these proteins.
Despite its high prevalence (approximately 5/1,000 individu-
als of Northern European descent), C282Y homozygosity is
characterized by a low penetrance [5], and family studies have
shown that genetic factors contribute to this reduced pene-
trance [6]. Polymorphisms of modifier genes may have pro-
found effects on the dominance of the HFE gene defect itself
and explain individual variations in excess iron absorption
and their pathologic consequences among carriers of the HH-
predisposing genotype. However, the exact nature of these
modifier genes in HH remains unknown, which currently
precludes accurate prediction of who, among C282Y homozy-
gotes, is likely to develop clinically significant iron-storage
disease.
Murine models of iron loading, such as Hfe knockout mice
(Hfe
-/-
), provide a useful alternative to humans in which to
elucidate the physiologic pathways that are involved in the
HH disease process and identifying modifier loci [7,8]. We
previously reported that, compared with the inbred mouse
strain C57BL/6 (B6), the strain DBA/2 (D2) was particularly
susceptible to iron loading in response to Hfe disruption [9],
suggesting the existence of genes other than HFE that modify
the severity of iron accumulation. We therefore took advan-
tage of the marked phenotypic differences between these two
strains to localize five chromosomal intervals that control
hepatic iron loading [10]. Analysis of recombinant inbred
strains and exploration of strain-specific gene expression
changes that result from Hfe disruption should facilitate the
identification of the Hfe modifiers that account for variable
disease expression in these intervals.
Thus far, investigations of regulatory circuits in response to
Hfe disruption haves not addressed possible strain differ-
ences and have been limited to IronChip cDNA microarrays
customized to analyze a selection of 300 genes encoding pro-
teins that are directly involved in iron metabolism or in linked
pathways [11]. Of note, expression of genes that may still have
unsuspected importance in iron metabolism cannot be
explored using these customized microarrays. Our goal in the
present study was to identify functional classes of genes and
individual candidates that are involved in the perturbation of
mechanisms of iron homeostasis that results from Hfe dis-
ruption, and to identify differences in gene expression pro-
files between the inbred mouse strains B6 and D2 that could
explain their difference in iron accumulation. To achieve this
goal, we used Affymetrix GeneChip
®
Mouse Genome 430 2.0
arrays containing 45,101 probe sets for over 39,000 tran-
scripts, including 34,000 well characterized mouse genes,
and bioinformatics tools to characterize expression networks
in the duodenum and the liver of wild-type control and Hfe
-/-
B6 and D2 mice.
Results
Differential gene expression between Hfe-deficient and
wild-type mice
Microarray studies of liver and duodenum from Hfe
-/-
mice
identified 1,343 transcripts that were upregulated or down-
regulated in liver of either B6 or D2 Hfe
-/-
mice, as compared
with wild-type mice of the same genetic backgrounds. Much
fewer genes, namely 370, were upregulated or downregulated
in the duodenum of these mice. A list of the transcripts differ-
entially regulated between Hfe-deficient and wild-type mice
is provided in Additional data files 1 (liver) and 2 (duode-
num). As shown in Figure 1, more transcripts were regulated
in Hfe-deficient D2 mice than in B6 mice, and this difference
was particularly striking in duodenum.
In liver, clustering analysis detected groups of transcripts that
were similarly regulated in response to Hfe disruption in B6
and D2 mice (specifically, they were either downregulated
[Figure 2, cluster 4] or upregulated [cluster 5] in both
strains). However, most of the transcripts modulated after
Hfe disruption had expression patterns that were strain spe-
cific (regulated only in D2 mice [clusters 1 and 6] or only in B6
mice [clusters 3 and 8]).
In duodenum of B6 mice, the expression of fewer than 20
genes was significantly modified by Hfe deficiency (Figure 1).
Consequently, clustering analysis was essentially based on
expression changes in D2 mice. Two main clusters were
therefore identified in duodenum, one with genes upregu-
lated (cluster 1, Additional data file 2) and the other with
genes downregulated (cluster 3, Additional file 2) in response
to Hfe disruption in D2 mice.
Enriched functional categories in the liver of Hfe-
deficient mice
The Database for Annotation, Visualization, and Integrated
Discovery (DAVID) annotation tool was used to search for
Genome Biology 2007, Volume 8, Issue 10, Article R221 Coppin et al. R221.3
Genome Biology 2007, 8:R221
over-representation of functional categories within the differ-
ent gene clusters from Figure 2. Categories found to be
enriched within the clusters of genes similarly regulated in
the liver of Hfe
-/-
compared with wild-type mice are summa-
rized in Table 1. As detailed below, they mainly concern
detoxification mechanisms in response to oxidative stress,
fatty acid β-oxidation, cholesterol catabolism, and circadian
rhythm.
Detoxification mechanisms in response to oxidative stress
The 84 genes from cluster 5 (Figure 2) and the 248 genes
from cluster 1 that were induced by Hfe-deficiency in the liver
were particularly enriched for functional categories associ-
ated with response to oxidative stress and iron ion binding
(Table 2). Excess iron is known to generate reactive oxygen
species that promote cell damage and fibrosis, and may be
responsible for the induction of the aldehyde oxidase and
NADPH (nicotinamide adenine dinucleotide phosphate) oxi-
dase genes observed in these mice. This appears to be coun-
terbalanced by upregulation of genes involved in the
glutathione metabolism pathway, in particular genes encod-
ing enzymes that are responsible for glutathione synthesis
(Gclc, Gclm, and Gss) and glutathione S-transferases, which
catalyze the conjugation of reduced glutathione to elec-
trophilic centers on a wide variety of substrates; the latter
activity is useful in the detoxification of endogenous com-
pounds such as peroxidized lipids. Excess iron also appears to
be counterbalanced, particularly in Hfe
-/-
D2 mice, by upreg-
ulation of genes encoding uridine 5'-diphospho (UDP)-glu-
curonosyltransferases, which catalyze the glucuronidation
reaction (the addition of sugars to lipids), which is an impor-
tant step in the body's elimination of endogenous toxins. In
addition, there was an enrichment, most notably in Hfe
-/-
D2
mice, of genes with mono-oxygenase activity, particularly
genes encoding several cytochrome P450 isoforms and flavin-
containing mono-oxygenase-5, which are considered to be
xenobiotic detoxication catalysts and believed to protect
mammals from lipophilic nucleophilic chemicals [12]. The
iron ion binding category, also enriched in the liver of both
strains, includes the genes for ferroportin, ferritin light chain,
and heme oxygenase, which catalyzes the degradation of
heme into carbon monoxide and biliverdin. Of note, although
expression of vanin1 was downregulated in mice lacking Hfe
in both strains (cluster 4), this regulation is worth noting
because mice deficient in vanin-1 exhibit a glutathione-medi-
ated tissue resistance to oxidative stress [13].
Fatty acid
β
-oxidation and cholesterol catabolism
The 139 genes from cluster 4 (Figure 2) and the 315 genes
from cluster 6, which were repressed in liver by Hfe defi-
ciency, were particularly enriched for functional categories
associated with lipid metabolism (Table 3). In particular,
genes encoding the rate-limiting enzyme for β-oxidation of
long-chain fatty acids (Cpt) and the transcripts for enzymes
involved in the three steps of β-oxidation were all signifi-
cantly downregulated. The expression of the Cyp4a10 and
Cyp4a14 genes was also repressed in Hfe
-/-
mice of both
strains, which could be a physiologic response in the context
of the reduced fatty acid β-oxidation. With a decrease in
acetyl-coenzyme A generated by decreased β-oxidation, a
decrease in citrate (the first intermediate generated in the tri-
carboxylic acid [TCA] cycle) would be expected in the mito-
chondria of Hfe
-/-
mice, with a subsequent slowing of the TCA
cycle. Indeed, a downregulation of mitochondrial aconitase
and isocitrate dehydrogenase suggests that the flux through
the TCA cycle is maintained at a low level in order to adapt to
the downregulated β-oxidation in these Hfe-deficient mice.
Interestingly, the cholesterol metabolism category is also
enriched among genes downregulated by Hfe deficiency in D2
mice, and this mainly affects genes that are involved in the
catabolism of cholesterol into bile acids (Cyp7a1 and
Cyp39a1).
Circadian rhythm
Hfe
-/-
mice of both strains exhibit reduced expression of genes
encoding Period (Per2 and Per3), D site albumin promoter
binding protein (Dpb), and the nuclear receptor subfamily 1
(Nr1d1). Although surprising, this can be related to the recent
observation that the circadian clock and heme biosynthesis
are reciprocally regulated in mammals [14] and may be corre-
lated with the upregulation of δ-aminolevulinate synthase
(Alas2) in the liver of these mice.
Other variations of potential interest
Hfe
-/-
D2 mice exhibit increased expression of the gene
encoding 3β-hydroxysteroid dehydrogenase (Hsd3b5), which
is thought to be involved in the inactivation of steroid hor-
mones, for example dihydrotestosterone [15]. They also
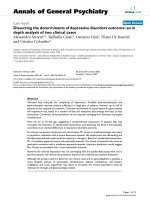
Number of genes regulated by Hfe disruption by mouse strain and organ studiedFigure 1
Number of genes regulated by Hfe disruption by mouse strain and organ
studied. Genes regulated by Hfe disruption identified by statistical analysis
of microarrays (SAM) were filtered to summarize the number of
upregulated or downregulated genes in liver and duodenum. Genes were
included if the mean S-score across three independent comparisons was
≥2 or ≤-2.
B6 D2 B6 D2
Liver Duodenum
0
100
200
300
400
500
Number of genes
Up-regulated
Down-regulated
Genome Biology 2007, 8:R221
Genome Biology 2007, Volume 8, Issue 10, Article R221 Coppin et al. R221.4
exhibit induction of the dopachrome tautomerase gene (Dpt),
which affects pigmentation [16]. It would be interesting to
investigate whether these variations in gene expression are
related to the deficit in testosterone and melanodermia
observed in patients with severe hemochromatosis.
Enriched functional categories in the duodenum of Hfe-
deficient mice
As shown in Table 4, there was no clearly enriched functional
categories among the 177 genes (cluster 1) that were induced
in #Hfe
-/-
D2 mice. Conversely, there was significant enrich-
ment of genes involved in the immune defense among the 131
genes that were repressed in the same mice (cluster 3), partic-
ularly for genes involved in apoptosis (Casp4, Cdca7l, Ifit1
and Ifit2, Oasl2, and Scotin), innate antiviral or antimicrobial
activity (Defcr4, Ddx58, and Lzp-s), and B and T cell medi-
ated immune response (Mpa2l, Psme1, Trfrsf13b, and
Tnfrsf17). This suggests a link between the control of iron
metabolism and the immune system that should be explored.
Although mRNAs for duodenal iron transporters were not
found to be significantly upregulated, expression levels of
other metal ion transporters were increased in duodenum of
Hfe
-/-
D2 mice, most notably the zinc transporters Slc39a4
and Slc39a14. The copper transporter Slc31a1 and, more
anecdotally, the sodium-dependent vitamin C transporter
Slc23a2 (previously observed to be increased in response to
dietary iron deprivation [17]) were also induced in D2 mice
lacking Hfe. In addition, Hfe
-/-
D2 mice had increased expres-
sion of the mucin (Muc3) and spermin synthase (Sms) genes,
which encode proteins that both may modulate iron uptake
[18,19].
Changes in expression of genes encoding proteins of
iron metabolism
The Affymetrix GeneChip
®
Mouse Genome 430 2.0 arrays
contain probe sets for the transcripts of all the genes directly
or indirectly involved in iron metabolism [20]. Significant
alterations in their expression in liver or duodenum of Hfe
-/-
mice and gene expression differences between wild-type
strains are summarized in Table 5. Specifically in the D2
strain, Hfe disruption induces expression of the Cybrd1 gene
in duodenum; this gene encodes Dcytb, which converts
dietary ferric iron into its ferrous form for transport. In the
liver, Hfe-deficient mice of both strains exhibit upregulated
expression of the gene encoding the ferritin light chain, which
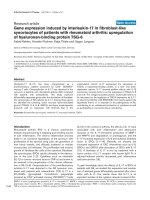
Figure 2
2
1
4
3
5
4
7
5
6
8
D2 WT vs
B6 WT
B6 KO vs
B6 WT
D2 KO vs
D2 WT
Genes regulated by Hfe deficiency in D2 and B6 liverFigure 2
Genes regulated by Hfe deficiency in D2 and B6 liver. A tree view image of
k-means clustering for 1,343 genes regulated by Hfe disruption in liver of
D2 or B6 mice is shown. Genes were selected by statistical filtering of
knockout (KO) versus wild-type (WT) S-scores, as described in Materials
and methods. Corresponding values for wild-type D2 versus B6 S-scores
are also shown. Red indicates upregulation by Hfe deficiency or more
highly expressed in D2 mice; green indicates downregulation by Hfe
deficiency or more highly expressed in B6 mice; and black indicates no
difference.
Genome Biology 2007, Volume 8, Issue 10, Article R221 Coppin et al. R221.5
Genome Biology 2007, 8:R221
is responsible for cytosolic iron storage, and of the ferroportin
gene, which is consistent with the notion that this protein
plays a protective role by facilitating the release of excess iron
[21]. Somewhat unexpectedly, we observed significant down-
regulation of the sideroflexin gene (Sfxn2) and upregulation
of the mitoferrin gene (Slc25a37) and the Bcrp gene (Abcg2),
which encode three molecules that are involved in the mito-
chondrial import/traffic of iron and heme export. Also worthy
of mention are several strain-specific modifications of the
messengers of some regulators of iron metabolism in Hfe-
deficient mice. First, we confirmed that wild-type B6 and D2
diverge in terms of the amounts of the two hepcidin messen-
gers, namely Hamp1 and Hamp2 [22], and we observed a
downregulation of the two genes in Hfe
-/-
D2 mice. Con-
versely, we observed significant upregulation of the gene
encoding the upstream transcription factor Usf2, which was
recently found to be involved in the control of hepcidin
expression [23], in the B6 strain. Finally, and worthy of note
within the context of modifiers of iron loading severity, wild-
type D2 mice have significantly lower expression of the
Smad4 transcription factor, also involved in the control of
hepcidin expression, than wild-type B6 mice.
Confirmation of differential gene expression by
quantitative PCR
Quantitative real-time PCR was performed on 21 genes
expressed in the liver and four genes expressed in the duode-
num. The selection of these genes was based on different cri-
teria. The first group included genes of an enriched functional
category identified using the DAVID annotation tool (Aox1,
Ftl1, Fpn1, Hmox1, Vnn1, Por, Cpt1a, Aco2, Cyp7a1, and
Hsd3b5). The second group of genes encode proteins of iron
or heme metabolism, and their expression was either induced
or repressed in Hfe
-/-
mice (Hfe2, Hamp1, Hamp2, Usf2,
Lcn2, Sfxn2, Alas2, Slc25a37, and Abcg2). The third group
encode proteins that might modulate iron absorption in the
duodenum (Dcytb, Slc39a4, and Muc3). The fourth group
includes genes that, although their involvement in iron
metabolism regulation cannot be assumed, were highly regu-
lated in liver (Lcn13 and Fmo3) or duodenum (Clca4) of
Table 1
Functional categories over-represented in clusters of genes similarly regulated by Hfe-disruption in the liver
Category Term n EASE score
Cluster 1 (284 Affy IDs [248 genes])
GOTERM_BP Steroid metabolism 11 1.4 × 10
-5
GOTERM_MF Mono-oxygenase activity 10 3.7 × 10
-5
GOTERM_MF UDP glucuronosyltransferase activity 5 2.9 × 10
-2
Cluster 3 (218 Affy IDs [196 genes])
No functional category overrepresented
Cluster 4 (145 Affy IDs [139 genes])
GOTERM_BP Rhythmic process 6 6.5 × 10
-5
KEGG_PATHWAY Fatty acid metabolism 7 3.2 × 10
-6
GOTERM_BP Defense response 14 4.7 × 10
-3
GOTERM_BP Nitrogen compound metabolism 9 5.6 × 10
-3
Cluster 5 (94 Affy IDs [84 genes])
KEGG_PATHWAY Glutathione metabolism 8 5.8 × 10
-8
GOTERM_MF Iron ion binding 8 2.7 × 10
-4
Cluster 6 (364 Affy IDs [315 genes])
SP_PIR_KEYWORDS Fatty acid metabolism 15 2.5 × 10
-14
SP_PIR_KEYWORDS Oxidoreductase 31 1.1 × 10
-8
GOTERM_MF Iron ion binding 19 1.6 × 10
-6
KEGG_PATHWAY Bile acid biosynthesis 6 1.1 × 10
-3
GOTERM_BP Cholesterol metabolism 6 3.2 × 10
-3
Cluster 8 (219 Affy IDs [209 genes])
No functional category overrepresented
Affymetrix probesets in the different k-means clusters shown in Figure 2 were compared with Affymetrix MG-430 2.0 probe sets for over-
representation of gene categories, using the DAVID (Database for Annotation, Visualization, and Integrated Discovery) functional annotation tool.
The Category column shows the original database/resource from which the terms originate. The Term column indicates enriched terms associated
with the gene list. The n column indicates the number of genes involved in the term. The expression analysis systematic explorer (EASE) score is a
modified Fisher exact P value [51]. BP, biological processes; GO, Gene Ontology; KEGG, Kyoto Encyclopedia of Genes and Genomes; MF, molecular
functions; PIR, Protein Information Resource; UDP, Uridine 5'-diphospho.
Genome Biology 2007, 8:R221
Genome Biology 2007, Volume 8, Issue 10, Article R221 Coppin et al. R221.6
Hfe
-/-
mice. A further 20 mice that were not analyzed using
Affymetrix arrays (five per genotype/strain combination)
were included in the analysis to test the validity of the results.
Concordant results were obtained for 24 out of 25 genes
selected. Downregulation of the hemojuvelin gene (Hfe2) in
Hfe
-/-
B6 mice was not confirmed. Downregulation of Lcn2,
Hamp1, and Hamp2 in Hfe
-/-
D2 mice was confirmed in the
samples used for Affymetrix array hybridizations but not in
the additional samples used for validation, although a trend
toward downregulation was observed in the validation set for
Hamp1 and Hamp2. The upregulation of Usf2 and Slc25a37,
originally found only in the liver of Hfe
-/-
B6 mice, was
observed by quantitative PCR in both strains. Interestingly,
Lcn13 and Fmo3 - which had highly significant S-scores of
11.06 and -6.66, respectively, in the liver of Hfe
-/-
D2 mice -
were confirmed to be regulated by Hfe deficiency in both
datasets. Because neither of these two genes is regulated by
dietary iron content in wild-type mice (data not shown), these
variations appear specific to Hfe disruption and warrant fur-
ther investigation.
Table 2
Main genes regulated by Hfe deficiency in liver and pertaining to enriched functional categories related to response to oxidative stress
Gene Protein S-score
D2 KO versus WT B6 KO versus WT D2 WT versus B6 WT
Glutathione metabolism pathway
Gclc Glutamate-cysteine ligase, catalytic subunit 3.68 4.74 3.24
Gclm Glutamate-cysteine ligase, modifier subunit NS 4.11 NS
Gss Glutathione synthetase NS 2.15 NS
Gsta2 Glutathione S-transferase alpha2 8.83 9.10 NS
Gsta3 Glutathione S-transferase alpha3 2.44 2.24 NS
Gsta4 Glutathione S-transferase alpha4 4.64 5.99 4.35
Gstm1 Glutathione S-transferase mu1 NS 2.65 NS
Gstm3 Glutathione S-transferase mu3 3.04 4.04 2.56
Gstm6 Glutathione S-transferase mu6 3.36 2.26 NS
UDP glucuronosyltransferase activity
Ugt2b1 UDP glucuronosyltransferase 2B1 3.72 NS NS
Ugt2b5 UDP glucuronosyltransferase 2B5 2.56 3.91 NS
Ugt2b34 UDP glucuronosyltransferase 2B34 NS 2.25 NS
Ugt2b35 UDP glucuronosyltransferase 2B35 2.56 3.91 NS
Ugt2b36 UDP glucuronosyltransferase 2B36 4.66 NS -4.89
Mono-oxygenase activity
Cyp1a2 Cytochrome P450 1A2 3.14 2.60 3.49
Cyp2c29 Cytochrome P450 2C29 NS 2.79 4.84
Cup2c44 Cytochrome P450 2C44 3.07 NS -5.89
Cyp2c55 Cytochrome P450 2C55 3.94 6.22 4.43
Cyp2c70 Cytochrome P450 2C70 5.55 4.70 4.17
Cyp2j6 Cytochrome P450 2J6 2.70 NS NS
Cyp2j9 Cytochrome P450 2J9 NSD 2.91 2.14
Cyp2u1 Cytochrome P450 2U1 3.50 NS NS
Fmo5 Flavin mono-oxygenase 5 2.12 NS NS
Iron ion binding
Ftl1 Ferritin light chain 1 1.70 2.24 NS
Slc40a1 Ferroportin 3.18 4.89 3.94
Hmox1 Heme oxygenase 1 5.27 2.40 -3.66
Blvrb Biliverdin reductase (for information) 2.50 3.06 NS
Vnn1 Vanin 1 (for information) -4.27 -2.73 2.69
S-scores were obtained as described in Materials and methods and are proportional to fold changes. Positive S-scores indicate that the genes are
more highly expressed in knockout (KO) than in wild-type (WT) mice, or in WT D2 than in WT B6 mice. NS, not significant; UDP, Uridine 5'-
diphospho.
Genome Biology 2007, Volume 8, Issue 10, Article R221 Coppin et al. R221.7
Genome Biology 2007, 8:R221
Correlation of expression profiling with studies on Hfe
modifiers
Differences in liver or duodenal expression of specific genes
between B6 and D2 wild-type mice could contribute to the
divergent phenotypes induced by Hfe disruption in the two
strains. We therefore established a list of the 1,538 transcripts
with differential expression between wild-type D2 and B6
mice (Additional data file 3). In order to relate genomic
results to severity of hemochromatosis, we first identified 210
genes exhibiting differences in basal expression between
strains or with expression regulation in response to Hfe dis-
ruption, which reside within the five Hfe-modifier regions
that we previously mapped on chromosomes 3, 7, 8, 11, and 12
[10]. To identify those that could be potential candidates for
disease severity, we used the WebQTL interface to map the
loci that regulate the expression of these genes. The
information necessary to map these regulatory loci was avail-
able for a subset of 139 of these 210 genes.
Table 3
Main genes regulated by Hfe deficiency in liver and pertaining to the enriched functional categories fatty acid β-oxidation and cholesterol
metabolism
Gene Protein S-score
D2 KO versus WT B6 KO versus WT D2 WT versus B6 WT
Fatty acid β-oxidation
Cpt1a Carnitine palmitoyl transferase 1a -2.95 -1.94 NS
Cpt2 Carnitine palmitoyl transferase 2 -2.59 NS NS
Acadm Acyl-CoA dehydrogenase, medium chain -2.97 -1.80 NS
Acadl Acyl-CoA dehydrogenase, long chain -3.00 NS NS
Acadvl Acyl-CaA dehydrogenase, very long chain -2.40 NS NS
Ehhadh Enoyl-CoA hydratase/3-hydroxyacyl-CoA dehydrogenase -2.30 NS NS
Hadha Tripartite protein, alpha subunit -2.08 -1.58 NS
Hadhb Tripartite protein, beta subunit -2.96 -1.90 NS
Hadh2 Hydroxyacyl-CoA dehydrogenase type II NS -4.05 -4.61
Acox1 Acyl-CoA oxydase 1, palmitoyl (peroxisomal) -2.10 -1.63 -4.27
Cyp4a10 Cytochrome P450 4A10 -6.76 -2.46 NS
Cpy4a14 Cytochrome P450 4A14 -9.21 -3.09 NS
TCA cycle
Aco2 Aconitase 2, mitochondrial -2.14 -1.82 NS
Idh2 Isocitrate dehydrogenase 2, mitochondrial -2.09 NS NS
Cholesterol catabolism
Cyp7a1 Cholesterol 7α-hydroxylase -3.15 NS NS
Cyp39a1 Oxysterol 7α-hydroxylase -2.60 NS NS
S-scores were obtained as described in Material and methods and are proportional to fold changes. Negative S-scores indicate that the genes are
more highly expressed in wild-type (WT) than in knockout (KO) mice, or in WT B6 than in WT D2 mice. Variations in the expression of genes
involved in the tricarboxylic acid (TCA) cycle are provided for information. CoA, coenzyme A; NS, not significant.
Table 4
Functional categories over-represented in clusters of genes similarly regulated by Hfe disruption in duodenum
Category Term n EASE score
Cluster 1 (209 Affy IDs [177 genes])
No functional category overrepresented
Cluster 3 (141 Affy IDs [131 genes])
GOTERM_BP Defense response 21 1.6 × 10
-7
GOTERM_BP Induction of apoptosis 6 1.7 × 10
-3
Affymetrix probesets in the different k-means clusters shown in Additional data file 2 were compared with Affymetrix MG-430 2.0 probe sets for
over-representation of gene categories, using the DAVID (Database for Annotation, Visualization, and Integrated Discovery) functional annotation
tool. The Category column shows the original database/resource from which the terms originate. The Term column indicates enriched terms
associated with the gene list. The n column indicates the number of genes involved in the term. The expression analysis systematic explorer (EASE)
score is a modified Fisher exact P value [51]. BP, biological process; GO, Gene Ontology.
Genome Biology 2007, 8:R221
Genome Biology 2007, Volume 8, Issue 10, Article R221 Coppin et al. R221.8
We found that two genes on chromosome 3, four on chromo-
some 7, six on chromosome 8, 17 on chromosome 11, and one
on chromosome 12 exhibited highly significant evidence for
cis regulation (for regulation by a polymorphic variant
between B6 and D2 mice located in the region of the gene
itself; Table 6). None of them, except for Hamp, has yet been
implicated in iron metabolism.
Discussion
Recent advances in the field of iron metabolism have eluci-
dated basic processes of iron absorption and distribution in
mammals [24]. However, many aspects of iron metabolism
remain obscure, in particular the mechanisms by which HFE
regulates iron absorption. In this study we investigated the
expression patterns of 34,000 well characterized mouse
genes in liver and duodenum of wild-type and Hfe
-/-
mice of
two inbred strains with different susceptibilities to iron
accumulation.
Variations in duodenal gene expression in Hfe-deficient mice,
as compared with wild-type mice, are consistent with our pre-
viously reported hypothesis [9] that hyperabsorption of iron
in these mice reflects an inappropriate iron deficiency signal
that is sensed by duodenal enterocytes. Indeed, expression of
the Cybrd1 gene (encoding Dcytb, which converts dietary
ferric iron to its ferrous form for transport by the divalent
metal iron transporter Dmt1 to the duodenum) and the
expression levels of several metal ion transporters, most
notably the zinc transporters Zip4 (Slc39a4) and Zip14
(Slc39a14), were increased in the duodenum of Hfe
-/-
D2
mice. Although Hfe knockout was previously shown to
increase Cybrd1 expression [11] and mucosal reductase activ-
ity near the villus tips [25], the increase in expression of the
Table 5
Changes in expression of genes involved in iron metabolism
Gene Protein Major biochemical activity Role Organ S-score
D2 KO
versus
D2 WT
B6 KO
versus
B6 WT
D2 WT
versus
B6 WT
Iron storage
Ftl1 Ferritin L chain Fe mineralization Cytosolic storage Liver +1.70 +2.24 NS
Iron transport
Slc40a1 Ferroportin Membrane transporter Cellular export Liver +3.18 +4.89 +3.94
Abcg2 Bcrp Membrane transporter Possible mitochondrial heme
export
Liver +2.97 NS NS
Sfxn2 Sideroflexin2 Membrane transporter Mitochondrial traffic Liver -2.38 -2.16 NS
Slc25a37 Mitoferrin Membrane transporter Mitochondrial traffic Liver NS +2.28 NS
Lcn2 Lipocalin2 Siderophore iron binding Traffic of siderophore-bound iron Liver -2.91 NS NS
Receptors
Tfrc Transferrin receptor1 Transferrin binding Transferrin iron uptake Duodenum -2.07 NS NS
Lrp1 LRP/CD91 Hemoplexin receptor Hemoplexin uptake Liver NS -2.03 NS
Regulators
Ireb2 IRP2 RNA binding Control of cellular iron Duodenum +2.26 NS -2.64
Hamp1 Hepcidin 1 Ferroportin binding Control of systemic iron Liver -6.27 NS -3.57
Hamp2 Hepcidin 2 ? ? Liver -3.40 NS +3.36
Hfe HFE TfR1 binding ? Liver -7.96 -8.96 -3.16
Duodenum -5.70 -7.32 NS
Hfe2 HJV Neogenin binding Control of hepcidin expression Liver NS -2.01 NS
Fxn Frataxin Iron binding Chaperon for Fe-S synthesis Liver NS NS -3.09
Smad4 Smad4 Transcription factor Control of hepcidin expression Liver NS NS -3.59
Duodenum NS NS -5.05
Usf2 Usf2 Transcription factor Control of hepcidin expression Liver NS +2.08 NS
Oxidoreductases
Cybrd1 Dcytb Fe(III) reduction Facilitates duodenal transport by
DMT1
Duodenum +2.97 NS NS
Iron metabolism genes are cited in this table where significant expression variations in Hfe
-/-
mice (knockout [KO]) or expression differences
between wild-type (WT) strains were detected. S-scores were obtained as described in Material and Methods and are proportional to fold changes.
Positive S-scores indicate that the genes are more highly expressed in KO than in WT mice, or in WT D2 than in WT B6 mice. NS, not significant.
Genome Biology 2007, Volume 8, Issue 10, Article R221 Coppin et al. R221.9
Genome Biology 2007, 8:R221
two zinc transporters has not yet been observed and is inter-
esting within the context of recent reports indicating that
Zip4 is a minor intestinal iron importer [26] and that Zip14
mediates non-transferrin-bound iron uptake into cells [27].
Of note, Hfe
-/-
D2 mice also have increased duodenal expres-
sion of mucin and spermine synthase. Increased binding of
Dmt1 to mucin in vesicles near the intestinal surface was
observed in iron-deficient animals, which is believed to facil-
itate iron internalization [19], and recent studies have sug-
gested that polyamines such as spermine modulate iron
uptake [18].
Although it cannot be excluded that a slight upregulation of
the Cybrd1, Slc39a4, and Muc3 messengers also exists in Hfe
-
/-
B6 mice but does not reach a level detectable by microarray
or RT-PCR analysis, the differential expression of these genes
between Hfe
-/-
D2 and B6 mice does not appear to be related
to the individual capacity of the two strains to respond to an
iron-deficiency signal. Indeed, as shown in Figure 3, wild-
type mice of both B6 and D2 genetic backgrounds fed an iron-
deficient diet have induced duodenal expression of Cybrd1,
Slc39a4, and Muc3, as compared with wild-type mice of the
same genetic backgrounds fed a standard diet. Rather, the
Table 6
Genes differentially expressed between wild-type strains or regulated by Hfe deficiency, located within the chromosomal regions con-
taining Hfe-modifiers, and with evidence for cis regulation
Gene name Chromosome Position (Mb) Type Position of linkage
peak (Mb) for cis
regulator
Max LRS for cis
regulator
Clca2 3 144.73 D 144.70 to 144.94 46.7
Lphn2 3 148.87 S 149.36 to 151.27 15.5
Uble1a 7 15.49 S 15.19 to 15.53 51.53
Ckap1 7 29.93 S 29.49 to 30.12 53.8
Hamp1/Hamp2 7 30.63 L, S 30.43 to 34.11 18.9
Fxyd5 7 30.74 D 34.41 to 34.62 15.2
Gpsn2 8 86.46 S 83.77 to 85.83 15.2
Ddx39 8 86.61 L 86.07 to 88.74 12.7
2410018C20Rik 8 87.14 S 86.07 to 88.74 20.6
Ier2 8 87.55 L 86.07 to 88.74 15.9
Gadd45gip1 8 87.72 S 86.07 to 88.74 116.4
Prdx2 8 87.86 S 83.77 to 85.83 36.1
Pttg1 11 43.26 S 42.87 to 44.25 68.9
5730409G07Rik 11 45.79 S 42.21 to 46.06 16.4
2900006B13Rik 11 51.43 L, S 50.95 to 53.90 38.9
Tnip1 11 54.75 S 50.95 to 53.90 60.6
Sparc 11 55.24 S 55.24 to 55.92 26.1
Guk1 11 59.00 S 58.93 to 59.04 50.8
Sat2 11 69.44 S 69.42 to 70.27 133.2
Mpdu1 11 69.47 S 72.49 to 72.98 43.3
Asgr2 11 69.91 S 69.42 to 70.27 69.9
Rabep1 11 70.66 L 73.93 to 75.08 18.3
Txnl5 11 72.02 S 67.96 to 68.74 11.1
Pafah1b1 11 74.49 L, S 75.29 to 76.41 14.5
Crk 11 75.50 L 76.76 to 76.83 10.5
Ccl9 11 83.39 L, S 88.48 to 89.36 36.9
Bcas3 11 85.17 S 89.57 to 89.92 12.2
Dhx40 11 86.59 S 83.52 to 88.25 36.8
Scpep1 11 88.74 L, S 83.52 to 88.25 39.2
9030617O03Rik 12 101.18 S 100.97 to 102.71 51.5
The Chromosome and Position columns indicate, respectively, the chromosome number and position (in megabases [Mb]) within one of the five
Hfe-modifier intervals of the gene with expression variation. In the Type column, S indicates that expression differed between wild-type strains, D
that expression was modulated by Hfe deficiency in duodenum, and L that expression was modulated by Hfe deficiency in liver. Max LRS indicates the
maximum likelihood ratio statistic in favor of the cis regulator. Position of linkage peak for cis regulator and maximum LRS were retrieved from the
WebQTL interface.
Genome Biology 2007, 8:R221
Genome Biology 2007, Volume 8, Issue 10, Article R221 Coppin et al. R221.10
differences between Hfe
-/-
D2 and B6 mice appear to be
related to their varying capacity to perceive the iron-defi-
ciency signal when Hfe is not functional. This probably
explains the differences in extent of liver iron accumulation
between the two strains.
As a result of Hfe deficiency, both strains accumulate iron,
although the extent of iron overload is more severe in the D2
strain. This leads, in liver, to variations in expression of genes
encoding glutathione synthetases, glutathione S-transferases,
UDP-glucuronosyltransferases, vanin, ferroportin, the ferri-
tin light chain, and heme oxygenase. These variations are
encountered at a significant level more often in the liver of
Hfe
-/-
D2 mice than in that of B6 mice, which is consistent
with the observation that Hfe
-/-
D2 mice are more heavily iron
loaded than Hfe
-/-
B6 mice. Global expression profiling of Hfe
wild-type mice of both strains fed an iron-supplemented diet
for 3 weeks showed that they also had significant induction of
several genes that are involved in the glutathione metabolism
pathway or with UDP-glucuronosyltransferase activity (data
not shown). In addition, these mice fed an iron-supplemented
diet exhibited significant induction of Ftl1, Fpn1, and Hmox1
genes, as shown in Figure 3, which reinforces the hypothesis
that these modifications are the consequence of iron overload
and lipid peroxidation, and contribute to hepatoprotection
[28].
Finally, as shown in Figure 3, only slight downregulation in
levels of Hamp1 and Hamp2 was observed in Hfe
-/-
D2 mice,
and no significant variation was observed in Hfe
-/-
B6 mice.
These observations run counter to the marked induction of
Hamp1 and Hamp2 expression by secondary iron overload,
and virtually complete repression by secondary iron defi-
ciency in wild-type mice of both B6 and D2 genetic back-
grounds. In contrast to previous hypotheses regarding
hepcidin regulation by Hfe, we speculate that hepcidin
expression in Hfe-deficient mice might be subject to the
counter-regulatory and conflicting influences of an inappro-
priate iron deficiency signal (which tends to downregulate
hepcidin transcripts) and iron overload (which tends to
upregulate them). This probably explains why, globally, the
hepcidin transcripts are not largely altered by Hfe disruption,
despite the excess iron accumulated by Hfe-deficient mice.
This could also explain why young, 4-week-old Hfe
-/-
mice
exhibit reduced hepcidin expression, as compared with wild-
type mice of the same genetic background [29], whereas this
downregulation disappears in more severely iron loaded 8-
week-old mice.
Notably, we observed enrichment of functional gene catego-
ries associated with lipid metabolism among genes that were
downregulated in liver of Hfe
-/-
mice. First, we noted an
important downregulation of transcripts encoding key
enzymes in the conversion of cholesterol to bile acids in Hfe
-/-
D2 mice. Dietary iron overload in rats [30] was previously
shown to affect the activity of key intracellular enzymes in
cholesterol metabolism, in particular cholesterol 7α-hydrox-
ylase (Cyp7a1), and was attributed to a marked membrane
lipid peroxidation. The strain specificity of the downregula-
tion of these transcripts may therefore be related to the vari-
able iron accumulation observed in mice of the two genetic
backgrounds. Cyp7a1 controls the main pathway whereby
cholesterol is removed from the body in mammals. Thus, a
decrease in cholesterol catabolism could lead to accumulation
of plasma cholesterol and explain our previous observation
that Hfe
-/-
mice of the D2 genetic background have slightly
higher plasma cholesterol levels than D2 wild-type mice
(Table 7). Second, we observed striking and coordinated
downregulation of multiple genes that regulate mitochondrial
fatty acid β-oxidation in the Hfe
-/-
mice of both strains, as well
as variations in gene expression levels, suggesting that the
flux through the TCA cycle is maintained at a low level to
adapt to the downregulated β-oxidation in these Hfe
-/-
mice.
This suggests altered mitochondrial functioning induced by
lack of Hfe, which warrants further investigation. Interest-
ingly, the observed variations in the expression of genes
encoding proteins involved in the mitochondrial iron or heme
traffic, such as Sfxn2, Slc25a37, and Abcg2, are also
compatible with the hypothesis that mitochondrial iron
homeostasis is affected in Hfe
-/-
mice.
The reasons why Hfe-deficient mice incorrectly perceive the
body's iron needs are still unknown, and one of our goals in
this study was to identify gene expression changes that could
help to elucidate why lack of functional Hfe leads to an inap-
propriate iron deficiency signal. Interestingly, we observed
that the expression levels of several genes that participate in
mitochondrial iron traffic and heme biosynthesis were
altered in Hfe-deficient mice; in particular, the mRNA level of
hepatic sideroflexin Sfxn2 was downregulated in both strains.
Because of sequence and structural similarity to sideroflexin
1, sideroflexin 2 was suggested to be in the mitochondrion
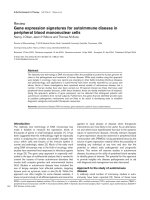
mRNA expression changes: Hfe disruption versus secondary iron deficiency or iron overloadFigure 3 (see following page)
mRNA expression changes: Hfe disruption versus secondary iron deficiency or iron overload. shown is a comparison of mRNA expression changes
induced by Hfe disruption with changes induced by secondary iron deficiency or iron overload within the B6 and D2 strains. Quantification of duodenal
(Cybrd1, Slc39a4, and Muc3) or liver (Ftl1, Fpn1, Hmox1, Hamp1, and Hamp2) mRNAs was performed by quantitative real-time PCR on 7-week-old mice
fed a diet containing 280 mg Fe/kg (wild-type [WT] controls and Hfe
-/-
mice), an iron-deficient, or an iron-supplemented diet [40] for 3 weeks before they
were killed. Expression values for each mouse were calculated as described in Materials and methods, and divided by the mean expression in control WT
mice of the same genetic background. Error bars denote standard deviations. *P < 0.05, **P < 0.01, and ***P < 0.001.
Genome Biology 2007, Volume 8, Issue 10, Article R221 Coppin et al. R221.11
Genome Biology 2007, 8:R221
Figure 3 (see legend on previous page)
0
0,5
1
1,5
2
2,5
3
3,5
4
4,5
0
20
40
60
80
100
120
140
0
0,5
1
1,5
2
2,5
3
3,5
0
2
4
6
8
10
12
14
16
18
B6B6 D2D2
B6 2D6B2D6B2D
B6 D2 B6 D2 B6 D2
Cybrd1 Muc3Slc39a4
Ftl1
Hmox1
Fpn1
2pmaH1pmaH
*
**
***
***
***
***
***
*
***
***
***
***
*
***
***
***
**
**
**
*
***
*
***
**
***
**
***
***
*** ***
***
WT mice, standard diet
Hfe
-/-
mice, standard diet
WT mice, secondary iron deficiency
WT mice, secondary iron overload
Genome Biology 2007, 8:R221
Genome Biology 2007, Volume 8, Issue 10, Article R221 Coppin et al. R221.12
[31], and in a proteomic study [32] it was proved to be located
in the mitochondrial inner membrane. Whether, like
sideroflexin 1, sideroflexin 2 facilitates transport of pyridox-
ine or another Alas co-factor into the mitochondrion remains
to be demonstrated. However, if this were the case, then Hfe
-/-
mice with lower expression of Sfxn2 than wild-type mice
would have reduced levels of Alas co-factor in the mitochon-
drion and have lower efficacy of heme biosynthesis, thus lead-
ing to the inappropriate iron-deficiency signal and the
consequent upregulation of intestinal iron absorption. This
would also be compatible with the paradoxic upregulation of
δ-aminolevulinic acid synthase(Alas2), mitoferrin (Slc25a37;
a mitochondrial iron importer essential for heme
biosynthesis), and Bcrp (Abcg2; a possible mitochondrial
heme exporter [24,33]) observed in these mice. Although this
possible mechanism is still speculative, it would establish a
link between Hfe and the mitochondrion in regulation of iron
homeostasis. It is also consistent with recent studies suggest-
ing that intermediates in heme metabolism, in particular lev-
els of hepatic 5-amino-levulinate, regulate intestinal iron
absorption [34-36].
Our expression studies also identified a large number of genes
exhibiting differences in basal expression between strains or
with regulation in response to Hfe disruption, and which
reside within one of the five chromosomal regions harboring
Hfe-modifier genes [10]. In order to relate these genomics
findings to severity of hemochromatosis, we used the
information available from WebQTL and found that several
of these genes exhibited highly significant evidence for cis
regulation. For example, expression profiling identified four
genes residing in the critical region on chromosome 7, which
were differentially expressed between B6 and D2 mice, and
whose basal expression was linked to a chromosomal position
coinciding with the gene itself. Among those, Hamp was also
regulated by Hfe disruption in the liver of D2 mice. Previous
studies have implicated Hamp in the severity of hemochro-
matosis [37,38], thus supporting recent suggestions that
expression profiling can accelerate identification of genes
that control complex traits [39]. Although none of the other
cis-regulated genes has yet been implicated in iron metabo-
lism, these genes are attractive candidate modifiers for phe-
notypic expression of hemochromatosis and warrant further
investigation. Additional work is also needed to identify pos-
sible trans regulators in the chromosomal regions that har-
boring Hfe-modifier genes, because those could be candidate
modifiers as well.
Conclusion
In this study we investigated Hfe deficiency induced gene
expression profiles in the liver and the duodenum of B6 and
D2 mice, which are two inbred mouse strains with divergent
iron loading severity in response to Hfe disruption. We iden-
tified organ-specific patterns of gene expression that contrib-
ute novel insight into the mechanisms of Hfe action in liver
and duodenum. We also identified multiple genes with differ-
ential expression between wild-type or between Hfe-deficient
strains, which had expression-regulating loci overlapping
with disease modifier loci. Superimposing expression data
and genetic data has thus yielded a testable set of hypotheses
regarding genes related to iron loading severity and signaling
events evoked by Hfe deficiency, with potential functional rel-
evance to human hemochromatosis.
Materials and methods
Mice and tissue collection
Male Hfe
-/-
(knockout) mice of the C57BL/6 (B6) and DBA/2
(D2) backgrounds were produced in the Institut Fédératif de
Recherche (IFR) 30 animal facility [9]. Wild-type Hfe
+/+
con-
trols (wild-type) of the same sex and genetic backgrounds
were purchased from the Centre d'Elevage Robert Janvier (Le
Genest St-Isle, France). The studied population consisted of
16 wild-type mice (eight B6 and eight D2) and 16 knockout
mice (eight B6 and eight D2). Three mice in each of the four
genotype/strain groups were used for genome-wide expres-
sion profiling, and five for validation of microarray results.
Wild-type and knockout mice were housed in the IFR30 ani-
mal facility and had free access to water and R03 diet (UAR,
Epinay-sur-Orge, France) containing 280 mg Fe/kg. All mice
were analyzed at 7 weeks of age and fasted for 14 hours before
they were killed. Experimental protocols were approved by
the Midi-Pyrénées Animal Ethics Committee. Liver and duo-
denum were dissected for RNA isolation, rapidly frozen, and
stored in liquid nitrogen. Nonheme iron was quantified as
Table 7
Effect of Hfe disruption on plasma lipid profiles
C57BL/6 strain DBA/2 strain
Hfe
-/-
Hfe
+/+
PHfe
-/-
Hfe
+/+
P
Total cholesterol (mg/ml) 0.93 ± 0.24 1.07 ± 0.05 0.28 1.46 ± 0.25 1.17 ± 0.13 0.04
HDL-cholesterol (mg/ml) 0.71 ± 0.18 0.86 ± 0.05 0.16 1.14 ± 0.11 0.97 ± 0.08 0.02
Hfe
-/-
and Hfe
+/+
mice (five males per group) were killed at age 7 weeks. Blood was removed and plasma lipid levels were determined by
chromatography. Results are expressed as mean ± standard deviation in each group. P values for comparisons of plasma lipid levels between Hfe
-/-
and
Hfe
+/+
mice of each strain were obtained by Student's t-test. HDL, high-density lipoprotein.
Genome Biology 2007, Volume 8, Issue 10, Article R221 Coppin et al. R221.13
Genome Biology 2007, 8:R221
described previously [10]. Mean ± standard deviation iron
concentrations were 304 ± 50, 456 ± 68, 946 ± 110, and 2,937
± 282 μg/g dry weight in liver of B6 wild-type, D2 wild-type,
B6 knockout, and D2 knockout mice, respectively. Mice fed
an iron-deficient or an iron-supplemented diet were obtained
as described previously [40]. Liver and duodenum samples
were used to compare gene expression variations resulting
from lack of functional Hfe with those induced by secondary
iron deficiency or iron overload.
RNA isolation, preparation of labeled cRNA, and
microarray hybridization
Total RNA was extracted and purified using the RNeasy Lipid
Tissue kit (Qiagen, Courtaboeuf, France). RNA quality was
checked on RNA 6000 Nano chips using a Bioanalyzer 2100
(Agilent Technologies, Palo Alto, CA, USA). RNA samples
used for chip experiments all had RNA Integrity Numbers
[41] ranging from 9 to 10. Double-stranded cDNA and biotin-
labeled cRNA were synthesized using the Affymetrix cDNA
synthesis and IVT Labeling kits. Fragmented cRNAs (15 μg)
were hybridized to 24 GeneChip
®
Mouse Genome 430 2.0
arrays (Affymetrix, Santa Clara, CA, USA), in accordance with
the standard protocol of the manufacturer. The arrays were
scanned with a GeneChip
®
Scanner 3000 (Affymetrix) and
raw image files were converted to probe set data (*.CEL files),
using the Affymetrix GeneChip
®
Operating Software. Expres-
sion microarray data have been submitted to the National
Center for Biotechnology Information's Gene Expression
Omnibus repository (accession number Genbank: GSE7357
).
Microarray data analysis
All the analyses were performed using Bioconductor, an open
source software for the analysis of genomic data rooted in the
statistical computing environment R [42]. Arrays were nor-
malized to have the same target mean intensity of 100. Qual-
ity control metrics were first obtained using the simpleaffy
Bioconductor package [43]. Average background and the
number of genes called present (42% to 48% in liver and 50%
to 55% in duodenum) were similar across all chips. All arrays
had a scale factor lower than 1.4-fold away from the average
scale factor for all samples, a GAPDH (glyceraldehyde 3-
phosphate dehydrogenase) 3':5' ratio at around 1 and a β-
actin 3':5' ratio of under 2.2. Furthermore, plots of mean
intensity per probe position averaged over all probe sets had
very similar slopes for the different arrays, permitting valid
comparisons within genes across arrays. Genes that were not
reliably detected in at least three liver samples or three duo-
denum samples, in accordance with the Affymetrix detection
call algorithm, were excluded from further analysis [44]. Of
the 45,101 probe sets represented on the GeneChip
®
Mouse
Genome 430 2.0 arrays, 28,031 were retained for assessing
changes in gene expression between groups of mice.
The S-score algorithm, available in the Bioconductor Sscore
package [45], was applied to compare hybridization signals
between two arrays. It uses the statistical power of all oligo-
nucleotide pairs for a given gene and is thus particularly use-
ful for studies having limited numbers of Affymetrix
microarrays [46]. S-scores have a normal distribution with
mean of 0 and standard deviation of 1, and are correlated with
the fold change. Three types of comparisons were made: S-
scores were calculated for D2 wild-type versus B6 wild-type
samples within each organ to examine basal strain expression
differences between D2 and B6 mice; S-scores were calcu-
lated for knockout versus wild-type samples within each
organ and mouse strain to study responses to Hfe disruption;
and control S-scores were calculated between biologic repli-
cates within the different groups. To reduce the contribution
of biologic and technical noise, S-scores were divided by the
greater of 1 or the standard deviation of control S-scores
within each organ. This general approach has been applied
previously to microarrays [47] and reduces variance across
experimental replicates [48]. Statistical analysis of microar-
rays (SAM) [49], a rank-based permutation method, was car-
ried out to identify genes with S-scores significantly different
from 0, using the R samr package. Genes regulated by Hfe
deficiency were identified for each strain/organ combination
by performing one-class SAM on knockout versus wild-type
scores, using a false discovery rate of ≤10% to avoid eliminat-
ing genes that may be biologically important and increase our
ability to populate functional networks of genes in subse-
quent bioinformatics studies. Hfe-regulated transcripts iden-
tified by SAM were filtered to count transcripts with an
average S-score over three observations of ≥2 or ≤-2. Genes
that exhibited both significant and reproducible changes were
further analyzed for correlated gene expression patterns by
application of k-means clustering, as described by Eisen and
coworkers [50]. Genes differentially expressed between mice
strains were identified by one-class SAM on wild-type D2 ver-
sus wild-type B6 S-scores, using a false discovery rate of ≤1%.
This gene list was further filtered for an average S-score of
≥2.6 or ≤-2.6 over three observations.
Bioinformatics analysis of gene expression patterns
DAVID (2007), a functional annotation tool [51,52], was used
to identify enriched biologic themes and to discover function-
related enriched gene groups among clusters, compared with
all genes present on the Mouse Genome 430 2.0 array. The
following annotation groupings were analyzed for overrepre-
sentation in gene lists: the Protein Information Resource key-
words, Kyoto Encyclopedia of Genes and Genomes and
BioCarta pathways, and Gene Ontology biological processes
and molecular functions. Results were filtered to remove cat-
egories with EASE (expression analysis systematic explorer)
scores, based on a Fisher exact test, greater than 0.05. Redun-
dant categories with the same gene members were removed
to yield a single representative category. The chromosomal
location of all genes exhibiting differential basal expression
between strains or regulation by Hfe deficiency was superim-
posed on support intervals for hepatic iron loading modifiers
on mouse chromosomes 3, 7, 8, 11, and 12 [10], and a list of
differentially expressed genes mapping to these intervals was
Genome Biology 2007, 8:R221
Genome Biology 2007, Volume 8, Issue 10, Article R221 Coppin et al. R221.14
obtained. The WebQTL resource [53,54], which includes
measures of mRNA expression in livers of 35 adult BXD
recombinant inbred male mice obtained with Agilent G4121A
microarrays, was used to link expression of the genes in this
list to genetic markers and identify potential cis-regulators.
Validation of microarray results by real-time PCR
All primers were designed using the Primer Express 2.0 soft-
ware (Applied Biosystems, Foster City, CA, USA). Quantita-
tive real-time PCR reactions were prepared with M-MLV
reverse transcriptase (Promega, Charbonnières-les-Bains,
France) and qPCR MasterMix Plus for SYBR
®
Green (Euro-
gentec, Seraing, Belgium), as described previously [9], and
run in duplicate. GenBank accession numbers, forward (F)
and reverse (R) primers, and measured PCR efficiencies for
the genes to be validated are given in Table 8. For each mouse,
an expression measure was calculated as E
GoI
Ct GoI
/E
HPRT
Ct
HPRT
, where GoI is the gene of interest; HPRT is a transcript
with stable level between strains and genotypes, quantified to
control for variation in cDNA amounts; E is the PCR reaction
efficiency associated with either the gene of interest (E
GoI
) or
the reference gene (E
HPRT
); and Ct is the cycle number at
which fluorescence reaches a given threshold. Data were ana-
lyzed by one-factor (iron-deficient, standard, or iron-supple-
mented diet) or two-factor (chip/validation experiment and
wild-type/knockout genotype) analysis of variance followed
by Scheffe post-hoc tests using SAS software (version 9.1.3;
SAS Institute Inc., Cary, NC, USA).
Abbreviations
DAVID, Database for Annotation, Visualization, and Inte-
grated Discovery; HFE, hereditary hemochromatosis protein;
HH, hereditary hemochromatosis; RT-PCR, reverse tran-
scription polymerase chain reaction; SAM, statistical analysis
of microarrays; TCA, tricarboxylic acid.
Table 8
Sequences of the primers used for validation of microarray results by real-time PCR
Gene GeneBank
accession
Forward primer Reverse primer Amplification
efficiency
Hprt NM_013556 5'-CTG GTT AAG CAG TAC AGC CCC AA-3' 5'-CAG GAG GTC CTT TTC ACC AGC-3' 1.99
Aox1 NM_009676
5'-CAC CCT GTA TTC ATC TAA GGG CCT-3' 5'-CAC TGC ATC ATG GAT GGC AA-3' 1.92
Ftl1 NM_01024
5'-GGA GAA GAA CCT GAA TCA GGC C-3' 5'-GGT TGC CCA TCT TCT TGA TGA G-3' 2.00
Fpn1 NM_016917
5'-CAT TGC TGC TAG AAT CGG TCT T-3' 5'-GCA ACT GTG TCA CCG TCA AAT-3' 1.97
Hmox1 NM_010442
5'-CAG ATG GCG TCA CTT CGT CA-3' 5'-CTC TGC AGG GGC AGT ATC TTG-3' 2.00
Vanin1 NM_011704
5'-GGC TGC ACA CCG TGG AAG-3' 5'-GGT AAA AGC CGT GTC CAC TGA A-3' 1.90
Por NM_008898
5'-GCC TCG TCG TCT AAG GTC CA-3' 5'-GAC TTC GCT TCA TAC TCC ACA GC-3' 1.99
Cpt1a NM_013495
5'-GAC CCC ACA ACA ACG GCA G-3' 5'-ATG GCG AGG CGG TAC AGG T-3' 2.00
Aco2 NM_080633
5'-GAC CAT TCA AGG CCT GAA GG-3' 5'-ACG CAC TTC AGA GGC TTT CC-3' 2.00
Cyp7a1 NM_007824
5'-GCT CTG GAG GGA ATG CCA T-3' 5'-CCG CAG AGC CTC CTT GAT G-3' 2.00
Hsd3b5 NM_008295
5'-AGA GGA ATT GTC CAA GCT GCA-3' 5'-TGT GGA TGA CAG CAG ACA TGC-3' 1.99
Hfe2 NM_027126
5'-ACC ACC ATC CGG AAG ATC ACT-3' 5'-AAG GCT GCA GGA AGA TTG TCC-3' 2.00
Hamp1 AF_503444
5'-AAG CAG GGC AGA CAT TGC GAT-3' 5'-CAG GAT GTG GCT CTA GGC TAT GT-3' 1.98
Hamp2 AY_232841
5'-AAG CAG GGC AGA CAT TGC GAT-3' 5'-GGA TGT GGC TCT AGG CTC TCT ATT-3' 2.00
Usf2 NM_011680
5'-ATG GAA CCA GAA CTC CTC GAG A-3' 5'-CCG TTC CAC TTC ATT GTG CTG-3' 1.93
Lcn2 NM_008491
5'-TCT GTC CCC ACC GAC CAA T-3' 5'-CCA GTC AGC CAC ACT CAC CAC-3' 1.99
Sfxn2 NM_053196
5'-CGC ACA AGT GGT TAT CTC TCG G-3' 5'-CCA TGA TGA CAG GCA ACA GGA-3' 1.99
Alas2 NM_009653
5'-TGG AAC TCT TGG CAA GGC C-3' 5'-CAA GTC CCG AGT GCT GGC T-3' 1.99
Slc25a37 NM_026331
5'-GAG CAC TCC ATC ATG TAC CCG-3' 5'-TGG ATT CAA ACT CTG CAT CCG-3' 2.00
Abcg2 NM_011920
5'-TTG GCT GTC CTG GCT TCA GTA C-3' 5'-CAA AGC TGT GAA GCC ATA TCG A-3' 1.99
Cybrd1 AF_354666
5'-GCA GCG GGC TCG AGT TTA-3' 5'-TTC CAG GTC CAT GGC AGT CT-3' 1.98
Slc39a4 NM_028064
5'-GCG ACT GAG AGC AGA GCT GA-3' 5'-GTT GTG TAC CGC GTC GCC-3' 2.00
Mucin3 NM_355711
5'-TCG TGT TCT CCA TCC GCT TC-3' 5'-GAC ACT CTG GAC CGT TGC CT-3' 1.99
Lcn13 NM_153558
5'-TGT TTG TGC CAG AGA TCG GAG-3' 5'-GCT GGC TCA GCT GTT GCA G-3' 1.95
Fmo3 NM_008030
5'-GGA ACT TGC ACT TTG CCT TCT G-3' 5'-GGT GGT GCT ATT GCC ATA CCA-3' 1.96
Clca4 NM_139148
5'-GCC GTC ATA GAA GCT GAG AGT GG-3' 5'-AGC ACC TGC CCC GTT GTC-3' 2.00
Hfe
-/-
and Hfe
+/+
mice (five males per group) were killed at age 7 weeks. Blood was removed and plasma lipid levels were determined by
chromatography. Results are expressed as mean ± standard deviation in each group. P values for comparisons of plasma lipid levels between Hfe
-/-
and Hfe
+/+
mice of each strain were obtained by Student's t-test. HDL, high-density lipoprotein.
Genome Biology 2007, Volume 8, Issue 10, Article R221 Coppin et al. R221.15
Genome Biology 2007, 8:R221
Authors' contributions
HC and MPR designed the experiments, participated in their
execution, analyzed the data, and wrote the manuscript. VD,
LK, and DM assisted with the execution of the experiments.
MA and JM provided conceptual expertise for functional
annotation, and MM for statistical analysis. All authors read
and approved the final version of the manuscript.
Additional data files
The following additional data are available with the online
version of this paper. Additional data file 1 lists genes signifi-
cantly regulated by Hfe disruption in the liver of D2 or B6
mice, according to microarray analysis. Additional data file 2
lists genes significantly regulated by Hfe disruption in duode-
num of D2 or B6 mice. Additional data file 3 lists genes differ-
entially expressed in the liver or the duodenum of wild-type
D2 and B6 mice.
Additional File 1Genes significantly regulated by Hfe disruption in the liver of D2 or B6 micePresented is a table listing genes significantly regulated by Hfe dis-ruption in the liver of D2 or B6 mice according to microarray analysis.Click here for fileAdditional File 2Genes significantly regulated by Hfe disruption in the duodenum of D2 or B6 micePresented is a table listing genes significantly regulated by Hfe dis-ruption in the duodenum of D2 or B6 mice.Click here for fileAdditional File 3Genes differentially expressed in liver or duodenum of wild-type D2 and B6 micePresented is a table listing genes differentially expressed in the liver and/or the duodenum of wild-type D2 and B6 mice.Click here for file
Acknowledgements
The authors thank Corinne Senty and Maryline Calise (Service de Zootech-
nie, IFR30) for assistance with mouse breeding, Véronique Le Berre
(Génopole Toulouse Midi-Pyrénées, plateforme Transcriptome-Biopuces)
and Julien Sarry (Génopole Toulouse Midi-Pyrénées, plateforme
Génomique) for skilled advice, François Tercé (Génopole Toulouse Midi-
Pyrénées, plateau Lipidomique, plateforme Exploration Fonctionnelle) for
lipid dosages, and Benoit Albaud (Institut Curie, plateforme Génomique
Fonctionnelle) for realizing the microarray experiments.
This work was supported by grants from the Association pour la Recherche
sur le Cancer (ARC), the Réseau National des Génopoles (RNG), the
Agence Nationale pour la Recherche (ANR, programme IRONGENES),
and the European Commission (LSHM-CT-2006-037296: EUROIRON1).
References
1. Bothwell TH, MacPhail AP: Hereditary hemochromatosis: etio-
logic, pathologic, and clinical aspects. Semin Hematol 1998,
35:55-71.
2. Feder JN, Gnirke A, Thomas W, Tsuchihashi Z, Ruddy DA, Basava A,
Dormishian F, Domingo R Jr, Ellis MC, Fullan A, et al.: A novel MHC
class I-like gene is mutated in patients with hereditary
haemochromatosis. Nat Genet 1996, 13:399-408.
3. Carlson H, Zhang AS, Fleming WH, Enns CA: The hereditary
hemochromatosis protein, HFE, lowers intracellular iron
levels independently of transferrin receptor 1 in TRVb cells.
Blood 2005, 105:2564-2570.
4. Drakesmith H, Sweetland E, Schimanski L, Edwards J, Cowley D,
Ashraf M, Bastin J, Townsend AR: The hemochromatosis protein
HFE inhibits iron export from macrophages. Proc Natl Acad Sci
USA 2002, 99:15602-15607.
5. Beutler E, Felitti VJ, Koziol JA, Ho NJ, Gelbart T: Penetrance of
845G > A (C282Y) HFE hereditary haemochromatosis
mutation in the USA. Lancet 2002, 359:211-218.
6. Bulaj ZJ, Ajioka RS, Phillips JD, LaSalle BA, Jorde LB, Griffen LM,
Edwards CQ, Kushner JP: Disease-related conditions in rela-
tives of patients with hemochromatosis. N Engl J Med 2000,
343:1529-1535.
7. Bahram S, Gilfillan S, Kuhn LC, Moret R, Schulze JB, Lebeau A, Schu-
mann K: Experimental hemochromatosis due to MHC class I
HFE deficiency: immune status and iron metabolism. Proc
Natl Acad Sci USA 1999, 96:13312-13317.
8. Zhou XY, Tomatsu S, Fleming RE, Parkkila S, Waheed A, Jiang J, Fei
Y, Brunt EM, Ruddy DA, Prass CE, et al.: HFE gene knockout pro-
duces mouse model of hereditary hemochromatosis. Proc
Natl Acad Sci USA 1998, 95:2492-2497.
9. Dupic F, Fruchon S, Bensaid M, Borot N, Radosavljevic O, Loreal O,
Brissot P, Gilfillan S, Bahram S, Coppin H, et al.: Inactivation of the
hemochromatosis gene differentially regulates duodenal
expression of iron-related mRNAs between mouse strains.
Gastroenterology 2002, 122:745-751.
10. Bensaid M, Fruchon S, Mazeres C, Bahram S, Roth MP, Coppin H:
Multigenic control of hepatic iron loading in a murine model
of hemochromatosis.
Gastroenterology 2004, 126:1400-1408.
11. Muckenthaler M, Roy CN, Custodio AO, Minana B, DeGraaf J, Mon-
tross LK, Andrews NC, Hentze MW: Regulatory defects in liver
and intestine implicate abnormal hepcidin and Cybrd1
expression in mouse hemochromatosis. Nat Genet 2003,
34:102-107.
12. Cashman JR, Zhang J: Human flavin-containing
monooxygenases. Annu Rev Pharmacol Toxicol 2006, 46:65-100.
13. Berruyer C, Martin FM, Castellano R, Macone A, Malergue F, Garrido-
Urbani S, Millet V, Imbert J, Dupre S, Pitari G, et al.: Vanin-1-/- mice
exhibit a glutathione-mediated tissue resistance to oxidative
stress. Mol Cell Biol 2004, 24:7214-7224.
14. Kaasik K, Lee CC: Reciprocal regulation of haem biosynthesis
and the circadian clock in mammals. Nature 2004, 430:467-471.
15. Abbaszade IG, Clarke TR, Park CH, Payne AH: The mouse 3 beta-
hydroxysteroid dehydrogenase multigene family includes
two functionally distinct groups of proteins. Mol Endocrinol
1995, 9:1214-1222.
16. Guyonneau L, Murisier F, Rossier A, Moulin A, Beermann F: Melano-
cytes and pigmentation are affected in dopachrome tau-
tomerase knockout mice. Mol Cell Biol 2004, 24:3396-3403.
17. Collins JF, Franck CA, Kowdley KV, Ghishan FK: Identification of
differentially expressed genes in response to dietary iron
deprivation in rat duodenum. Am J Physiol Gastrointest Liver Physiol
2005, 288:G964-G971.
18. Gaboriau F, Kreder A, Clavreul N, Moulinoux JP, Delcros JG, Lescoat
G: Polyamine modulation of iron uptake in CHO cells. Bio-
chem Pharmacol 2004, 67:1629-1637.
19. Simovich M, Hainsworth LN, Fields PA, Umbreit JN, Conrad ME:
Localization of the iron transport proteins Mobilferrin and
DMT-1 in the duodenum: the surprising role of mucin. Am J
Hematol 2003, 74:32-45.
20. Cairo G, Bernuzzi F, Recalcati S:
A precious metal: iron, and
essential nutrient for all cells. Genes Nutr 2006, 1:25-40.
21. Bridle KR, Frazer DM, Wilkins SJ, Dixon JL, Purdie DM, Crawford
DH, Subramaniam VN, Powell LW, Anderson GJ, Ram GA: Dis-
rupted hepcidin regulation in HFE-associated haemochro-
matosis and the liver as a regulator of body iron
homoeostasis. Lancet 2003, 361:669-673.
22. Courselaud B, Troadec MB, Fruchon S, Ilyin G, Borot N, Leroyer P,
Coppin H, Brissot P, Roth MP, Loreal O: Strain and gender mod-
ulate hepatic hepcidin 1 and 2 mRNA expression in mice.
Blood Cells Mol Dis 2004, 32:283-289.
23. Bayele HK, McArdle H, Srai SK: Cis and trans regulation of hep-
cidin expression by upstream stimulatory factor. Blood 2006,
108:4237-4245.
24. Dunn LL, Rahmanto YS, Richardson DR: Iron uptake and metab-
olism in the new millennium. Trends Cell Biol 2007, 17:93-100.
25. Simpson RJ, Debnam E, Beaumont N, Bahram S, Schumann K, Srai SK:
Duodenal mucosal reductase in wild-type and Hfe knockout
mice on iron adequate, iron deficient, and iron rich feeding.
Gut 2003, 52:510-513.
26. Gunshin H, Tohyama C, Vainshtein Y, Hentze MW, Muckenthaler
MU, Andrews NC: Metal distribution and gene expression pro-
file in DMT1 knockout mice. Am J Hematol 2007, 82:508.
27. Liuzzi JP, Aydemir F, Nam H, Knutson MD, Cousins RJ: Zip14
(Slc39a14) mediates non-transferrin-bound iron uptake into
cells. Proc Natl Acad Sci USA 2006, 103:13612-13617.
28. Farombi EO, Surh YJ: Heme oxygenase-1 as a potential thera-
peutic target for hepatoprotection. J Biochem Mol Biol 2006,
39:479-491.
29. Ahmad KA, Ahmann JR, Migas MC, Waheed A, Britton RS, Bacon BR,
Sly WS, Fleming RE: Decreased liver hepcidin expression in the
hfe knockout mouse. Blood Cells Mol Dis 2002, 29:361-366.
30. Brunet S, Thibault L, Delvin E, Yotov W, Bendayan M, Levy E: Die-
tary iron overload and induced lipid peroxidation are associ-
ated with impaired plasma lipid transport and hepatic sterol
metabolism in rats.
Hepatology 1999, 29:1809-1817.
31. Fleming MD, Campagna DR, Haslett JN, Trenor CC III, Andrews NC:
A mutation in a mitochondrial transmembrane protein is
responsible for the pleiotropic hematological and skeletal
phenotype of flexed-tail (f/f) mice. Genes Dev 2001, 15:652-657.
Genome Biology 2007, 8:R221
Genome Biology 2007, Volume 8, Issue 10, Article R221 Coppin et al. R221.16
32. Da Cruz S, Xenarios I, Langridge J, Vilbois F, Parone PA, Martinou JC:
Proteomic analysis of the mouse liver mitochondrial inner
membrane. J Biol Chem 2003, 278:41566-41571.
33. Jonker JW, Buitelaar M, Wagenaar E, Van Der Valk MA, Scheffer GL,
Scheper RJ, Plosch T, Kuipers F, Elferink RP, Rosing H, et al.: The
breast cancer resistance protein protects against a major
chlorophyll-derived dietary phototoxin and protoporphyria.
Proc Natl Acad Sci USA 2002, 99:15649-15654.
34. Laftah AH, Raja K, Simpson RJ, Peters TJ: Effect of Tin-mesopor-
phyrin, an inhibitor of haem catabolism, on intestinal iron
absorption. Br J Haematol 2003, 122:298-304.
35. Laftah AH, Raja KB, Beaumont N, Simpson RJ, Deacon A, Solanky N,
Srai SK, Peters TJ: The effects of inhibition of haem biosynthe-
sis by griseofulvin on intestinal iron absorption. Basic Clin Phar-
macol Toxicol 2004, 94:161-168.
36. Laftah AH, Raja KB, Latunde-Dada GO, Vergi T, McKie AT, Simpson
RJ, Peters TJ: Effect of altered iron metabolism on markers of
haem biosynthesis and intestinal iron absorption in mice.
Ann Hematol 2005, 84:177-182.
37. Jacolot S, Le Gac G, Scotet V, Quere I, Mura C, Ferec C: HAMP as
a modifier gene that increases the phenotypic expression of
the HFE pC282Y homozygous genotype. Blood 2004,
103:2835-2840.
38. Merryweather-Clarke AT, Cadet E, Bomford A, Capron D, Viprakasit
V, Miller A, McHugh PJ, Chapman RW, Pointon JJ, Wimhurst VL, et al.:
Digenic inheritance of mutations in HAMP and HFE results
in different types of haemochromatosis. Hum Mol Genet 2003,
12:2241-2247.
39. Hitzemann R, Malmanger B, Reed C, Lawler M, Hitzemann B, Cou-
lombe S, Buck K, Rademacher B, Walter N, Polyakov Y, et al.: A
strategy for the integration of QTL, gene expression, and
sequence analyses. Mamm Genome 2003, 14:733-747.
40. Dupic F, Fruchon S, Bensaid M, Loreal O, Brissot P, Borot N, Roth
MP, Coppin H: Duodenal mRNA expression of iron related
genes in response to iron loading and iron deficiency in four
strains of mice. Gut 2002, 51:648-653.
41. Schroeder A, Mueller O, Stocker S, Salowsky R, Leiber M, Gassmann
M, Lightfoot S, Menzel W, Granzow M, Ragg T: The RIN: an RNA
integrity number for assigning integrity values to RNA
measurements. BMC Mol Biol 2006, 7:3.
42. Gentleman RC, Carey VJ, Bates DM, Bolstad B, Dettling M, Dudoit S,
Ellis B, Gautier L, Ge Y, Gentry J, et al.: Bioconductor: open soft-
ware development for computational biology and
bioinformatics. Genome Biol 2004, 5:R80.
43. Wilson CL, Miller CJ: Simpleaffy: a BioConductor package for
Affymetrix quality control and data analysis. Bioinformatics
2005, 21:3683-3685.
44. McClintick JN, Edenberg HJ: Effects of filtering by Present call on
analysis of microarray experiments. BMC Bioinformatics 2006,
7:49.
45. Kennedy RE, Kerns RT, Kong X, Archer KJ, Miles MF: SScore: an R
package for detecting differential gene expression without
gene expression summaries. Bioinformatics 2006, 22:1272-1274.
46. Zhang L, Wang L, Ravindranathan A, Miles MF: A new algorithm
for analysis of oligonucleotide arrays: application to expres-
sion profiling in mouse brain regions. J Mol Biol 2002,
317:225-235.
47. Hughes TR, Marton MJ, Jones AR, Roberts CJ, Stoughton R, Armour
CD, Bennett HA, Coffey E, Dai H, He YD, et al.: Functional discov-
ery via a compendium of expression profiles. Cell 2000,
102:109-126.
48. Kerns RT, Ravindranathan A, Hassan S, Cage MP, York T, Sikela JM,
Williams RW, Miles MF: Ethanol-responsive brain region
expression networks: implications for behavioral responses
to acute ethanol in DBA/2J versus C57BL/6J mice. J Neurosci
2005, 25:2255-2266.
49. Tusher VG, Tibshirani R, Chu G: Significance analysis of micro-
arrays applied to the ionizing radiation response. Proc Natl
Acad Sci USA 2001, 98:5116-5121.
50. Eisen MB, Spellman PT, Brown PO, Botstein D: Cluster analysis
and display of genome-wide expression patterns. Proc Natl
Acad Sci USA 1998, 95:14863-14868.
51. Dennis G Jr, Sherman BT, Hosack DA, Yang J, Gao W, Lane HC, Lem-
picki RA: DAVID: Database for Annotation, Visualization, and
Integrated Discovery. Genome Biol 2003, 4:P3.
52. The DAVID Bioinformatics Resources 2007
[ />53. Chesler EJ, Lu L, Wang J, Williams RW, Manly KF: WebQTL: rapid
exploratory analysis of gene expression and genetic net-
works for brain and behavior. Nat Neurosci 2004, 7:485-486.
54. The WebQTL resource [ />