Báo cáo y học: " Transcriptional profiling reveals barcode-like toxicogenomic responses in the zebrafish embryo" pptx
Bạn đang xem bản rút gọn của tài liệu. Xem và tải ngay bản đầy đủ của tài liệu tại đây (1.06 MB, 17 trang )
Genome Biology 2007, 8:R227
Open Access
2007Yanget al.Volume 8, Issue 10, Article R227
Research
Transcriptional profiling reveals barcode-like toxicogenomic
responses in the zebrafish embryo
Lixin Yang
*
, Jules R Kemadjou
*
, Christian Zinsmeister
*
, Matthias Bauer
*
,
Jessica Legradi
*
, Ferenc Müller
*
, Michael Pankratz
*
, Jens Jäkel
†‡
and
Uwe Strähle
*
Addresses:
*
Institute of Toxicology and Genetics, Forschungszentrum Karlsruhe, Postfach 3640, 76021 Karlsruhe, Germany.
†
Institute for
Applied Computer Science, Forschungszentrum Karlsruhe, Postfach 3640, 76021 Karlsruhe, Germany.
‡
Institute for Measurement and Control
Engineering, HTWK Leipzig, Postfach 30 11 66, 04251 Leipzig, Germany.
Correspondence: Uwe Strähle. Email:
© 2007 Yang et al; licensee BioMed Central Ltd. This is an open access article distributed under the terms of the Creative Commons Attribution License
( which permits unrestricted use, distribution, and reproduction in any medium, provided the original work is
properly cited
Zebrafish toxicogenomic responses<p>Microarray profiling of zebrafish embryos exposed to a range of environmental toxicants revealed distinct expression profiles for each of the toxicants tested.</p>
Abstract
Background: Early life stages are generally most sensitive to toxic effects. Our knowledge on the
action of manmade chemicals on the developing vertebrate embryo is, however, rather limited. We
addressed the toxicogenomic response of the zebrafish embryo in a systematic manner by asking
whether distinct chemicals would induce specific transcriptional profiles.
Results: We exposed zebrafish embryos to a range of environmental toxicants and measured the
changes in gene-expression profiles by hybridizing cDNA to an oligonucleotide microarray. Several
hundred genes responded significantly to at least one of the 11 toxicants tested. We obtained
specific expression profiles for each of the chemicals and could predict the identity of the toxicant
from the expression profiles with high probability. Changes in gene expression were observed at
toxicant concentrations that did not cause morphological effects. The toxicogenomic profiles were
highly stage specific and we detected tissue-specific gene responses, underscoring the sensitivity of
the assay system.
Conclusion: Our results show that the genome of the zebrafish embryo responds to toxicant
exposure in a highly sensitive and specific manner. Our work provides proof-of-principle for the
use of the zebrafish embryo as a toxicogenomic model and highlights its potential for systematic,
large-scale analysis of the effects of chemicals on the developing vertebrate embryo.
Background
Organisms are open systems that are in constant exchange
with their environment. As a consequence, living systems
have to adapt to environmental conditions by adjusting their
physiology accordingly. Chemicals from natural sources or
manmade pollution can represent rather adverse environ-
mental conditions with a fatal outcome if the organism fails to
adapt. It is a well-established fact that xenobiotics such as
dioxin or cadmium can induce changes in gene expression [1-
3]. The responsive genes include adaptive genes that are
involved in detoxification or protection against oxidative or
other cellular stresses and may also comprise genes that are
Published: 25 October 2007
Genome Biology 2007, 8:R227 (doi:10.1186/gb-2007-8-10-r227)
Received: 23 July 2007
Revised: 17 September 2007
Accepted:
The electronic version of this article is the complete one and can be
found online at />Genome Biology 2007, 8:R227
Genome Biology 2007, Volume 8, Issue 10, Article R227 Yang et al. R227.2
directly responsible for the fatal effects of the toxicants. The
early life stages of vertebrates are generally the most suscep-
tible to adverse chemical impact [4]. Yet we do not have a
detailed picture of the transcriptional response profiles of
these early life stages.
There is a high demand by regulators and industry for reliable
and ethically acceptable methods to evaluate the develop-
mental toxicity of pharmaceuticals, industrial chemicals and
waste products. For example, several tens of thousands of
chemicals need to be assessed within the European Union
REACH (Registration, Evaluation and Authorization of
Chemicals) initiative for the safety testing and risk assess-
ment of chemicals in the next years [5,6]. Cheap and reliable
alternative methods are needed to cope with this enormous
screening effort.
Toxicogenomics is a powerful tool for studies of toxicological
mechanisms and for the detection of toxicity profiles [7] as it
allows the simultaneous assessment of thousands of genes.
To obtain the full potential of toxicogenomics for the evalua-
tion of developmental toxicity, however, animal systems have
to be used. The zebrafish embryo is a vertebrate system with
great merits for this undertaking. The zebrafish was intro-
duced more than two decades ago as a model to study devel-
opment and neurobiology [8]. In parallel, the zebrafish
embryo has evolved into a model for studies of chemical
impact: it permits efficient compound screens [9] and is, for
example, used in a standardized assay for sewage testing in
Germany, replacing traditional toxicological tests with adult
fish [10,11]. Given the experimental advantages such as small
size of the embryo, cheap maintenance, availability of a
genome sequence and many mutants, the zebrafish embryo is
one of the most promising vertebrate systems for studies of
toxicological mechanisms and toxicogenomics [12-14]. Most
assays using zebrafish, however, rely on morphological end-
points, which display little discrimination between different
toxicants.
Expression profiling has just recently entered zebrafish
research [15-20] and only a few toxicogenomic studies exist
[1,21,22]. Dioxin (TCDD) impairs fin regeneration in adult
zebrafish, and expression profiling revealed TCDD-induced
changes in the expression of genes involved in extracellular
matrix formation [1,23]. Exposure of zebrafish to arsenic
leads to changes in gene expression in adult zebrafish liver
very similar to those reported for mammals, suggesting dam-
age to protein and DNA and increased oxidative stress in the
livers of arsenic-treated animals [22]. In another pilot study,
zebrafish embryos were exposed to the reference compound
3,4-dichloroaniline and seven genes were significantly regu-
lated [21].
Despite these advances, however, it is not known whether
there are different responses to different toxicants and at dif-
ferent developmental stages. Would different toxic chemicals
induce different genomic profiles, which might even be diag-
nostic for particular toxicants, or does the genome of the
embryo respond in a general stress response. Would the sen-
sitivity of whole-embryo exposure experiments be high
enough to detect responses of genes that are restricted to
small numbers of cells?
We established the toxicogenomic profiles of 11 toxicants. The
gene-expression patterns induced by the 11 toxicants are
related but sufficiently different to recognize toxicant-specific
profiles and developmental stage-specific gene responses
were also evident. Moreover, we could detect gene-expression
changes at concentrations that do not have phenotypic conse-
quences. We found synergistic effects when a mixture of com-
pounds was applied at low doses, suggesting that the genomic
response provides a more sensitive readout than morpholog-
ical effects.
Results
Model compounds cause similar teratological and toxic
effects in zebrafish embryos
We chose 11 model compounds, namely methylmercury chlo-
ride (MeHg), CdCl
2
(Cd), PbCl2 (Pb), As
2
O
3
(As), Aroclor 1254
(PCB), acrylamide (AA), tert-butylhydroquinone (tBHQ), 4-
chloroaniline (4CA), 1,1-bis-(4-chlorophenyl)2,2,2-trichlo-
roethane (DDT), 2,3,7,8-tetrachlorodibenzo-p-dioxin
(TCDD) and valproic acid (VA). These are compounds known
for their environmental toxicity [24] and VA is a teratogen
and an anti-epileptic drug [25]. VA is known to inhibit histone
deacetylases and Wnt signaling in mammals, thus adding an
additional mode of toxic action [26].
We first established exposure protocols with which one can
trigger toxicogenomic alterations with high likelihood and at
the same time cause only a small amount of cell death or
embryo mortality. We limited the exposure time to 20-24
hours in the expectation of focusing predominantly on pri-
mary responses rather than indirect, secondary effects.
Finally, we decided to carry out these assays in embryos
before they begin to feed, that is, before 120 hours post-ferti-
lization (hpf). We tested a range of toxicant concentrations to
determine the one that caused a morphologically visible
toxic/teratological effect in the treated embryos after expo-
sure at 96-120 hpf (Figure 1, Table 1, Additional data file 1).
We were not able to discriminate unequivocally between tox-
icant-specific morphological effects (see Figure 1). Frequently
the tails were bent, and the animals had difficulty swimming
correctly; in some instances they developed pericardial
edema (see Figure 1a). Vehicle-treated embryos did not show
alterations (see Figure 1l-n) or did so only at very low fre-
quency. Cell death as monitored by acridine orange staining
was not, or only rarely, obvious immediately after treatment
when animals were sacrificed for microarray analysis.
Genome Biology 2007, Volume 8, Issue 10, Article R227 Yang et al. R227.3
Genome Biology 2007, 8:R227
Between 96 and 120 hpf organogenesis has proceeded so far
that the animals feed for the first time [8], marking the end of
the embryonic stage. At this stage, gut, liver, pancreas, nerv-
ous system, musculature and the cardiovascular system are
assumed to reflect adult physiology in many respects, includ-
ing the response to toxicants. Younger embryonic stages are
likely to have different responses to the toxicants. We there-
fore included two more stages in our initial experiments. The
4-24 hpf treatment covers late blastula, gastrula and segmen-
tation stages, during which the overall body plan is laid down
[8]. The treatment phase between 24 and 48 hpf coincides
with the onset of organogenesis [8]. Early embryonic stages
appear more sensitive to toxicant exposure than the older
embryos (compare the 24-48 hpf and 96-120 hpf treatment
groups in Table 1). The concentrations of the toxicants were
adjusted accordingly (see Table 1).
Stage-specific toxicogenomic responses
To assess possible stage-specific differences, we analyzed and
compared the toxicogenomic response to six compounds -
MeHg, Cd, 4CA, DDT, TCDD, and VA - at the three different
stages. We treated several hundred embryos with each of
these compounds at each of the three stages (see Materials
and methods and Additional data files 1). Principal compo-
nent analysis (PCA) revealed distinct toxicogenomic
responses to exposure with the six toxicants in the 24-48 and
96-120 hpf treatment groups (Figure 2a). Principal compo-
nents were derived by singular value decomposition (SVD).
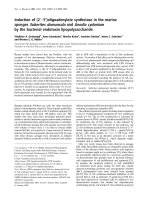
Toxicants induce similar morphological changes in 120 hpf zebrafish embryosFigure 1
Toxicants induce similar morphological changes in 120 hpf zebrafish embryos. Embryos were treated with (a) methylmercury chloride (60 μg/l, MeHg);
(b) CdCl
2
(5 mg/l, Cd); (c) PbCl
2
(2.8 mg/l, Pb); (d) As
2
O
3
(79 mg/l, As); (e) Aroclor 1254 (33 mg/l, PCB); (f) acrylamide (71 mg/l, AA); (g) tert-
butylhydroquinone (1.7 mg/l, tBHQ); (h) 4-chloroaniline (50 mg/l, 4CA); (i) 1,1-bis-(4-chlorophenyl)2,2,2-trichloroethane (15 mg/l, DDT); (j) 2,3,7,8-
tetrachlorodibenzo-p-dioxin (500 ng/l, TCDD); (k) valproic acid (50 mg/l, VA); (l) vehicle 1 control (VC1): embryo water alone (for Cd, MeHg, Pb, As,
VA, AA treatments); (m) vehicle 2 control (VC2): 0.2% ethanol control (for 4CA, DDT, tBHQ, PCB); (n) vehicle 3 control (VC3): 0.025% DMSO, 1.4 mg/
l toluene (for TCDD). Embryos showed frequently a bent body axis and developed pericardial edema upon further cultivation.
(a)
MeHg
(b)
Cd
(c)
Pb
(d)
As
(e)
PCB
(f)
AA
(g)
tBHQ
(h)
4CA
(i)
DDT
(j)
TCDD
(k)
VA
(l)
C
(m)
VC1
(n)
VC2
Genome Biology 2007, 8:R227
Genome Biology 2007, Volume 8, Issue 10, Article R227 Yang et al. R227.4
Table 1
Summary of microarray experiments
Toxicants Stage Concentration Arrays
4CA 24 hpf 15 ppm 15 mg/l 118 μM8 (3)
48 hpf 50 ppm 50 mg/l 390 μM6 (3)
120 hpf 50 ppm 50 mg/l 390 μM8 (3)
120 hpf 25 ppm 25 mg/l 195 μM4 (1)
120 hpf 5 ppm 5 mg/l 39 μM4 (1)
120 hpf 0.5 ppm 0.5 mg/l 3.9 μM4 (1)
DDT 24 hpf 5 ppm 5 mg/l 14 μM6 (3)
48 hpf 15 ppm 15 mg/l 42 μM6 (2)
120 hpf 15 ppm 15 mg/l 42 μM8 (3)
120 hpf 1.5 ppm 1.5 mg/l 4.2 μM4 (1)
120 hpf 0.15 ppm 0.15 mg/l 0.42 μM4 (1)
Cd 24 hpf 0.5 ppm 0.5 mg/l 2.7 μM8 (4)
48 hpf 5 ppm 5 mg/l 27 μM8 (3)
120 hpf 5 ppm 5 mg/l 27 μM8 (3)
120 hpf 2.5 ppm 2.5 mg/l 13.5 μM4 (2)
120 hpf 0.5 ppm 0.5 mg/l 2.7 μM4 (2)
120 hpf 50 ppb 50 μg/l 0.27 μM4 (2)
TCDD 24 hpf 150 ppt 150 ng/l 0.47 nM 8 (3)
48 hpf 500 ppt 500 ng/l 1.6 nM 4 (2)
120 hpf 500 ppt 500 ng/l 1.6 nM 8 (3)
120 hpf 250 ppt 250 ng/l 0.8 nM 4 (1)
120 hpf 50 ppt 50 ng/l 0.16 nM 4 (2)
VA 24 hpf 15 ppm 15 mg/l 12.9 μM8 (3)
48 hpf 50 ppm 50 mg/l 43 μM8 (3)
120 hpf 50 ppm 50 mg/l 43 μM8 (3)
120 hpf 25 ppm 25 mg/l 21.5 μM4 (1)
120 hpf 5 ppm 5 mg/l 4.3 μM4 (1)
120 hpf 0.5 ppm 0.5 mg/l 0.43 μM4 (1)
MeHg 24 hpf 50 ppb 50 μg/l 0.20 μM8 (3)
48 hpf 60 ppb 60 μg/l 0.24 μM6 (2)
120 hpf 60 ppb 60 μg/l 0.24 μM10 (3)
120 hpf 30 ppb 30 μg/l 0.12 μM4 (2)
120 hpf 6 ppb 6 μg/l 0.024 μM4 (2)
As 120 hpf 79 ppm 79 mg/l 400 μM8 (3)
120 hpf 7.9 ppm 7.9 mg/l 40 μM4 (1)
Pb 120 hpf 2.8 ppm 2.8 mg/l 10 μM8 (3)
120 hpf 0.28 ppm 0.28 mg/l 1 μM4 (1)
PCB 120 hpf 33 ppm 33 mg/l 100 μM8 (3)
AA 120 hpf 71 ppm 71 mg/l 1 mM 8 (3)
tBHQ 120 hpf 1.7 ppm 1.7 mg/l 10 μM8 (3)
Mixture 120 hpf Pb 1 μM, Cd 0.27 μM, As 40 μM, Hg 0.024 μM6 (3)
Embryos were either treated from 4 to 24 (24 hpf) or from 24 to 48 hpf (48 hpf) or from 96 to 120 hpf (5 days). Arrays, total number of microarray
hybridizations. Numbers in brackets indicate the number of independent biological repeats. 4CA, 4-chloroaniline; DDT, 1,1-bis-(4-chlorphenyl)-
2,2,2-trichlorethane; Cd, cadmium chloride; TCDD, 2,3,7,8-tetrachlorodibenzo-p-dioxin; VA, valproic acid; MeHg, methylmercury chloride; As,
arsenic (III) oxide; Pb, lead (II) chloride; AA, acrylamide, PCB, Aroclor 1254; tBHQ, tert-butylhydroquinone.
Genome Biology 2007, Volume 8, Issue 10, Article R227 Yang et al. R227.5
Genome Biology 2007, 8:R227
SVD is based on the decomposition of the gene-expression
matrix, whose entries are the log-transformed fold changes
(M values) of gene expression, into unique orthonormal
superpositions of genes and treatments. Expression changes
of at least twofold and a p
adj
< 0.025 were taken into account.
The p
adj
-value was adjusted for multiplicity testing by con-
trolling the false discovery rate [27].
The differences between the transcriptional profiles induced
by the six toxicants were less prominent in the datasets from
the 4-24 hpf treatment groups (see Figure 2a). This may be
due to the fact that different toxicants caused similar gene
effects at 24 hpf. For example, the expression of the gene for
fast muscle troponin T (BE693169) was downregulated by Cd,
MeHg, TCDD, and VA in embryos treated between 4 and 24
hpf but not at later stages (data not shown). Furthermore,
many genes that are involved in organ physiology may not yet
be responsive by 24 hpf, as organ development has not pro-
ceeded far enough. In agreement with this, the expression lev-
els of only 57 genes were significantly altered by the 4-24 hpf
treatment. In contrast, the expression levels of 476 and 311
genes were significantly affected by the 24-48 hpf and 96-120
hpf treatment regimens, respectively (see Figure 2b). Moreo-
ver, very few genes in the 4-24 hpf treatment set overlapped
with the 24-48 and 96-120 hpf treatment groups (15 and 10
genes, respectively). The latter groups (24-48 h and 96-120
hpf) shared more gene responses (74 genes) but 393 and 233
gene responses were stage specific (see Figure 2b). The
smaller number of affected genes in the 4-24 hpf regimen may
also have been caused by the lower concentrations of toxi-
cants that we had to apply to ensure sufficient survival at
these younger stages. Irrespective of this, these data indicate
a high stage specificity of the toxicogenomic effects in the
three treatment windows.
The toxicogenomic responses triggered by different
toxicants are highly specific
We focused further analysis on the 96-120 hpf stage and used
the full set of 11 toxicants by including treatments with AA,
PCB, As, tBHQ and Pb. Replicate hybridizations with mRNA
from at least three independent toxicant treatments were per-
formed (see Table 1). Toxicant effects were clustered based on
their Euclidean distance to each other and the similarity of
gene responses was determined by a Pearson correlation
proximity measure. The expression profiles summarize clus-
tering results for a subset of 199 genes across all 11 toxicant
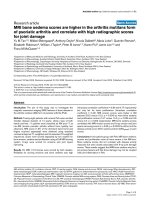
Distinct toxicogenomic expression profiles are induced by different toxicantsFigure 2
Distinct toxicogenomic expression profiles are induced by different toxicants. (a) Principal component analysis of the toxicogenomic profiles derived from
three different embryonic stages. Embryos were exposed to vehicle controls or to one of six chemicals for the periods 4-24 hpf (green), 24-48 hpf (blue),
or 96-120 hpf (red). Circles, TCDD: 150 ng/l (24 hpf), 500 ng/l (48 hpf), 500 ng/l (120 hpf). Squares, MeHg: 50 μg/l (24 hpf), 60 μg/l (48 hpf), 60 μg/l (120
hpf). Triangles, VA: 15 mg/l (24 hpf), 50 mg/l (48 hpf), 50 mg/l (120 hpf). Crosses, 4CA: 15 mg/l (24 hpf), 50 mg/l (48 hpf), 50 mg/l (120 hpf). Asterisks, Cd
500 μg/l (24 hpf), 5 mg/l (48 hpf), 5 mg/l (120 hpf). Stars, DDT: 5 mg/l (24 hpf), 15 mg/l (48 hpf), 15 mg/l (120 hpf). While the transcriptional profiles of the
4-24 hpf treatment group (green symbols) cluster closely, characteristic gene-expression profiles were induced by the 24-48 hpf (blue symbols) and the 96-
120 hpf (red symbols) exposures to each of the different toxicants. (b) Venn diagram comparing the number of genes induced at the three stages by all six
toxicants. Numbers indicate numbers of regulated or co-regulated genes at the different stages (more than 1.95-fold change and adjusted p
adj
< 0.025).
Principal component 1
Principal component 2
(a)
48 hpf
393
24 hpf
38
120 hpf
233
9
6
68
(b)
4
Genome Biology 2007, 8:R227
Genome Biology 2007, Volume 8, Issue 10, Article R227 Yang et al. R227.6
responses (Figure 3). The gene-selection criteria applied take
into account the extent and significance of changes in gene
expression (at least twofold, p
adj
< 0.025) as well as differ-
ences and similarities in expression changes between toxi-
cants (see Materials and methods). Distinct patterns of gene
expression were noted for each of the 11 compounds. How-
ever, similarities in gene responses were also detected. One
group of chemicals with related gene responses comprises Pb,
As, Cd, tBHQ, MeHg and VA (see Figure 3, lanes 6 to 11).
Another subgroup of related responses was induced by
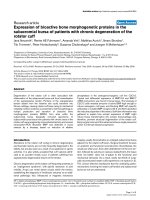
Toxicants induce highly specific toxicogenomic profilesFigure 3
Toxicants induce highly specific toxicogenomic profiles. Hierarchical clustering of gene responses in embryos treated between 96 and 120 hpf with PCB
(33 mg/l), TCDD (500 ng/l), 4CA (50 mg/l), DDT (15 mg/l), AA (71 mg/l), As (79 mg/l), Pb (2.8 mg/l), Cd (5 mg/l), tBHQ (1.7 mg/l), MeHg (60 μg/l), VA (50
mg/l). For each toxicant exposure, vehicle controls were carried out in parallel. The gene names are indicated (N) and are legible upon magnification of the
PDF version of this figure. The key at the top indicates the color code for fold changes ranging from threefold upregulated (+3, red) to threefold
downregulated (-3, blue). Fold changes greater than three are not indicated explicitly but are included. Only genes are listed whose mRNA levels changed
by more than twofold (p
adj
< 0.025) in at least one of the treatments. The data represent the average over all biological and technical repeats (see Table 1).
1 2 3 4 5 6 7 8 9 10 11 N
PCB TCDD 4CA DDT AA As Pb Cd tBHQ MeHg VA
Genome Biology 2007, Volume 8, Issue 10, Article R227 Yang et al. R227.7
Genome Biology 2007, 8:R227
TCDD, 4CA, DDT and AA (see Figure 3, lanes 2-5), whereas
the PCB triggered a more distinct expression profile (see Fig-
ure 3, lane 1).
As verification, we carried out blind tests to identify the
chemicals by their induced gene-expression profile. Fourteen
out of the 15 chemicals were unambiguously identified (Table
2). In the case of 4CA, close matches were scored to the 4CA,
the DDT and the AA response profiles (see Table 2). Thus, we
identified the correct group of chemicals (see Figure 3, lanes
2-4). Taken together, the results from these blind trials
underscore the reliability of the toxicogenomic profiles and
furthermore suggest that it is possible to derive signatures of
toxicogenomic responses predictive for specific chemicals or
chemical groups from whole animal exposure experiments.
The induced genes fell into different gene ontology groups
such as genes involved in combating oxidative stress (Table 3)
and genes encoding chaperones (Table 4). Another major
class of genes that was significantly regulated by a number of
toxicants comprised solute carriers (Table 5). We also carried
out a computational analysis of the affected genes using the
GoTreeMachine algorithm to identify more complex path-
ways and processes (Additional data files 2-9). An inflamma-
tory response was induced by several compounds (As, 4CA,
Cd, MeHg, Pb, PCB and tBHQ), whereas inductions charac-
teristic of an immune response were evoked by MeHg and
tBHQ. The latter compound also triggered genes involved in
G-protein-coupled signaling and phototransduction. Induc-
tion of genes with a function in base-excision repair was
noted in the case of exposure to As and PCB, suggesting that
these compounds cause DNA damage in the embryo.
Table 2
Summary of results from blind experiments
Test 4CA Cd DDT MeHg TCDD VA AA As Pb PCB tBHQ
Pb 6.15 6.78 8.66 6.76 10.91 7.96 7.62 6.32 5.01 10.66 6.81
DDT 6.74 9.86 4.51 8.79 7.79 8.01 5.39 10.38 8.96 10.05 9.13
4CA 6.87* 10.96 6.69* 9.47 8.82 8.87 6.99* 11.21 8.42 10.75 9.42
TCDD 8.55 12.43 6.78 11.01 5.42 10.37 7.61 10.76 12.61 15.63 10.62
As 9.14 9.56 10.93 9.74 12.46 9.89 10.18 6.88 7.51 11.32 7.51
Pb 7.25 7.95 10.05 7.38 12.06 8.62 8.65 9.58 4.22 9.91 7.70
PCB 9.84 9.30 13.17 10.23 15.01 10.01 11.78 12.77 10.62 3.93 10.40
As 9.18 9.99 9.92 10.20 11.53 10.16 9.43 5.48 7.84 12.40 7.67
TBHQ 8.79 7.49 11.32 9.24 11.52 10.29 10.98 8.93 9.77 11.31 6.33
PCB 8.37 7.74 12.06 8.88 13.65 8.54 10.63 11.79 10.22 5.71 9.08
AA 7.18 10.79 4.29 9.28 7.21 8.63 3.56 7.67 8.12 13.04 8.86
TBHQ 7.49 7.26 11.22 8.30 11.66 9.00 10.40 9.57 9.58 10.47 5.41
Cd 8.32 6.67 10.76 8.39 12.79 8.90 10.16 10.89 6.96 8.05 8.15
VA 6.43 8.25 6.47 7.57 9.04 4.57 6.15 9.56 8.02 10.24 8.33
AA 10.26 14.38 7.09 12.23 9.61 11.59 6.25 11.26 10.54 13.89 11.84
Embryos were exposed from 96 to 120 hpf with the test compounds (Test). The table gives the Euclidean distances between the expression profiles
for test compounds and the 11 toxicants. Bold type indicates the correct match. An ambiguous score was obtained in the case of 4CA (*) with three
closely matching expression profiles. Note that the assessment of each test compound is based on one experiment.
Table 3
Oxidative stress genes and their response to toxicants
Gene name Gene ID AA As 4CA Cd MeHg Pb PCB tBHQ VA
Peroxiredoxin 1 BI980610 3.9 13.6 4.1 3.1 7.7 9.9 7.5
Thioredoxin BI864190 14.2 3.5 4 4.4 8.1 2.5 6.1
Glutathione S-transferase omega 1 AW019036 3 6.3 2.1 2.6 3.5 2.2
Glutathione S-transferase pi AF285098 2 4.1 3.2 5.9 2.7
Glutathione S-transferase omega 2 BI979918 5.6 2.7 5.2 2.1
Thioredoxin interacting protein BI892352 2 2
Glutathione peroxidase AW232474 -4.2
Gene ID refers to the accession number in GenBank.
Genome Biology 2007, 8:R227
Genome Biology 2007, Volume 8, Issue 10, Article R227 Yang et al. R227.8
Identification of tissue-specific genes
We next verified the observed gene responses by methods
other than microarray hybridization. First, the changes in
gene expression were confirmed by re-evaluating a subset of
gene responses by semi-quantitative reverse transcription
PCR (RT-PCR). Out of 14 gene responses analyzed, all showed
the up- or downregulation expected from the array data (Fig-
ure 4). This suggests that the changes in transcript levels
measured by the microarray hybridizations reflect genuine
responses to the toxicants.
We used in situ hybridization with selected probes to toxi-
cant-treated and control embryos to assess the tissue-specific
expression patterns of the response genes and whether these
are altered in response to toxicant. Cytochrome P4501A1
mRNA (AF057713) was induced by 500 ng/l TCDD in
endothelial cells (15/15 embryos, Figure 5a,b). The levels of
glutathione peroxidase 1 (AW232474) mRNA in stomach and
gut were repressed by 60 μg/l MeHg (11/15 embryos, Figure
5c,d), in agreement with microarray and RT-PCR data (see
Figure 4).
The neuromasts of the zebrafish lateral line are very sensitive
to a number of compounds including CdCl
2
[28-30]. the
mRNA for oncomodulin A (also called parvalbumin3a),
which is expressed in the hair cells and supporting cells of
neuromasts in untreated embryos, is barely detectable in the
neuromasts of embryos treated with 500 μg/l CdCl
2
(13/15
embryos, Figure 5e,f), in concordance with the Cd-induced,
4.4-fold decrease of oncomodulin A mRNA measured by
microarray hybridization (see Figure 4). In contrast, thiore-
doxin-like mRNA (BI864190) is upregulated in hair cells (12/
13 embryos, Figure 5g,h) in response to Cd. This suggests that
Cd does not cause a complete loss of hair cells, even though
staining with the dye DASPEI suggests that hair cells are
strongly reduced (data not shown). The thioredoxin-like
mRNA is also expressed in selected areas of the brain. These
regions show also increased levels of expression in response
to Cd (data not shown). In summary, these in situ expression
studies show that the microarray procedure used permits
detection of organ- and cell-specific gene responses with very
high sensitivity. Moreover, these results also suggest that the
gene responses occur in almost all of the embryos exposed to
the toxicants.
Table 4
Chaperone genes and their response to toxicants
Gene name Gene ID As 4CA Cd Pb PCB tBHQ VA
Stress protein HSP70 AB062116 10.1 2.2 7 2.5 5.4 12.3 2.7
AF210640 10.9 6.6 2.5 5 10.8 2.7
Hsp70 (2) AF006007 7.6 6.3 2.1 4.6 10.1 2.4
Heat shock protein HSP 90-alpha AF068773 2.6
Heat shock cognate 70 kDa protein BM024785 3
DnaJ (Hsp40) homolog, family A, member 1 BI891737 3.6 3.6
Ahsa1 protein BM103957 2.2 2.1
Table 5
Solute carrier family genes and their response to toxicants
Gene name Gene ID As 4CA Cd MeHg Pb PCB VA
Solute carrier family 16 member 9 (1) BE016639 2.5 2.9 2.4 3.6 4.1 2.3
Solute carrier family 16 member 9 (2) BI474827 3.4 4.3 4.8 4.7 7.9 3
Solute carrier family 16 member 6 AW421040 2.9 4 4.6 2.9
Solute carrier family 2 member 5 AI477656 2.1 2.1 2.5
Solute carrier family 6 member 8 BI980828 2 2.2 2.4
Solute carrier family 43, member 2 BI887324 2.1
Solute carrier family 3 BG985518 2.1
Solute carrier family 20 (phosphate) member 1 BI890772 2.2
Solute carrier family 6 (GABA) member 1 BF157011 -3.1
BI563084 -2.1
Genome Biology 2007, Volume 8, Issue 10, Article R227 Yang et al. R227.9
Genome Biology 2007, 8:R227
The genome responds to very low toxicant
concentrations
The concentrations of the toxicants were adjusted in the ini-
tial experiments so that they caused morphologically visible
defects in exposed animals. We asked next whether one could
measure changes in the expression profiles at lower concen-
trations that do not have apparent morphological effects.
TCDD, DDT, Cd, 4CA, MeHg, and VA were used as a set of test
compounds. We could detect significant changes in gene
expression (at least twofold and p
adj
< 0.025) in response to
0.5 mg/l Cd, 6 μg/l MeHg, 5 mg/l VA, 25 mg/l 4CA, 15 mg/l
DDT, and 50 ng/l TCDD (Figure 6a-c, Table 6, and data not
shown). With the exception of 6 μg/l MeHg and 25 mg/l 4CA,
these low concentrations did not cause obvious morphologi-
cal or behavioral defects (data not shown), suggesting that
this assay can detect responses to toxicant concentrations
that do not cause acute morphological effects. It is clear,
however, that the number of genes with a significant response
to the toxicants decreases (see Table 6). Cytochrome P4501a1
was fivefold upregulated by 50 ng/l TCDD, oncomodulin A
was reduced 4.5-fold by 0.5 mg/l Cd and peroxiredoxin was
still 3.5-fold induced by 6 μg/l MeHg. Thus, even though
fewer genes respond to these lower concentrations, the meas-
ured changes in transcript levels are robust.
Complex synergistic effects are evident in
toxicogenomic responses to compound mixtures
In the environment we are normally confronted with com-
pound mixtures rather than pure substances. The compo-
nents of these mixtures could act synergistically, thereby
potentiating the toxic effect [31]. We therefore investigated
whether synergistic effects of compound mixtures can be
observed in toxicogenomic profiles. To this end, 96-hpf
embryos were exposed to a mixture of low concentrations of
Cd (50 μg/l), Pb (280 μg/l), MeHg (6 μg/l) and As (7.9 mg/l).
About twice as many genes (158 genes) were significantly up-
or downregulated (absolute change at least twofold, p
adj
<
0.025) than the sum of the genes regulated by exposure to the
RT-PCR analysis confirms selected gene responsesFigure 4
RT-PCR analysis confirms selected gene responses. Embryos were exposed to the indicated toxicants (500 ng/l TCDD; 15 mg/l DTT; 5 mg/l Cd; 60 μg/l
MeHg; 50 mg/l VA; 50 mg/l 4CA; 79 mg/l As) or vehicle alone (embryo medium or 0.2% ethanol or 0.025% DMSO, 1.4 mg/l toluene) between 96 and 120
hpf. (a) cDNA was synthesized and subjected to PCR with primers specific for the selected genes indicated. Gene ID refers to the accession number in
GenBank. The number of temperature cycles (cycle numbers) for every set of amplifications is indicated. The fold-change column summarizes the results
from the microarray experiments for comparison with the RT-PCR results shown in (b). See legend of Figure 1 for details of treatments and controls. β-
actin mRNA was used as a toxicant-insensitive reference. ND, not determined, as the actin gene response fell into the class of nonregulated genes in the
microarray results.
Toxicants Gene ID
Gene name
Fold
change
cycle
numbers
TCDD AI397347 Similarity to keratin type 1 (human) -2.6 30
AF057713 Danio rerio cytochrome p 4501A 37.7 25
DDT BI533854 Weakly similar to c-type lectin -2.1 25
Cd BE201681 Danio rerio Oncomodulin A -4.4 25
AW174507 Danio rerio materix metalloprotinase 9 8.8 25
AF210640 Danio rerio HSP 70 8.2 20
AW305943 Danio rerio materix metalloproteinase 13 7.5 30
BI864190 Similarity to thioredoxin 4.3 25
Hg AW232474 Danio rerio glutathione peroxidase 1 -4.7 25
BI980610 Similarity to natural killer cell enhacning factor 3.9 25
BI864190 Similarity to thioredoxin 3.8 25
BG727181 unknown 3.2 30
VA AY050500 Danio rerio cone transducin alpha subunit -2.4 25
AW422298 Similarity to transcription factor ATF-3 4.2 25
4 CA BI843145 unknown -2.8 30
BI980610 Similarity to natural killer cell enhancin g factor 3.9 30
As BI864190 Similarity to thioredoxin 11.4 30
Embryo medium β-actin ND 30
0.2% ethanol β-actin ND 30
0.025%DMSO+ 1.4
mg/l toluene
β-actin ND 30
Cont Treat
Genome Biology 2007, 8:R227
Genome Biology 2007, Volume 8, Issue 10, Article R227 Yang et al. R227.10
individual toxicants (81 genes: Cd 48 genes; As 12 genes;
MeHg 5 genes; Pb 16 genes). Complex expression profiles
composed of both additive and synergistic as well as novel
patterns of gene responses (at least twofold change, p
adj
<
0.025; Figure 6d) were scored for the mixture. In the case of
the genes with similarity to peroxiredoxin (BI980610) or the
solute carrier family members 6 and 9 (BE016639,
AW421040), the response to the mixture appears to be purely
additive (see Figure 6d, dots; Table 6, and Additional data file
13). In other instances, for example the Hsp70-related genes
(AB062116, AF210640, AF006007) or the sequestosome1
gene (AW343560), the mixture induced a strong increase in
transcript levels, whereas significant gene responses (more
than twofold, p
adj
< 0.025) were not induced by administra-
tion of the individual compounds (see Figure 6d, arrowheads,
Table 6, Additional data file 13). These genes can, however, be
induced by higher concentrations of the individual com-
pounds (see Figures 3, 6a,b and Additional data files 10, 11),
suggesting that the observed synergy is the result of a lowered
response threshold. Curiously, we also noted loss of gene
responses on exposure to the compound mixture (see Figure
6d), suggesting suppressive effects of the combination. For
example, the transcript levels of glutathione-S-transferase
omega 1 (AW019036) are significantly altered by exposure to
PbCl
2
, but not by the mixture (see Table 3 and Additional data
file 13). In a few instances we observed opposing effects, such
as in the case of suppressor of cytokine signalling 3
(BI878700), which was 4.9-fold downregulated by As and
2.6-fold upregulated by the mixture (see Additional data file
13). Taken together, these results show potentiated, additive,
and nonadditive effects of the mixture in comparison to the
individual compounds.
Discussion
We have shown that a diverse set of 11 chemicals induces
highly specific gene responses in the zebrafish embryo. More-
over, synergy effects and responses to low-dose exposure
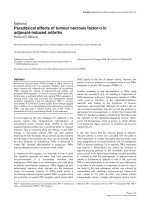
Examples of toxicant-responsive genes that are expressed in a highly tissue-restricted mannerFigure 5
Examples of toxicant-responsive genes that are expressed in a highly tissue-restricted manner. (a) 48 hpf vehicle 3 control. Figure 1 indicated the
exposure embryo from 96 to 120 hpf and (b) 500 ng/l TCDD-treated embryos hybridized to a cytochrome P450 1A1 antisense probe. TCDD-treated
embryos showed increased levels of cytochrome P4501A1 mRNA in blood vessels Arrow, primary head sinus, arrowhead, intersegmental vessel. (c) 72
hpf vehicle control 1 and (d) 60 μg/l MeHg-exposed embryos hybridized to a glutathione peroxidase 1 probe. Embryos showed a reduction of mRNA
levels in the gut (arrow). Embryos were treated from 4 to 72 hpf and were then fixed for in situ processing. (e) Control embryo and (f) 500 μg/l CdCl
2
-
treated embryo hybridized to oncomodulin A antisense mRNA. Oncomodulin A mRNA levels are downregulated in the hair cells of the lateral-line organ
(arrow) in response to Cd exposure. (g) Control and (h) Cd-treated embryos hybridized to a thioredoxin antisense probe. Thioredoxin is upregulated in
the hair cells of the neuromasts (arrow). Embryos are oriented anterior to the left and dorsal up (a,b,e-h) or with dorsal side facing (c,d). Scale bar
represents 220 μm.
(a)
(b)
(c)
(d)
(e)
(f)
(g)
(h)
Genome Biology 2007, Volume 8, Issue 10, Article R227 Yang et al. R227.11
Genome Biology 2007, 8:R227
were detectable in the genome-wide transcriptional response.
Our work provides proof of principle that the zebrafish
embryo can serve as a specific and highly sensitive whole-ani-
mal model to monitor the toxicogenomic impact of chemicals.
Although vertebrate cell lines and other in vitro test methods
have great merits in assessing toxicological effects of drugs
and pollutants, they cannot replace whole animal test systems
entirely. The classical animal models such as mice, rats and
rabbits are expensive and attract concerns from animal-rights
groups. Zebrafish embryos before the feeding stage offer a
cheap and ethically acceptable vertebrate model that will not
only be useful in the toxicological assessment of the tens of
thousands of compounds to be tested under the REACH pro-
gram but can also help to evaluate the developmental toxicity
of novel compounds at an early stage of drug development.
The requirement for adequate animal models for assessing
developmental toxicology is further underscored by the
remarkable stage dependence of the observed toxicogenomic
profiles. These differences in gene responses are likely to be a
reflection of the dynamics of cell differentiation and morpho-
genesis, which will be impossible to model in all their aspects
in cell culture and other in vitro systems. The differences in
The concentration dependence of toxicogenomic responses and the synergistic effects of low dosesFigure 6
The concentration dependence of toxicogenomic responses and the synergistic effects of low doses. (a-c) Embryos were exposed to decreasing
concentrations of Cd (a, lane 1, 5 mg/l: lane 2, 2.5 mg/l; lane 3, 0.5 mg/l), or MeHg (b, lane 1, 60 μg/l; lane 2, 30 μg/l; lane 3, 6 μg/l) or TCDD (c, lane 1, 500
ng/l; lane 2, 250 ng/l; lane 3, 50 ng/l). The low concentrations elicit significant changes in gene expression. (d) Embryos were exposed either to 50 μg/l Cd
(lane 1) or 6 μg/l MeHg (lane 2) or 7.9 mg/l As (lane 3) or 280 μg/l Pb (lane 4) alone, or to a mixture (Mix, lane 5) of Cd (50 μg/l), Pb (280 μg/l), MeHg (6
μg/l) and As (7.9 mg/l). The mixture shows a strongly increased response with respect to the degree of changes of expression of individual genes (dark red
and dark blue bars). Arrowheads point to examples of synergistic responses whereas the dots highlight genes whose response seems to be additive. The
square indicates a gene that was downregulated by As and slightly upregulated by the mixture. All exposures were performed between 96 and 120 hpf.
The color key for fold changes in gene expression in (a-c) is indicated on the left and ranges from threefold upregulated (red) to threefold downregulated
(blue). The color key for (d) is on the right and ranges from fivefold upregulated (red) to fivefold downregulated (blue). White bars indicate missing data.
Only genes were listed whose mRNA levels changed by at least twofold (p
adj
< 0.025) in at least one of the treatments. The data represent the average
over all biological and technical repeats (see Table 1).
Cd MeHg TCDD Cd MeHg As Pb Mix
1 2 3 1 2 3 1 2 3 1 2 3 4 5
Genome Biology 2007, 8:R227
Genome Biology 2007, Volume 8, Issue 10, Article R227 Yang et al. R227.12
gene responses were particularly striking at early stages, pre-
sumably reflecting the fact that many organs exist only as
rudiments at these times and have not fully acquired their
physiological function. It is also possible that the inter-
embryonic variability of the gene responses is higher at this
stage, blurring the gene-expression changes in the pooled
cDNA.
Previous work showed that the sensitivity of the zebrafish
embryo to toxicants equals that of the commonly used tests
on adult freshwater fish, allowing a reliable prediction of the
toxic potential of chemicals [10,11]. The embryonic DarT
assay [10,11] uses an exposure paradigm from cleavage stages
to 48 hpf and relies on a set of morphological endpoints and
lethality. Morphological readouts provide little discrimina-
tion between the effects of different compounds, especially in
the case of environmental toxicants with a broad spectrum of
toxic effects on the embryo. In marked contrast to the mor-
phological endpoints, we found highly specific patterns of
transcriptional changes, resulting in barcode-like patterns of
gene responses. With one exception, we were able to predict
the chemical unequivocally by its pattern of induced gene-
expression changes. In most cases, these patterns are related,
forming distinct subgroups of profiles, but are still suffi-
ciently different from one another to discriminate the individ-
ual compounds.
Strikingly, a general response to oxidative stress or protein
damage does not seem to exist in the zebrafish embryo. A
number of the chemicals (see Table 3) induced genes involved
in the cellular systems that combat the effects of oxidative
stress [32]. However, the induced oxidative-stress genes dif-
fered between chemicals, suggesting toxicant-specific effects
(see Table 3). A similar observation was made with respect to
chaperones (see Table 4). The tissue-specific expression of
these genes as well as restricted tissue effects of the toxicant
may be important in this context. For example, the expression
of the thioredoxin-like gene is restricted to a small number of
neurons in the brain. In in situ hybridization experiments,
strong elevation of thioredoxin-like mRNA levels in response
to Cd and MeHg was also noticed in the hair cells of the lateral
line as well as in the brain. The differences in the type of
induced defense genes and their tissue-restricted expression
suggest tissue-specific effects of the different toxicants.
Another Gene Ontology (GO) group that is differentially reg-
ulated by exposure to a number of toxicants is represented by
members of the solute carrier (SLC) family (Table 5). These
transmembrane proteins have key roles in the transport of
small molecules including neurotransmitters across vesicular
and plasma membranes [33]. It is tempting to speculate that
the specific downregulation of the GABA transporter SCL6
member 1 by VA (see Table 5) may be related to the therapeu-
tic effect of VA as a suppressor of epileptic seizures.
The concentrations that elicited toxicogenomic responses are
in the range of pollutant levels prevailing in the environment.
We did not, however, exclude the possibility that compounds
Table 6
The number of regulated genes in response to different concentrations of toxicants
Toxicants Stage Concentration Number of regulated genes
4CA 120 hpf 50 mg/l 201
25 mg/l 2
5 mg/l 0
Cd 120 hpf 5 mg/l 475
2.5 mg/l 102
0.5 mg/l 57
DDT 120 hpf 15 mg/l 25
1.5 mg/l 0
0.15 mg/l 0
TCDD 120 hpf 500 ng/l 34
250 ng/l 34
50 ng/l 4
VA 120 hpf 50 mg/l 335
25 mg/l 1
5 mg/l 4
MeHg 120 hpf 60 μg/l 417
30 μg/l 20
6 μg/l 9
The fold change was equal to or greater than 1.5 and p
adj
< 0.025. Note that for reasons of increased sensitivity we used a lower fold-change cutoff
in this experiment compared with that in Figure 2b, which explains the higher number of regulated genes in this set of experiments.
Genome Biology 2007, Volume 8, Issue 10, Article R227 Yang et al. R227.13
Genome Biology 2007, 8:R227
accumulate in the embryo, resulting in higher intra-embry-
onic concentrations than in the environment. Toxicogenomic
responses were triggered by TCDD, Cd, DDT, and VA at con-
centrations that did not cause changes in morphology. Thus
the genomic response appears to be more sensitive to toxic
insult than is morphogenesis. A crucial question is whether
the gene responses that are not obviously correlated with
pathological alterations are indeed deleterious to the animal.
For example, TCDD was shown to induce a battery of genes in
the mouse paw (including homologs of genes we scored in our
study) without obvious teratological consequences to paw
development [34]. Future work will need to address whether
the low-level effects on gene expression could be correlated
with, and hence used to predict, chronic effects of long-term
exposure.
The lowest concentration of MeHg (6 μg/l) triggered signifi-
cant changes in gene expression. In addition, we also noted
teratological effects on movement and tail development at
these concentrations (L.Y. and J.R.K., unpublished work),
indicating that low concentrations of MeHg are acutely toxic
in the zebrafish embryo. Disturbingly, blood serum levels of
MeHg in humans can be in the same concentration range
[35]. The zebrafish embryo may be much more susceptible to
MeHg, but defining blood serum levels that are regarded as
safe in humans is an active area of research.
Application of a mixture of MeHg, Cd, As, and Pb at low con-
centrations resulted in synergistic effects with more than
additive numbers of genes affected and also novel patterns of
gene-expression changes. Clearly, some of the genes affected
by exposure to the mixture would be induced or repressed by
higher concentrations of the individual chemicals. Examples
are the thioredoxin and Hsp70 genes. Thus, it appears that
the threshold at which induction occurs is lowered. This
agrees with previous studies of mixture effects that support
the notion of 'concentration addition', in which a component
of the mixture can be replaced by an equipotent
concentration of another compound [31]. The patterns of
gene-expression changes induced individually by the four
chemicals differed, however, suggesting that other effects
have to be taken into account that cannot be explained by an
additive mechanism of action.
Expression levels of genes, and presumably also responses to
environmental toxicants, can vary dramatically between indi-
viduals. In a systematic study of variation in gene expression
in natural populations of fish of the genus Fundulus, signifi-
cant differences in gene expression were noted in 18% of the
907 genes analyzed [36]. In this respect, zebrafish embryos
have a big advantage over mammalian systems as one can
easily obtain large numbers of embryos and can thus average
the individual gene responses by using pooled cDNA pre-
pared from many embryos. In the cases where we confirmed
the gene responses by in situ hybridization, we found that
most individuals showed the expected upregulation, suggest-
ing that many of the observed responses have a high
penetrance.
While the complete development outside of the mother and
the transparency of the zebrafish embryos are certainly
important advantages for observation, the small size of the
embryos limits the possibility of dissecting particular organs
for toxicogenomic analysis. To overcome these limitations,
one can use transgenic animals expressing green fluorescent
protein and fluorescence-activated cell sorting to enrich for
particular cell types [37]. Moreover, even whole-embryo
exposure protocols as we used here permit detection of highly
tissue-restricted gene responses such as those seen, for exam-
ple, in the lateral line, which comprises only a very small frac-
tion of the whole embryo.
Conclusion
The induction of the Hsp70 gene was previously shown to be
a sensitive biomarker in zebrafish for exposure to Cd and
other heavy metals [38]. The work presented here adds a long
list of other highly sensitive biomarkers to be developed as
transgenic biosensors. We believe that the zebrafish could
become a key model for molecular developmental toxicology.
Functional studies of TCDD toxicity in the zebrafish embryo
well illustrate this (reviewed in [39]). Forward genetics [40-
43], targeting-induced local lesions in genomes (TILLING)
[40], morpholino knockdown [44], transgenesis [38,45] and
in situ expression studies [46,47] at cellular resolution repre-
sent a powerful technical repertoire for dissecting toxicologi-
cal pathways. Moreover, a large number of developmental
mutants have been isolated, some of which may serve as
direct targets for drugs and toxicants [48,49]. We believe that
the work on the toxicogenomics of zebrafish embryos
reported here is a fundamental contribution to the use of the
zebrafish embryo as a model system for molecular develop-
mental toxicology.
Materials and methods
Chemicals and embryo treatment
AA (acrylamide; CH
2
= CHCONH
2
), PCB (Aroclor 1254), As
(arsenic (III) oxide; As
2
O
3
), tBHQ (tert-butylhydroquinone;
(CH
3
)
3
CC
6
H
3
-1,4-(OH)
2
), Cd (cadmium chloride;
CdCl
2
2H
2
O), 4CA (4-chloroaniline; ClC
6
H
4
NH
2
), DDT (1,1-
bis-(4-chlorphenyl)-2,2,2-trichlorethane; ClC
6
H
4
)
2
CHCCl
3
),
Pb (lead (II) chloride; PbCl
2
), MeHg (methylmercury chlo-
ride; CH
3
ClHg), TCDD (2,3,7,8-tetrachlorodibenzo-p-dioxin)
and VA (valproic acid; CH
3
(CH
2
)
4
CO
2
H) were purchased
from Sigma-Aldrich (St Louis, MO).
Wild-type zebrafish strains AB, ABO and Tübingen were kept
and bred as described [50]. Embryos were grown in embryo
medium (60 μg/ml Instant Ocean, Red Sea, Houston, TX).
Different numbers of embryos were exposed to the chemicals:
4-24 hpf (600 embryos), 24-48 hpf (400 embryos) and 96-
Genome Biology 2007, 8:R227
Genome Biology 2007, Volume 8, Issue 10, Article R227 Yang et al. R227.14
120 hpf (200 embryos). Vehicle controls used were embryo
medium alone (for Cd, Hg, Pb, As, VA, AA treatments) or
0.2% ethanol in embryo medium (for tBHQ, 4CA, PCB, DDT
treatments) or 0.025% DMSO, 1.4 mg/l toluene in embryo
medium (500 ng/l TCDD) or 0.0075% DMSO, 420 μg/l tolu-
ene (150 ng/l TCDD) or 0.0025% DMSO, 140 μg/l toluene (50
ng/l TCDD). Toxicant concentrations were adjusted in such a
way that embryo death was minimal. The few dead embryos
were discarded before preparation of RNA. None of the vehi-
cle controls had an apparent toxic effect on the embryos by
itself. As the toluene-related chemical benzene can synergize
with TCDD [51] we cannot completely exclude a synergistic
effect between TCDD and toluene at the 1.4 mg/l toluene
concentration.
Microarray analysis
A total of 16,399 gene-specific 65mers designed by Compugen
(Jamesburg, NY) and produced by Sigma-Genosys (The
Woodlands. TX) were purchased and the probes (40 mM)
were spotted in duplicate in two separate subarrays using a
Gene Machines Omnigrid 100 (San Carlos, CA) and Tel-
eChem SMP3 pins (Sunnyvale, CA) on CodeLink activated
slides (GE Healthcare, Chalfont St Giles, UK). Upon evalua-
tion it turned out, however, that plates 29 to 43 had faulty
amine linkers, impairing the retention of the oligonucleotides
on the coat-link slides. As the companies were unable to
replace the defective oligonucleotides, we used the reduced
set of intact oligonucleotides (384-well plates 1 to 28).
Total RNA was isolated from toxicant- and vehicle-treated
embryos in every experiment in parallel using the Nucleospin
RNA L Kit (Macherey-Nagel, Düren, Germany) and mRNA
was extracted with the Ambion Purist Kit (Austin, TX).
Labelled cDNA was synthesized from 1-2 μg mRNA using the
Amersham direct cDNA labeling kit (Amersham Europe,
Freiburg, Germany). Upon removal of unincorporated
nucleotides over Microcon 30 spin columns (Millipore, Bed-
ford, MA), the concentrated probes were hybridized to the
microarray in 1× DIG Easy-Hyb buffer (Hoffmann-La Roche,
Basel, Switzerland) overnight at 42°C. Coverslips were
removed from the slides by flushing with 4× SSC and slides
were washed in prewarmed wash buffer 1 (2× SSC, 0.1% SDS)
for 5 min at 42°C, then in buffer 2 (0.1× SSC, 0.1% SDS) for 10
min at room temperature, and finally in 0.1× SSC four times
for 1 min at room temperature. The slides were briefly dipped
into 0.01× SSC at room temperature before centrifugation for
7 min at 800 rpm in an Eppendorf 5810R centrifuge.
Arrays were scanned using the Axon model 4000B dual-laser
scanner and the corresponding GenePix 6 software (Molecu-
lar Devices, Union City, CA). Both channels (532 nm for Cy3
and 635 nm for Cy5) were scanned in parallel and stored as
16-bit TIFF files. Each array was scanned three times (low,
medium, and high scan) with different signal-amplification
factors (voltage settings of the photomultiplier tubes), but
with the same laser power. The channels for Cy3 and Cy5 were
balanced in each scan for approximately the same intensity
range. For the low scan no spot was saturated; in the high
scan the signal amplification for Cy5 was set to approximately
80% of maximum and Cy3 amplification was adjusted to this.
The settings used in the medium scan lie between the low and
the high scan. The absolute intensity values span the range
from 0 to 65536. The scans were performed with a resolution
of 10 μm. From each spot with a mean diameter of 100 μm,
70-80 pixels were recorded. Individual local background
areas around the spots were defined, which comprised
approximately 400 pixels. For each channel, the spot signals
were calculated as the median intensity of all foreground pix-
els minus the median intensity of all background pixels.
All microarray data from this study have been deposited in
NCBI's Gene Expression Omnibus under the accession
number GPL4603.
Data preprocessing, quality control, transformation,
and normalization
Raw data was derived from the result files generated by the
GenePix 6 suite and analyzed with the R software [52].
Preprocessing of data comprises mapping of scans, quality
control, transformation, and normalization steps. Signal
intensities from low, medium, and high scans are mapped
onto the same scale by an affine transformation. Transforma-
tion parameters are estimated based on a least-squares opti-
mization. Averaging the transformed intensities gives the
consensus signals, which are independent of the voltage set-
tings of the photomultiplier tube.
Quality control was performed on a spot and array level.
Spots ideally have a diameter of 100 μm. Diameters less than
70 μm and greater than 140 μm are indicative of scratches
and printing problems and the corresponding data was
discarded. In addition, inconsistent spots with a coefficient of
variance of pixels bigger than 0.7, and weak spots with a fore-
ground signal less than 175% of the background signal were
removed from further analyses. Strong but unreliable signals
with at least 20% of pixels in saturation were discarded. Qual-
ity control on array level determined the overall quality of
each single chip. Therefore, results from different arrays were
compared with each other on the basis of correlation param-
eters, scatterplots and chi-plots for all combinations of arrays
for a particular treatment [53,54]. Raw intensities were trans-
formed with the natural logarithm. A locally weighted regres-
sion smoother (LOESS) was applied to correct intensity-
dependent signal patterns [55]. The regression is a first-order
polynomial that takes into account the subset of 25% of spots
that yield a signal with similar intensities. Variance stabiliza-
tion for weakly expressing genes was not performed as such
effects were not apparent. All chips hybridized for a particular
treatment were scaled to a common median absolute devia-
tion from median (MAD) of the logarithmic fold change (M
value) [56]. Statistical analysis was based on the assumption
that the majority of genes are not changed in their expression
Genome Biology 2007, Volume 8, Issue 10, Article R227 Yang et al. R227.15
Genome Biology 2007, 8:R227
and that the overall up- and downregulations compensate
each other in sum.
Each individual gene was tested for difference in expression
under toxic conditions with a t-test where an adjusted p value
(p
adj
) of less than 0.025 indicated significant differential
expression. Statistical requirements of normal distribution
and homoscedasticity are tenable. A robust variance estima-
tion was derived by balancing gene-specific and pooled vari-
ance [57]. The number of false positives due to multiple
testing was reduced by adjusting the resulting p values by
controlling the Benjamini-Hochberg false discovery rate [27].
Multivariate analysis was based on a subset of genes of inter-
est. Genes that remain unchanged under all conditions were
ignored. Marker genes that are significantly changed by expo-
sure to a particular toxicant were taken into account. In addi-
tion, the selected subset included genes that showed a global
response across many chemicals. The selected subset
included: the top 20 up- or downregulated genes based on
fold change (minimum fold change > 2); the top seven genes
with the highest correlation among at least two toxicants
(minimum correlation > 0.7); the top 100 genes with the
highest MAD across all treatments; and the marker genes that
are regulated at least threefold for just one treatment.
Most multivariate approaches require a complete dataset
without missing values. Under the condition that more than
80% of the data for a particular gene is available, missing data
for gene g are imputed by a k-nearest-neighbor algorithm
[58]. Missing values are estimated as weighted average of the
values for the k genes with the closest Euclidean distance to
gene g.
The logarithmic fold changes (M values) of genes under toxic
conditions are subjected to PCA and hierarchical clustering.
The principal components of experimental data across all
experiments were derived by SVD [59]. Gene-expression pro-
files summarize clustering information for toxicants and
genes. Dissimilarity between toxicants is determined as
Euclidean distance of their M values. In contrast, proximity
between two genes is derived as the arc cosine transformed
Pearson correlation coefficient [60].
GO analysis of toxicant-affected genes was carried out by
extracting the human homologs from the Zebrafish Chip
Annotation Database [61]. The GO trees and categories were
established with the web-based GoTreeMachine [62]. The
number of genes with significant alterations in expression
levels in response to TCDD, DDT, and AA were too few to be
analyzed by GoTreeMachine.
Expression analysis
In situ hybridization and RT-PCR were carried out using
standard procedures [46,63]. The sequences of the primers
used in RT-PCR are listed in Additional data file 14. Embryos
and RNA samples were derived from independent toxicant
exposures. Cell death was monitored by acridine orange
staining and examination by fluorescence microscopy [64].
Additional data files
Additional data is available online with this paper. Additional
data file 1 summarizes the preliminary data evaluating the
effectiveness of toxin treatment. Additional data file 2 con-
tains a GO tree for arsenic oxide. Additional data file 3 con-
tains a GO tree for 4CA. Additional data file 4 contains a GO
tree for cadmium chloride. Additional data file 5 contains a
GO tree for methylmercury. Additional data file 6 contains a
GO tree for lead chloride. Additional data file 7 contains a GO
tree for PCB. Additional data file 8 contains a GO tree for
tBHQ. Additional data file 9 contains a GO tree for VA. Addi-
tional data file 10 summarizes gene responses of embryos
exposed to different concentrations of Cd. Additional data file
11 summarizes gene responses of embryos exposed to differ-
ent concentrations of MeHg. Additional data file 12 summa-
rizes gene responses of embryos exposed to different
concentrations of TCDD. Additional data file 13 summarizes
gene responses of embryos exposed to 50 μg/l CdCl
2
(Cd) or 6
μg/l MeHg (MeHg) or 7.9 mg/l As
2
O
3
(As) or 280 μg/l PbCl
2
(Pb) alone or to a mixture (Mix). Additional data file 14 is a
list of primers used in the RT-PCR experiments shown in Fig-
ure 4.
Additional data file 1Summary of preliminary data to evaluate the effectiveness of toxin treatmentEmbryos were exposed between 24 and 48 hpf and the morpholog-ical defects were scored at 72 hpf.Click here for fileAdditional data file 2Gene ontology tree for arsenic oxideSignificant gene ontology groups affected by the toxicant are indi-cated in red.Click here for fileAdditional data file 3Gene ontology tree for 4-chloroanilineSignificant gene ontology groups affected by the toxicant are indi-cated in red.Click here for fileAdditional data file 4Gene ontology tree for cadmium chlorideSignificant gene ontology groups affected by the toxicant are indi-cated in red.Click here for fileAdditional data file 5Gene ontology tree for methylmercurySignificant gene ontology groups affected by the toxicant are indi-cated in red.Click here for fileAdditional data file 6Gene ontology tree for lead chlorideSignificant gene ontology groups affected by the toxicant are indi-cated in red.Click here for fileAdditional data file 7Gene ontology tree for PCBSignificant gene ontology groups affected by the toxicant are indi-cated in red.Click here for fileAdditional data file 8Gene ontology tree for tBHQSignificant gene ontology groups affected by the toxicant are indi-cated in red.Click here for fileAdditional data file 9Gene ontology tree for valproic acidSignificant gene ontology groups affected by the toxicant are indi-cated in red.Click here for fileAdditional data file 10Summary of gene responses of embryos exposed to different con-centrations of CdSummary of gene responses of embryos exposed to different con-centrations of Cd.Click here for fileAdditional data file 11Summary of gene responses of embryos exposed to different con-centrations of MeHgSummary of gene responses of embryos exposed to different con-centrations of MeHg.Click here for fileAdditional data file 12Summary of gene responses of embryos exposed to different con-centrations of TCDDSummary of gene responses of embryos exposed to different con-centrations of TCDD.Click here for fileAdditional data file 13Summary of gene responses of embryos exposed to 50 μg/l CdCl
2
(Cd) or 6 μg/l MeHg (MeHg) or 7.9 mg/l As
2
O
3
(As) or 280 μg/l PbCl
2
(Pb) alone or to a mixture (Mix)ID, GeneBank accession number.Click here for fileAdditional data file 14List of primers used in the RT-PCR experiments shown in Figure 4List of primers used in the RT-PCR experiments shown in Figure 4.Click here for file
Authors' contributions
L.Y. and U.S. conceived the work and designed the experi-
ments. U.S. supervised the project and wrote the manuscript.
L.Y. performed all of the experimental work. J.R.K. optimized
some of the concentrations of the toxicants. C.Z. and J.J per-
formed statistical analysis of the microarray data. M.B. and
M.P. provided technical assistance in microarray printing.
F.M. gave technical advice at an early stage of the project. J.L.
performed the gene ontological analysis.
Acknowledgements
We thank M. Rastegar and S. Rastegar for their help in lab organization, and
J. Katzenberger, M. Bonnaus and N. Gretz for technical assistance. This
work was supported through the Additional Funding Scheme of the
Helmholtz-Gemeinschaft.
References
1. Andreasen EA, Mathew LK, Tanguay RL: Regenerative growth is
impacted by TCDD: gene expression analysis reveals extra-
cellular matrix modulation. Toxicol Sci 2006, 92:254-269.
2. Yoon CY, Park M, Kim BH, Park JY, Park MS, Jeong YK, Kwon H, Jung
HK, Kang H, Lee YS, et al.: Gene expression profile by 2,3,7,8-
tetrachlorodibenzo-p-dioxin in the liver of wild-type (AhR+/
+) and aryl hydrocarbon receptor-deficient (AhR-/-) mice. J
Vet Med Sci 2006, 68:663-668.
3. Koizumi S, Yamada H: DNA microarray analysis of altered gene
expression in cadmium-exposed human cells. J Occup Health
2003, 45:331-334.
Genome Biology 2007, 8:R227
Genome Biology 2007, Volume 8, Issue 10, Article R227 Yang et al. R227.16
4. Hood RD: Handbook of Developmental Toxicology Boca Raton, FL: CRC
Press; 1997.
5. Combes R, Dandrea J, Balls M: A critical assessment of the Euro-
pean Commission's proposals for the risk assessment and
registration of chemical substances in the European Union.
Altern Lab Anim 2006, 34(Suppl 1):29-40.
6. Grindon C, Combes R: Introduction to the EU REACH
legislation. Altern Lab Anim 2006, 34(Suppl 1):5-10.
7. Suter L, Babiss LE, Wheeldon EB: Toxicogenomics in predictive
toxicology in drug development. Chem Biol 2004, 11:161-171.
8. Kimmel CB, Ballard WW, Kimmel SR, Ullmann B, Schilling TF: Stages
of embryonic development of the zebrafish. Dev Dyn 1995,
203:253-310.
9. Zon LI, Peterson RT: In vivo drug discovery in the zebrafish. Nat
Rev Drug Discov 2005, 4:35-44.
10. Nagel R: DarT: The embryo test with the Zebrafish Danio
rerio - a general model in ecotoxicology and toxicology. Altex
2002, 19(Suppl 1):38-48.
11. Braunbeck T, Boettcher M, Hollert H, Kosmehl T, Lammer E, Leist E,
Rudolf M, Seitz N: Towards an alternative for the acute fish
LC(50) test in chemical assessment: the fish embryo toxicity
test goes multi-species - an update. Altex 2005, 22:87-102.
12. Alestrom P, Holter JL, Nourizadeh-Lillabadi R: Zebrafish in func-
tional genomics and aquatic biomedicine. Trends Biotechnol
2006, 24:15-21.
13. Langheinrich U: Zebrafish: a new model on the pharmaceutical
catwalk. BioEssays 2003, 25:904-912.
14. Parng C: In vivo zebrafish assays for toxicity testing.
Curr Opin
Drug Discov Dev 2005, 8:100-106.
15. Mathavan S, Lee SG, Mak A, Miller LD, Murthy KR, Govindarajan KR,
Tong Y, Wu YL, Lam SH, Yang H, et al.: Transcriptome analysis of
zebrafish embryogenesis using microarrays. PLoS Genet 2005,
1:260-276.
16. Lam SH, Wu YL, Vega VB, Miller LD, Spitsbergen J, Tong Y, Zhan H,
Govindarajan KR, Lee S, Mathavan S, et al.: Conservation of gene
expression signatures between zebrafish and human liver
tumors and tumor progression. Nat Biotechnol 2006, 24:73-75.
17. Linney E, Dobbs-McAuliffe B, Sajadi H, Malek RL: Microarray gene
expression profiling during the segmentation phase of
zebrafish development. Comp Biochem Physiol C Toxicol Pharmacol
2004, 138:351-362.
18. Lien CL, Schebesta M, Makino S, Weber GJ, Keating MT: Gene
expression analysis of zebrafish heart regeneration. PLoS Biol
2006, 4:e260.
19. Xu J, Srinivas BP, Tay SY, Mak A, Yu X, Lee SG, Yang H, Govindarajan
KR, Leong B, Bourque G, et al.: Genomewide expression profil-
ing in the zebrafish embryo identifies target genes regulated
by Hedgehog signaling during vertebrate development.
Genetics 2006, 174:735-752.
20. Meijer AH, Verbeek FJ, Salas-Vidal E, Corredor-Adamez M, Bussman
J, van der Sar AM, Otto GW, Geisler R, Spaink HP: Transcriptome
profiling of adult zebrafish at the late stage of chronic tuber-
culosis due to Mycobacterium marinum infection. Mol Immunol
2005, 42:1185-1203.
21. Voelker D, Vess C, Tillmann M, Nagel R, Otto GW, Geisler R,
Schirmer K, Scholz S: Differential gene expression as a toxicant-
sensitive endpoint in zebrafish embryos and larvae. Aquat
Toxicol 2007, 81:355-364.
22. Lam SH, Winata CL, Tong Y, Korzh S, Lim WS, Korzh V, Spitsbergen
J, Mathavan S, Miller LD, Liu ET, et al.: Transcriptome kinetics of
arsenic-induced adaptive response in zebrafish liver. Physiol
Genomics 2006, 27:351-361.
23. Andreasen EA, Mathew LK, Lohr CV, Hasson R, Tanguay RL: Aryl
hydrocarbon receptor activation impairs extracellular
matrix remodeling during zebra fish fin regeneration.
Toxicol
Sci 2007, 95:215-226.
24. EPA: welcome to ECOTOX [ />quick_query.htm]
25. Nau H, Hauck RS, Ehlers K: Valproic acid-induced neural tube
defects in mouse and human: aspects of chirality, alternative
drug development, pharmacokinetics and possible
mechanisms. Pharmacol Toxicol 1991, 69:310-321.
26. Wiltse J: Mode of action: inhibition of histone deacetylase,
altering WNT-dependent gene expression, and regulation of
beta-catenin developmental effects of valproic acid. Crit Rev
Toxicol 2005, 35:727-738.
27. Benjamini Y, Hochberg Y: Controlling the false discovery rate: A
practical approach to multiple testing. J R Stat Soc 1995,
57:289-300.
28. Linbo TL, Stehr CM, Incardona JP, Scholz NL: Dissolved copper
triggers cell death in the peripheral mechanosensory system
of larval fish. Environ Toxicol Chem 2006, 25:597-603.
29. Santos F, MacDonald G, Rubel EW, Raible DW: Lateral line hair
cell maturation is a determinant of aminoglycoside suscepti-
bility in zebrafish (Danio rerio). Hear Res 2006, 213:25-33.
30. Chen WY, John JA, Lin CH, Chang CY: Expression pattern of
metallothionein, MTF-1 nuclear translocation, and its DNA-
binding activity in zebrafish (Danio rerio) induced by zinc and
cadmium. Environ Toxicol Chem 2007, 26:110-117.
31. Escher BI, Hermens JL: Modes of action in ecotoxicology: their
role in body burdens, species sensitivity, QSARs, and mix-
ture effects. Environ Sci Technol 2002, 36:4201-4217.
32. Winyard PG, Moody CJ, Jacob C: Oxidative activation of antioxi-
dant defence. Trends Biochem Sci 2005, 30:453-461.
33. Gether U, Andersen PH, Larsson OM, Schousboe A: Neurotrans-
mitter transporters: molecular function of important drug
targets. Trends Pharmacol Sci
2006, 27:375-383.
34. Bemis JC, Alejandro NF, Nazarenko DA, Brooks AI, Baggs RB, Gasie-
wicz TA: TCDD-induced alterations in gene expression pro-
files of the developing mouse paw do not influence
morphological differentiation of this potential target tissue.
Toxicol Sci 2007, 95:240-248.
35. Centers for Disease Control and Prevention [http://
www.cdc.gov/exposurereport/pdf/factsheet_mercury.pdf]
36. Oleksiak MF, Churchill GA, Crawford DL: Variation in gene
expression within and among natural populations. Nat Genet
2002, 32:261-266.
37. Dickmeis T, Plessy C, Rastegar S, Aanstad P, Herwig R, Chalmel F,
Fischer N, Strahle U: Expression profiling and comparative
genomics identify a conserved regulatory region controlling
midline expression in the zebrafish embryo. Genome Res 2004,
14:228-238.
38. Blechinger SR, Warren JT Jr, Kuwada JY, Krone PH: Developmental
toxicology of cadmium in living embryos of a stable trans-
genic zebrafish line. Environ Health Perspec 2002, 110:1041-1046.
39. Carney SA, Prasch AL, Heideman W, Peterson RE: Understanding
dioxin developmental toxicity using the zebrafish model.
Birth Defects Res A Clin Mol Teratol 2006, 76:7-18.
40. Sood R, English MA, Jones M, Mullikin J, Wang DM, Anderson M, Wu
D, Chandrasekharappa SC, Yu J, Zhang J, et al.: Methods for reverse
genetic screening in zebrafish by resequencing and
TILLING. Methods 2006, 39:220-227.
41. Driever W, Solnica-Krezel L, Schier AF, Neuhauss SC, Malicki J, Stem-
ple DL, Stainier DY, Zwartkruis F, Abdelilah S, Rangini Z, et al.: A
genetic screen for mutations affecting embryogenesis in
zebrafish. Development 1996, 123:37-46.
42. Mullins MC, Nüsslein-Volhard C: Mutational approaches to stud-
ying embryonic pattern formation in the zebrafish. Curr Opin
Gen Dev 1993, 3:648-654.
43. Amsterdam A, Hopkins N: Mutagenesis strategies in zebrafish
for identifying genes involved in development and disease.
Trends Genet 2006, 22:473-478.
44. Nasevicius A, Ekker SC: Effective targeted gene 'knockdown' in
zebrafish. Nat Genet 2000, 26:216-220.
45. Hill A, Howard CV, Strahle U, Cossins A: Neurodevelopmental
defects in zebrafish (Danio rerio) at environmentally relevant
dioxin (TCDD) concentrations. Toxicol Sci 2003, 76:392-399.
46. Strähle U, Blader P, Adams J, Ingham PW: Non-radioactive in situ
hybridization procedure for tissue sections. Trends Genet 1994,
10:75-76.
47. Oxtoby E, Jowett T: Cloning of the zebrafish krox-20 gene (krx-
20) and its expression during hindbrain development. Nucl
Acids Res 1993, 21:1087-1095.
48. Behra M, Cousin X, Bertrand C, Vonesch JL, Biellmann D, Chatonnet
A, Strahle U: Acetylcholinesterase is required for neuronal
and muscular development in the zebrafish embryo. Nat
Neurosci 2002, 5:111-118.
49. Behra M, Etard C, Cousin X, Strahle U: The use of zebrafish
mutants to identify secondary target effects of acetylcholine
esterase inhibitors. Toxicol Sci 2004, 77:325-333.
50. Westerfield M: The Zebrafish Book Eugene: University of Oregon
Press; 1993.
51. Mizell M, Romig ES: The aquatic vertebrate embryo as a senti-
nel for toxins: zebrafish embryo dechorionation and periv-
itelline space microinjection. Int J Dev Biol 1997, 42:411-423.
52. The R Project for Statstical Computing [http://www.R-
Genome Biology 2007, Volume 8, Issue 10, Article R227 Yang et al. R227.17
Genome Biology 2007, 8:R227
project.org]
53. Fisher NL, Switzer P: Chi-plots for assessing dependence. Bio-
metrica 1985, 72:253-265.
54. Fisher NL, Switzer P: Graphical assessment of independence: is
a picture worth 100 tests? Am Stat 2001, 55:233-239.
55. Cui X, Kerr MK, Churchill GA: Transformations for cDNA
microarray data. Stat Appl Genet Mol Biol 2003, 2:Article4.
56. Yang YH, Dudoit S, Luu P, Lin DM, Peng V, Ngai J, Speed TP: Nor-
malization for cDNA microarray data: a robust composite
method addressing single and multiple slide systematic
variation. Nucleic Acids Res 2002, 30:e15.
57. Baldi P, Long AD: A Bayesian framework for the analysis of
microarray expression data: regularized t-test and statistical
inferences of gene changes. Bioinformatics 2001, 17:509-519.
58. Troyanskaya O, Cantor M, Sherlock G, Brown P, Hastie T, Tibshirani
R, Botstein D, Altman RB: Missing value estimation methods for
DNA microarrays. Bioinformatics 2001, 17:520-525.
59. Alter O, Brown PO, Botstein D: Singular value decomposition
for genome-wide expression data processing and modeling.
Proc Natl Acad Sci USA 2000, 97:10101-10106.
60. Eisen MB, Spellman PT, Brown PO, Botstein D: Cluster analysis
and display of genome-wide expression patterns. Proc Natl
Acad Sci USA 1998, 95:14863-14868.
61. Zebrafish Chip Annotation Database [.a-
star.edu.sg/~govind/zebrafish]
62. Gene Ontology Tree Machine [ />gotm]
63. Sambrook J, Russel DW: Molecular Cloning: A Laboratory Manual 3rd
edition. New York: Cold Spring Harbor Press; 2001.
64. Ton C, Lin Y, Willett C:
Zebrafish as a model for developmental
neurotoxicity testing. Birth Defects Res (Part A) 2006, 76:553-567.