Báo cáo y học: "The determinants of gene order conservation in yeasts" pdf
Bạn đang xem bản rút gọn của tài liệu. Xem và tải ngay bản đầy đủ của tài liệu tại đây (473.15 KB, 12 trang )
Genome Biology 2007, 8:R233
Open Access
2007Poyatos and HurstVolume 8, Issue 11, Article R233
Research
The determinants of gene order conservation in yeasts
Juan F Poyatos
*
and Laurence D Hurst
†
Addresses:
*
Logic of Genomic Systems Laboratory, Spanish National Biotechnology Centre, Centro Superior de Investigaciones Científicas
(CSIC), Darwin 3, Campus de Cantoblanco, Madrid 28049, Spain.
†
Department of Biology and Biochemistry, University of Bath, Bath BA2 7AY,
UK.
Correspondence: Juan F Poyatos. Email:
© 2007 Poyatos and Hurst; licensee BioMed Central Ltd.
This is an open access article distributed under the terms of the Creative Commons Attribution License ( which
permits unrestricted use, distribution, and reproduction in any medium, provided the original work is properly cited.
Gene order conservation<p>Current intergene distance is shown to be consistently the strongest predictor of synteny conservation as expected under a simple null model, and other variables are of lesser importance.</p>
Abstract
Background: Why do some groups of physically linked genes stay linked over long evolutionary
periods? Although several factors are associated with the formation of gene clusters in eukaryotic
genomes, the particular contribution of each feature to clustering maintenance remains unclear.
Results: We quantify the strength of the proposed factors in a yeast lineage. First we identify the
magnitude of each variable to determine linkage conservation by using several comparator species
at different distances to Saccharomyces cerevisiae. For adjacent gene pairs, in line with null
simulations, intergenic distance acts as the strongest covariate. Which of the other covariates
appear important depends on the comparator, although high co-expression is related to synteny
conservation commonly, especially in the more distant comparisons, these being expected to
reveal strong but relatively rare selection. We also analyze those pairs that are immediate
neighbors through all the lineages considered. Current intergene distance is again the best
predictor, followed by the local density of essential genes and co-regulation, with co-expression
and recombination rate being the weakest predictors. The genome duplication seen in yeast leaves
some mark on linkage conservation, as adjacent pairs resolved as single copy in all post-whole
genome duplication species are more often found as adjacent in pre-duplication species.
Conclusion: Current intergene distance is consistently the strongest predictor of synteny
conservation as expected under a simple null model. Other variables are of lesser importance and
their relevance depends both on the species comparison in question and the fate of the duplicates
following genome duplication.
Background
The precise location of genes in eukaryotic genomes was
assumed to be largely random not so long ago [1]. This was
motivated by the understanding that, unlike in bacteria, there
need not be chromosomal domains associated with high rates
of gene transcription. Common reports of chromosome inver-
sions with little effect on phenotype confirmed the picture of
random placement of genes and a lack of selective constraint
on gene order [2].
However, recent studies in diverse eukaryotes challenge this
initial intuition [3]. Indeed, in all well studied eukaryotic
genomes, genes of similar expression tend to cluster more
commonly than expected by chance [3]. For example, in
Published: 5 November 2007
Genome Biology 2007, 8:R233 (doi:10.1186/gb-2007-8-11-r233)
Received: 10 July 2007
Revised: 12 September 2007
Accepted: 5 November 2007
The electronic version of this article is the complete one and can be
found online at />Genome Biology 2007, 8:R233
Genome Biology 2007, Volume 8, Issue 11, Article R233 Poyatos and Hurst R233.2
humans both broadly [4,5] and highly [6,7] expressed genes
cluster, while in yeast highly co-expressed genes are neigh-
boring more commonly than expected [8]. The same ten-
dency for genes that are physically close to be co-expressed
might additionally explain why genes whose proteins are
close in either the metabolic [9,10] or protein-protein interac-
tion network [11,12] are in close chromosomal proximity
more commonly than expected. More subtle organizations
have also been claimed, such as periodicity in gene location
[13], but this appears to be caused by data biases [14]. Not all
patterns are necessarily associated with co-expression of
some variety. Most notably, in yeast, essential genes cluster
into domains of low recombination [15]. The clustering of
essential genes may be more to do with ensuring precise con-
trol over expression (that is, minimal noise), rather than co-
expression per se [16].
While all these previous analyses helped to clarify some of the
factors associated with gene order, they also opened new
questions. Most particularly, how important, in absolute and
relative terms, are all of these features? If we take a pair of
genes adjacent to each other in Saccharomyces cerevisiae, we
can then ask whether the same two genes are also adjacent or
not in a different species. How relevant are the above param-
eters in explaining which genes are adjacent in both species?
In yeast, intergene distance and co-expression have been
shown to be two independent determinants of gene order
conservation using Candida albicans as comparator species
[17]. Intergene distance is expected under the simplest neu-
tral null model of gene order evolution. This is because we
suppose that a re-arrangement that disrupts a gene will not be
tolerated, hence those genes currently with a large intergene
distance between them are more likely to be affected by viable
gene re-ordering events, all else being equal (note that under
this simplest null model it follows that overlapping genes are
impossible to break up). Likewise, a pair of genes that cur-
rently have a large intergene distance between them are more
likely to have had in the past a large intergene distance, even
if they were not immediately next to the genes that are cur-
rently their neighbors.
Other evidence suggests that this null model alone is not ade-
quate. Notably, essential genes tend to stay together more
commonly than expected by chance, although their mean
intergenic distance is unexceptional [15,18]. Whether this is
owing to selection per se or simply a reduced probability of
chromosomal re-arrangements in domains of low recombina-
tion [12] remains unclear. We can then ask a series of ques-
tions. First, if we treat each parameter in isolation, we can ask
whether that parameter explains a significant proportion of
conservation of gene order. Second, in a fuller model we can
ask how relatively important and independent each of the
parameters might be. Third, are the results of the above anal-
yses sensitive to which comparator species we employ to com-
pare with S. cerevisiae? Fourth, can we predict the
characteristics of those gene pairs that through all lineages of
yeast have remained physically together? Finally, what will be
the effect of the differential gene silencing associated with the
whole genome duplication in the yeast lineage?
To address these questions, we computed a group of potential
determinants in S. cerevisiae and quantified how they deter-
mined linkage conservation in a full yeast lineage.
Results and discussion
A neutral model of gene order evolution
While in principle a relationship between intergene distance
and conservation rates of genes that are immediate neighbors
seems reasonable, a problem in demonstrating this derives
from the fact that intergene distance data that we can directly
obtain from genome sequencing describe the situation after
the process of evolution from an ancestor. If we assume that
DNA is neither lost nor gained, then a gene pair with a small
intergene distance in S. cerevisiae may have a small distance
either because the pair have always resided together and the
intergene distance has not changed or because the pair came
together following an inversion and this inversion just hap-
pened to bring with it a small intergene spacer. Moreover, two
genes may be together in both S. cerevisiae and a relatively
distant comparator, for example, C. albicans, not because
they have always been immediate neighbors but because
repeated events broke them up but also re-positioned them,
bringing them back together. To further investigate the extent
to which intergene distance might differ between genes that
are immediate neighbors in any two species and those that are
immediate neighbors only in one of the two species, we per-
formed a set of neutral simulations.
In these simulations we consider a chromosome with 400
genes. The intergene distance between any gene pair is ran-
domly selected from intergene distances currently observed
in S. cerevisiae (after removal of overlapping transcripts). We
then randomly select a position on the chromosome and
accept this position if it is an intergene spacer. We then pick a
point that is approximately 5 kb upstream or downstream of
the selected chromosome location and accept it as the end
point of the inversion if in intergene spacer. This distance
approximately matches the mean size of the small inversions
seen in yeasts [19]. We then invert the sequence, thereby
altering intergene distance between, at the most, two pairs of
genes. We then carry on evolving the new chromosome over
numerous rounds of inversions. We repeat the simulation for
1,000 inversions 100 times.
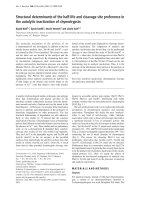
The first question to ask is what might be the relationship
between the number of genes that are still immediate neigh-
bors in the derived chromosome that were ancestrally also
immediate neighbors. To examine this we compare the
evolved chromosome with the ancestral one and partition
gene pairs into those that are in retained synteny (that is, still
immediate neighbors) and those that are not. Note that if A
Genome Biology 2007, Volume 8, Issue 11, Article R233 Poyatos and Hurst R233.3
Genome Biology 2007, 8:R233
and B reside next to each other in the ancestor, then AB or BA
ordering is considered to be preserved synteny, regardless of
the DNA strand on which the two genes reside. Results are
shown in Figure 1. As can be seen, the data describe an expo-
nential decay function of rates of synteny conservation with
increasing numbers of inversions. Note too that the asymp-
tote of this function is not zero conserved synteny. This is
owing to the fact that by chance in any random chromosome
a certain number of gene pairs will be the same as in any other
random chromosome.
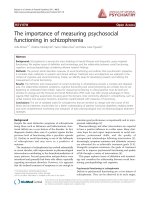
The second question to ask is what, at any given time point
following divergence from an ancestor, is the difference in
intergene distance between those genes currently in pre-
served synteny and those that are no longer nearest neigh-
bors. To examine this we compare the current intergene
distances between the two groups. For each simulation we
consider the mean intergene distance in the two groups and
then consider the mean of these means over all simulations.
As can be seen (Figure 2), at all divergence times (measured
as number of inversions) the group remaining in synteny has
a smaller mean intergene distance in the descendent chromo-
some. At least two reasons underpin this. First, as previously
noted, randomly selected positions are most likely in long
intergene spacers. A second, less appreciated fact is that when
genes separated by a long spacer are involved in inversions,
they tend to bring with them abundant intergene spacer
sequence. Hence, not only do those genes that are retained in
synteny comprise a special subgroup associated with low
intergene distance, but those genes not retained in synteny
tend not to transfer to the small intergene distance class.
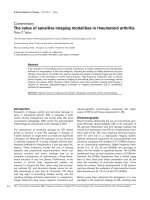
A third question to ask is how the simulations relate to real
data. To do this we consider the following for both the real
and simulated data. We take all currently observed neighbor-
ing gene pairs (that is, those in S. cerevisiae or those at the
relevant point in the simulations) and rank order them
according to their intergene distance. We then consider the
top 50 (smallest intergene distance) and ask what proportion
are retained in synteny. We then consider ranks 2 to 51 and
repeat the calculation and so forth. For each species compar-
ison (S. cerevisiae versus other), we consider in the simula-
tions the distributions after the same number of inversions as
corresponds to the number of gene pairs overall that are not
in preserved synteny in the real data. As can be seen (Figure 3
and Additional data file 1), the correspondence between the
simulant data and the observed data is striking. In all cases,
for both the real data and the simulation, the genes with the
shortest intergene distances show much higher levels of syn-
teny conservation than those with longer intergene distances.
This qualitative fit suggests that a simple null model that
genes divided by large intergene distances are more likely to
be re-ordered or, more precisely, to have been re-ordered,
provides, to a first approximation, a good fit. This is yet more
remarkable given that we suppose that gene orientation has
no impact on the effect of a re-arrangement. This is an unre-
alistic assumption given that, of all three possible orienta-
tions of gene pairs, two convergent genes (→ ←) are unique in
having no promoter sequence in the intergene spacer. This
might in part explain why in many cases a further regularity
appears, namely that gene pairs currently closely linked (that
is, with little intergene distance) are not conserved quite as
much as in the simulations while, conversely, those with
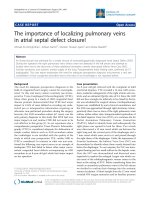
Rate of synteny conservation in a null model of gene order evolutionFigure 1
Rate of synteny conservation in a null model of gene order evolution. The
relationship between the proportion of gene pairs retained as neighbors
and the number of inversions between two taxa.
0 200 400 600 800 1,000
0 0.2 0.4 0.6 0.8 1.0
Number of inversions
Proportion of gene pairs still as neighbours
Differences in intergene distanceFigure 2
Differences in intergene distance. Intergene distances of gene pairs
currently in synteny and in the ancestor (blue) and those that were not
ancestral neighbors but currently are neighbors (red) as a function of the
number of inversions (error bars are standard error of the mean).
Number of inversions
Mean intergene distance
0 200 400 600 800 1,000
0 200 400 600 800 1,000
Genome Biology 2007, 8:R233
Genome Biology 2007, Volume 8, Issue 11, Article R233 Poyatos and Hurst R233.4
relatively large intergene spacers in S. cerevisiae tend to be
conserved somewhat more than seen in most simulants, while
the overall rate of synteny conservation is the same. Prior evi-
dence, however, also supports the view that the simple null
model, even allowing for gene orientation, cannot explain
everything. To assess the importance of the other suggested
correlates, we consider a set of statistical approaches in which
we look for deviations from the null model given by current
intergene distance.
Predictors of gene order conservation
We consider specifically seven factors either previously asso-
ciated with the formation of clusters or that could predict
linkage conservation in S. cerevisiae. These predictors are the
following: met, metabolic relationship [9,10,20]; cex, gene
co-expression [8]; igd, physical proximity (that is, intergenic
distance [17]); let, density of lethals (that is, local essential
gene density) [15]; rec, recombination rate [12]; cre, gene co-
regulation (number of common regulatory motifs between
two genes) [21]; and pro, distance in the protein-protein
interaction network [11,12].
In asking whether the above parameters predict gene order
conservation, we could be asking two different questions.
First, we could ask whether gene pairs of a particular class,
given they are of the same class, are preserved as immediate
neighbors more than those not in the same class. Second, we
can ask whether, in determining which genes are preserved in
linkage, the fact of belonging to the same class can explain
much of the variation. The difference in analysis can be easily
illustrated. Consider that there were just two genes in the
genome that belonged to a given class (perhaps there are just
two genes involved in a given cell process, process X). Con-
sider also that these two genes were always preserved in link-
age for some reason. At first sight process X looks like a strong
predictor, as, given that two genes both belong to class X and
are neighbors in one species, we can be sure they are neigh-
bors in another. If we approach the analysis using the first
method we would conclude that belonging to class X was
important. However, as a variable to explain patterns of
conservation or not of gene pairs in general, it explains very
little of the conservation of gene order (just one pair) and
most conservation of synteny has nothing to do with belong-
ing to class X or not. The second mode of analysis would
report that belonging to class X is not an important variable.
A priori then, we expect the answers to depend on precisely
what questions we ask.
We concentrate predominantly on the second mode of analy-
sis. We take two broad approaches. First, for given pairwise
comparisons (S. cerevisiae versus other species) we ask about
statistical models that act to explain the variation between
gene pairs as to whether they are syntenic (immediate neigh-
bors) in both species or not. Second, we ask about the proper-
ties of gene pairs that are syntenic in all of the species
concerned. While the first question allows us to ask whether
Proportion of gene pairs conserved in a comparator versus intergene distance in S cerevisiaeFigure 3
Proportion of gene pairs conserved in a comparator versus intergene
distance in S. cerevisiae. Profiles of the rate of gene pairs conserved versus
their current spacer in S. cerevisiae (red) or in simulants (blue) when
comparing S. cerevisiae with two comparator species for (a) C. glabrata and
(b) A. gossypii. For the simulations the number of inversions to run was
determined by comparing observed synteny conservation rates against
inversion number as shown in Figure 1. For our five focal species we also
restricted analysis to cases where both of the orthologues of the S.
cerevisiae gene pair are on the same chromosome in the comparator
species, as this fits better the simulant model and permits higher orthology
certainty. Each data point in the real and simulant data represents the
proportion of gene pairs from 50 showing conserved synteny, after the
data was rank ordered by intergene distance. After considering the first 50
we then considered ranks 2-51, 3-52, and so on. In addition, we also
considered other comparators, and a much more distant comparator, C.
albicans (Additional data file 1).
Genome Biology 2007, Volume 8, Issue 11, Article R233 Poyatos and Hurst R233.5
Genome Biology 2007, 8:R233
predictors of conservation of gene order are dependent on the
taxa compared and their phylogenetic distance, the second
mode permits us to distil the properties that enable gene
order conservation in the long term.
To begin, we start by asking whether there is a difference in
the predictor variables, each in isolation, between those gene
pairs that remain as immediate neighbors and those that do
not remain adjacent. To this end, we first computed these val-
ues for adjacent gene pairs in the S. cerevisiae genome with
homologues in a given comparator yeast species. We consid-
ered five hemiascomycetes species included in the Yeast Gene
Order Browser [22] in which the number of gene rearrange-
ments is not too high. The identification of homologues in a
given comparator should take into account the whole genome
duplication event that occurred in a shared ancestor of some
of the species considered. One has to specifically distinguish
between orthologues and paralogues to properly argue about
the conservation of a pair as adjacent. To avoid any ambigu-
ous assignment, we used the set of ancestral loci introduced
in [23]. Table 1 shows the mean values for these properties for
adjacent genes in S. cerevisiae, within the previous set, which
are found adjacent (-co) or nonadjacent (-nc) in the corre-
sponding comparator. As expected, a significant covariate for
gene order conservation in all cases is the intergenic distance,
with the physical distance between adjacent pairs in S. cere-
visiae clearly smaller for those pairs found adjacent in each
species comparison. Of the remaining parameters, not all
appear as important predictors. While genes adjacent in sev-
eral species have a stronger co-expression signal and lower
recombination rates, by contrast, distance in the metabolic
and protein-protein interaction networks did not appear to be
a relevant determinant of order conservation. In part this may
be a methodological artifact as we assume that all genes not
present in the network have an average distance, and most
genes are not in the network (a more restricted study, exam-
ining only those genes featured in the networks, corroborated
their relevance; see Materials and methods). We keep never-
theless both predictors in our study as controls. In summary,
this analysis confirms the relevance of several aspects of gene
expression control and genetic linkage as predictors of syn-
teny conservation in yeast. This method cannot, however,
really quantify the relative importance of each of them, so it is
this we describe next.
Quantifying predictor relevance in single species
We use multivariate analysis to disentangle the contribution
of each of the previous factors to gene order conservation. The
general idea is to describe the relationship between a depend-
ent variable, the response, and a group of independent varia-
bles, the predictors, by means of a multiple regression model.
In our case the response variable takes two discrete values; an
adjacent gene pair in S. cerevisiae could be found as adjacent
or nonadjacent in a given comparator species, so we apply
Table 1
Determinants of gene order conservation
C. glabrata* S. castelli* K. waltii K. lactis A. gossypii
Met-nc 3.831 3.83 3.828 3.828 3.826
Met-co 3.83 3.827 3.829 3.829 3.829
Cex-nc 0.066 0.068 0.067 0.068 0.067
Cex-co 0.077 0.079 0.082 0.086 0.082
Igd-nc 528.187 477.038 474.632 471.702 461.193
Igd-co 390.175 417.432 370.395 376.93 378.035
Let-nc 0.201 0.208 0.206 0.203 0.209
Let-co 0.216 0.204 0.226 0.224 0.225
Rec-nc 1.07 1.062 1.054 1.056 1.055
Rec-co 1.036 1.045 1.029 1.035 1.035
Cre-nc 0.207 0.162 0.12 0.129 0.121
Cre-co 0.111 0.114 0.113 0.118 0.122
Pro-nc 5.371 5.38 5.357 5.35 5.35
Pro-co 5.346 5.341 5.34 5.35 5.34
Rate-co 86% 84% 55% 55% 56%
Pairs 1678 1677 1860 1930 1852
Seven features were computed for adjacent gene pairs in S. cerevisiae (met, metabolic network distance; cex, gene co-expression; igd, intergenic
distance; let, density of lethals; rec, recombination rate; cre, gene co-regulation; pro, protein-protein interaction network distance; see Materials and
methods). The table shows the mean value of each of these properties for adjacent gene pairs that remained (-co) or did not remain (-nc) as adjacent
in the corresponding comparator yeasts. Species ordered according to phylogenetic distance to S. cerevisiae, the closest being C. glabrata. Note that
there does not exist yet a consensus phylogeny, for example [22,18]. The last two rows list the proportion of adjacent S. cerevisiae pairs retained as
adjacent in the corresponding comparator and total number of homologues pairs (both orthologues might not be in the same chromosome). A
smaller number was obtained (9% and 1,850 homologue gene pairs, respectively) when using C. albicans as comparator species [17]. *Yeasts that
diverged after the whole genome duplication event.
Genome Biology 2007, 8:R233
Genome Biology 2007, Volume 8, Issue 11, Article R233 Poyatos and Hurst R233.6
logistic regression [24]. We consider several complementary
strategies to estimate the relevance of each linkage predictor.
In addition, since the correlation between some of the deter-
minants could also be relevant, for example, essential clusters
having low recombination rates [15], a phenomenon termed
multicollinearity in regression modeling, we compute the cor-
relation matrix of the parameter estimates in the logistic
equation to quantify this effect (Materials and methods). The
final outcome of all these combined studies is the simplest
logistic model capable of predicting the observed conserva-
tion patterns.
We first apply these methods to the closest comparator spe-
cies, Candida glabrata, a post whole genome duplication
(WGD) species (Table 2). In the univariate regression studies,
the residual deviance of a logistic model with a single covari-
ate is shown. We find a deviance value smaller than that of the
null case (dev.null = 853.06) for some of the variables, nota-
bly co-regulation (dev.cre = 845.2). This indicates the possi-
ble relevance of this factor as a predictor. The strength of each
factor is further supported by the order of appearance of the
corresponding variable in a forward stepwise regression
model. This method includes as part of the descriptive model
only those terms that increase the goodness of fit (according
to the Akaike's criterion). In the multiple regression analyses,
we present estimates of the regression coefficients related to
each predictor with their corresponding standard errors (z-
values). The last two subcolumns in this study give the devi-
ance table, differences between models as variables are added
to the model in turn, and the probabilities associated with an
approximated
χ
2
test (deviance differences have approxi-
mately a
χ
2
null distribution with degrees of freedom equal to
the difference between the numbers of parameters in the two
models [24]). After this combined study, we introduce a
reduced model in which we retain only co-regulation and
intergenic distance as significant determinants. Indeed, if we
compare the full model, including all variables, with the
reduced one, we can hardly notice the difference in coefficient
estimates or deviance (data not shown). This is striking as it
suggests that, for this particular analysis, most of the pro-
posed co-variates are too weak to register as explanatory
variables.
The relationship between the probability that an adjacent pair
in S. cerevisiae was adjacent also in C. glabrata, Pr, and their
intergenic distance and co-regulation is:
logit Pr = 3.028 - 0.001 igd - 0.526 cre
where the logit transformation is given by logit ,
and igd, cre denotes intergenic distance (in units of base-
pairs) and co-regulation score (with a maximum value of 1),
respectively. The model indicates that the probability to be
adjacent in both species decreases with intergenic distance
and co-regulation, the latter being the weaker of the two
determinants. The relevance of each variable is easily deter-
mined by comparing the coefficients in Table 2, where varia-
bles were scaled in standard deviations (standardized data). A
higher absolute value of an estimate in these units, and its
order of appearance in the stepwise regression, reflects this
relevance. Moreover, the previous model gives us the effect of
change in one determinant when controlling the other. Thus,
the effect of an increase in intergene distance (in units of
base-pairs) for a fixed co-regulation score is exp(-0.001) =
0.999, while the maximal effect of increase in co-regulation,
controlling for spacer, is exp(-0.526) = 0.591 with cre = 1. Are
these effects independent? Analyzing the correlation between
estimates, we find some dependence between both predictors
(correlation of cre-igd coefficients: -0.19). We could in turn
Pr
Pr
Pr
=
−1
Table 2
S. cerevisiae versus C. glabrata logistic regression analyses
Multiple regression
Simple regression Stepwise
regression
Estimate z-value Residual deviation P(>|χ|)
Null 853.06 (0) 855.07 2.535 25.310 853.07 -
Met 852.93 (-) -0.052 -0.692 852.94 -
Cex 852.35 (-) 0.05 0.526 852.22 -
Igd 833.09 (1) 837.09 -0.312 -4.172 832.48 <0.0001
Let 853.02 (-) 0.044 0.453 832.33 -
Rec 850.4 (-) -0.084 -0.935 830.95 -
Cre 845.2 (2) 835.1 -0.168 -2.08 827.16 <0.05
Pro 852.7 (-) -0.092 -0.995 826.22 -
The first column lists the seven predictors contributing to the generalized models and the corresponding null model. The second column shows
residual deviance (equivalent to the residual sum of squares in ordinary regression analyses) of a model with a single determinant. The third column
describes a stepwise forward regression according to the Akaike criterion with insertion order in parenthesis. The last four columns list the results
of a multiple regression model (estimates and z-values) and the corresponding Anova with terms added sequentially from met to pro (residual and
χ
2
test).
Genome Biology 2007, Volume 8, Issue 11, Article R233 Poyatos and Hurst R233.7
Genome Biology 2007, 8:R233
add an additional term in the model to account for this inter-
action. However, the decrease in deviance achieved by this
more complex model is small, so we can still consider the two-
component model as a valid description. Overall, this corrob-
orates that an increase in intergene distance diminishes the
probability that genes are adjacent in both species. This also
suggests that non-adjacently conserved pairs exhibit stronger
co-regulation, which is, at first sight, a counter-intuitive
result. Analyzing this behavior in detail (data not shown), we
find that high co-regulation scores are associated with a low
density of regulatory motifs, that is, regulation by a small
number of common transcriptional factors. It is probably this
low density of regulatory sites that ensures that any re-
arrangement is less likely to be opposed by purifying
selection.
Predictors of linkage conservation in a yeast lineage
How would the previous model change with the comparator
species? To analyze this question, we consider five compara-
tor species: C. glabrata (discussed above), Saccharomyces
castelli, Kluyveromyces waltii, Kluyveromyces lactis, and
Ashbya gossypii. We apply the same methodology as in the
previous section (Additional data file 1) to obtain the corre-
sponding reduced logistic models. These models include only
those terms which significantly contributed to explain the
conservation pattern.
Table 3 shows the models associated with the different com-
parators. We see that recombination rate and, especially, co-
expression emerge as new determinants for pre-WGD spe-
cies. We examined how the probability to remain adjacent
changes with the comparator for the situation of an adjacent
pair with null spacer and averaged features, that is, zero mean
co-expression, no co-regulation and averaged recombination
rate (rec = 1). These probabilities are (see Table 3):
Thus, an 'averaged' adjacent pair in S. cerevisiae with null
intergenic distance is less likely to be found as adjacent in a
given comparator as phylogenetic distance increases. While
this is, naturally, trivial, it goes some way to validating the
method. More interesting is to see how this behavior changes
when these pair types have non-zero intergenic distances?
For a characteristic spacer of 500 bp, the probabilities to
remain adjacent are (0.93, 0.85, 0.75, 0.53, 0.56), which cor-
respond to a percentage of decrease with respect to previous
values of ~(2.1%, 6.6%, 9.6%, 18.5%, 17.6%). Gene pairs with
a large intergene distance should then be disproportionately
more likely to be conserved as adjacent the closer the compa-
rator species is to S. cerevisiae. Put differently, as the time to
common ancestor increases, as intergene distance increases,
so the probability that the genes are not in synteny in the
comparator goes up at an accelerating rate.
Co-expression and intergenic distance act as the two main
determinants of order conservation in pre-WGD species
(clustering of essential genes near the adjacent pairs appears
as a third determinant in K. waltii). These variables appear to
be independent since the correlation of their corresponding
estimates is low in all proposed models (<0.08 in all three
pre-WGD comparators). To analyze the role of co-expression
in more detail, we discretize the co-expression values so that
a unit increase in the model corresponds to an increase of 0.1
in the correlation (estimates did not change very much with
respect to those in Table 2). What is the effect of an increase
in co-expression? This is given by the exponential of the cor-
responding coefficient in the logistic model. For K. waltii, this
reads as exp(0.78) = 2.18, which indicates that, controlling for
intergene distance and recombination rate, each increase in
the correlation of 0.1 increases the odds that a pair remains as
adjacent by 2.18 (slightly higher values applied to K. lactis
and A. gossypii).
Properties of gene pairs preserved throughout yeast
evolution
Rather than asking whether given variables explain conserva-
tion of order in a given pairwise comparison, for which, as we
Pr(. )
(. )
.Cglabrata
exp
=
+−
=
1
13028
095
Pr(. )
(. )
.S castelli
exp
=
+−
=
1
12246
091
Pr(. )
(. . )
.Kwaltii
exp
=
+− −
=
1
111590422
083
Pr(. )
(.)
.Klactis
exp
=
+−
=
1
1062
065
Pr(. )
(. )
.Agossypii
exp
=
+−
=
1
10753
068
Table 3
Logistic models of gene order conservation for different compa-
rator species
Species Model
C. glabrata logit Pr = 3.028 - 0.001 igd - 0.526 cre
S. castelli logit Pr = 2.246 - 0.0005 igd
K. waltii logit Pr = 1.159 + 0.741 cex - 0.001 igd - 0.422 rec
K. lactis logit Pr = 0.62 + 1.047 cex - 0.001 igd
A. gossypii logit Pr = 0.753 + 0.849 cex - 0.001 igd
We applied a combination of methods (see main text) to obtain the
simplest logistic model capable to describe the observed conservation.
Here Pr is the probability that an adjacent pair in S. cerevisiae is found
adjacent in the corresponding comparator with logit . Cex,
co-expression; cre, co-regulation score; igd, intergenic distance; rec,
recombination rate.
Pr
Pr
Pr
=
−1
Genome Biology 2007, 8:R233
Genome Biology 2007, Volume 8, Issue 11, Article R233 Poyatos and Hurst R233.8
have seen, the answer heavily depends on the species chosen,
we can also ask which parameters are relevant to gene order
conservation by considering only those gene pairs that are
immediate neighbors through all the species we have exam-
ined (509 pairs). Naturally, the answers will again be some-
what subject to precisely which species we consider (indeed,
consider a comparator as distant as Schizosaccharomyces
pombe and no gene pairs are conserved among all species).
Nonetheless, this method allows us to distil the factors that
are consistently important across a long evolutionary time
period. The mean values of the determinants associated with
this set were compared to those obtained by randomly select-
ing a group of genes of the same size (this was obtained by
sampling from the full set of S. cerevisiae adjacent genes with
homologues, adjacent or not, in at least one comparator spe-
cies, 10,000 times). Adjacent pairs that have been retained as
such in the whole lineage exhibited higher co-expression
(0.0843 versus a random value of 0.0767, P < 0.05), smaller
intergene distance (344.52 bp versus a random spacer of
422.44, P < 0.0001), higher density of essential genes nearby
(0.25 versus a random density of 0.21, P = 0.0003), smaller
recombination rate (1.029 versus a random rate of 1.043, P <
0.05) and lower co-regulation (0.093 versus a random score
of 0.125, P < 0.01). These results thus support the view that
the importance of predictor variables is in the order: inter-
gene distance > local density of essential genes > co-regula-
tion > co-expression and recombination rate. The lineage
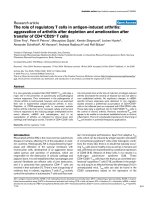
effect can be alternatively quantified by comparing the nomi-
nal values of the determinants of those genes remaining non-
adjacent in the least distant species to S. cerevisiae, C. gla-
brata, with those of the genes retained as adjacent in the most
distant species, A. gossypii. This corroborates the relevance
of co-expression, density of flanking essential genes and
intergene distance in the conservation of pairs in the lineage
(Figure 4).
Given that clusters of essential genes also have low recombi-
nation rates, we can, in addition, ask whether the retention of
synteny of those gene pairs in the middle of essential gene
clusters is due to the low recombination rate. In wheat, for
example, it is observed that chromosomal domains associated
with low recombination rates also have low re-arrangement
rates [25], potentially consistent with a model in which
recombination is associated with the generation of re-
arrangements. By contrast, recent simulations suggest that
selection to preserve essential genes in chromosomal
domains of low gene expression noise (open chromatin) will
result in low rates of disruption of gene order in essential gene
clusters, independent of any effect of recombination [16]. To
ask whether essential gene clusters are conserved owing to
their low recombination rates, we considered two subclasses:
those gene pairs with very few essential genes in their vicinity
(the 'low' group: N = 385) and those with many (the 'high'
group: N = 34). Next, within each group we ask about the
recombination rate of those pairs conserved in synteny across
all lineages and those not so. If recombination is an independ-
ent predictor, then in both the high and low groups the
recombination rate of those in conserved synteny should be
lower. For the 83 pairs in the low group conserved as a pair,
the recombination rate is slightly lower than that of the low
group as a whole (1.04 versus 1.06), but not significantly so (
P
= 0.5). In the high class, 10 of the 34 are retained in synteny.
These have, if anything, a slightly higher recombination rate
than the average for the high group (0.98 versus 0.95), but
again, not significantly so (P = 0.47). So, in sum, while clus-
ters of essential genes have low recombination rates, the
recombination rate does not in and of itself explain the con-
servation of synteny. This is not to say that what is reported in
wheat is wrong nor, indeed, more generally that recombina-
tion does not induce re-arrangements. The most important
problem in this analysis is that the recombination rate meas-
urements come from current laboratory yeasts while the syn-
teny conservation data spans events over hundreds of
millions of years. Problematically, recombination rates are
thought to evolve quite fast. To better resolve this issue it
might be better to compare telomeric (high recombination
rate) and centromeric (low recombination rates) domains,
rather than asking about conservation of gene pairs in
isolation.
Determinants of close non-adjacently conserved pairs versus distant adjacently conserved pairsFigure 4
Determinants of close non-adjacently conserved pairs versus distant
adjacently conserved pairs. The difference between the ratio of
determinant values of non-adjacently conserved genes in a close species to
S. cerevisiae (C. glabrata) and those adjacently conserved in a distant species
(A. gossypii) is plotted in red for each predictor (line between points to
help visualization). This ratio is defined as the quotient between the
corresponding values of the close (distant) pairs and those of the
adjacently conserved pairs in the close species, that is, C. glabrata. We also
plotted the null behavior obtained by random sampling of the combined
group, close and distant, preserving group size, 10,000 times (mean,
continuous blue line, ±2 standard deviations, dashed blue lines). Behavior
was qualitatively robust for the cex, igd, and let predictors when using S.
castelli and K. lactis as close/distant comparator (Additional data file 1).
Cex Igd Let Rec Cre
−0.1
−0.08
−0.06
−0.04
−0.02
0
0.02
0.04
Genome Biology 2007, Volume 8, Issue 11, Article R233 Poyatos and Hurst R233.9
Genome Biology 2007, 8:R233
Predictors of linkage conservation and reciprocal gene
loss
How would the conservation of synteny of a given pair of
neighboring genes be influenced by the processes associated
with the WGD event? We focus our attention on two possible
effects. First, linkage conservation might be influenced by the
fate of the pre-WGD adjacent pairs after the WGD event. We
could compare two opposite situations. Either both adjacent
pairs have lost the same (orthologue) copy of the
corresponding gene, or both remained duplicated in all three
post-WGD species. These are actually the most common fates
of ancestral loci in yeasts [23]. According to this, one could
imagine, for instance, that since a duplicate gene might con-
tribute to perform part of the function originally associated
with a single gene (sub-functionalization model), adjacent
genes with duplicates could experience less pressure to
remain linked, as part of the function is implemented by the
duplicate. We would predict then that adjacent pairs resolved
as single copy in all post-WGD species would more often be
found as adjacent in pre-WGD species. This is indeed what we
obtain. Single copy adjacent genes were more likely con-
served as adjacent in all pre-WGD species: K. waltii (
χ
2
=
5.83, P < 0.02, d.f. = 1); K. lactis (
χ
2
= 5.77, P < 0.02, d.f. = 1);
and A. gossypii (
χ
2
= 5.41, P = 0.02, d.f. = 1).
Alternatively, as deletion of one duplicate is the most com-
mon process after the WGD, linkage conservation could be
influenced by how this deletion is resolved in the different
post-WGD lineages. Divergent classes are those in which
some of the genes lost are paralogues in the three post-WGD
species, while convergent classes imply that all lost genes are
orthologues. This latter class implies a less random choice of
gene loss. We find that adjacent pairs both belonging to the
convergent class are more conserved than expected in four
out of five species: C. glabrata,
χ
2
= 4.18, P = 0.04; K. waltii,
χ
2
= 6.64, P = 0.01; K. lactis,
χ
2
= 9.56, P < 0.01; A. gossypii,
χ
2
= 6.81, P < 0.01; d.f. = 1 in all cases.
Conclusion
In asking about what factors determine gene order conserva-
tion, despite the dependence of the answer on the question,
one regularity appears. This is the finding that gene pairs cur-
rently with a short intergene spacer are less likely to have
been re-arranged. This fits with data from microsporidians in
which gene overlap is common and gene order rearrange-
ments are rare [26]. The null model, assuming nothing more
than an intolerance to inversions that cut within genes, pro-
vides a strikingly good fit for such a simple model. The model
was made deliberately simple by not assuming that gene ori-
entation would make a difference and takes no account of the
density of functional sites between genes. As noted above,
these are unrealistic assumptions. This indeed may explain in
part the conservation of gene pairs that are co-expressed, as
inversions could, for example, break bidirectional promoters
between genes in divergent orientation.
Beyond the role of the intergene spacer, further answers are
dependent on just how one asks the question. We can, for
example, ask whether gene pairs in a given class tend to be
more conserved than gene pairs not in the specified class. For
example, gene pairs that specify proteins close in either the
metabolic or protein interaction network do tend to be more
commonly conserved as neighbors than gene pairs that also
specify proteins that feature in the relevant network but are
not close in the network. By contrast, if we ask whether net-
work proximity is generally an important predictor of synteny
conservation, the answer is no, largely because most proteins
do not explicitly feature within the network. Second, when
asking about predictors of linkage conservation, the answer
depends on which species one is comparing. Close compara-
tors highlight co-regulation, whilst more distant comparators
suggest co-expression and maybe the recombination rate (as
measured in S. cerevisiae) as important predictors. Analysis
of the properties of the gene pairs preserved as a pair in all
species points to the density of flanking essential genes as an
important predictor, suggesting that essential gene clusters
tend to be frozen, as previously noted [15,18].
That the results are dependent on the species under compar-
ison perhaps reflects a difference in the strength of selection
to preserve a class of gene pairs and the commonality of such
pairs. Consider, for example, the possibility that the top 2% of
co-expressed gene pairs are under very strong selection to
remain linked. Would this be transparent in comparisons
between closely related species? The answer is probably not.
In our close comparators, approximately 90% of gene pairs
remain as immediate neighbors. If just the 2% most highly co-
expressed genes resist re-arrangement, there may not even
have been a single re-arrangement that might have occurred
between linked highly co-expressed genes that was rejected
by selection. Hence there would be no signal of co-expression
as an important factor in linkage conservation. As the dis-
tance between comparators increases, however, the resilience
of the 2% will start to appear as an ever stronger signal,
assuming the co-expression to be both ancestral and under
selection (in different ecologies different co-expression pro-
files might be under selection). In sum, strong but relatively
rare selection will be discernable only in distant comparators.
Put differently, the more distant comparisons and the analy-
sis of those pairs always conserved hones in on the special
subclass of genes for which selection acts to preserve the gene
order.
Perhaps then relatively little is to be learnt from relatively
close comparators as so few re-arrangements will have been
sampled. In this context, however, there exists one apparent
oddity. In the close species comparisons intergene distance
and co-regulation appear as important predictors. However,
against expectations, gene pairs with a high level of co-regu-
lation, that is, that share much of the same transcription fac-
tor-based regulation, are more, not less, likely to be broken
up. When analyzed in detail, however, we find that this strong
Genome Biology 2007, 8:R233
Genome Biology 2007, Volume 8, Issue 11, Article R233 Poyatos and Hurst R233.10
signal is associated with a low density of regulatory motifs:
very high co-regulation scores are disproportionately associ-
ated with gene pairs with only one (the same) transcriptional
motif, hence a low motif density. It is this low motif density
that most likely contributes to the lack of conservation of the
gene pairs in the short term.
Even if we assume that longer distance phylogenetic compar-
isons are best, the yeast analysis suggests that phylogenetic
distance alone is not the sole arbiter. Rather than the compa-
rator distance, the duplication event experienced in the line-
age seems also to be influencing the fate of adjacent pairs. The
potential relaxation of the functional constraints associated
with the pair members, because of either being duplicated or
being divergently conserved, is reflected in a smaller ten-
dency to remain as immediate neighbors.
The results presented here no doubt do not reflect the full
complexity of gene order evolution. For example, while we
expect that the absolute rate of gene order evolution should
scale monotonically with the amount of intergene spacer, this
model fails to make any sense of the much higher re-arrange-
ment rates seen in rodents than in primates [27], although the
low rate seen in chicken is consistent, the chicken genome
being relatively compact. We can also ask whether the other
forces we have identified might have any general applicabil-
ity? Prior reports have found that clusters of housekeeping
genes in mammalian genomes tend to have preserved synteny
[28] and that essential gene clusters in mice are also con-
served [29]. In these instances it will be informative to ask
about the relationship between the two parameters (there is a
broad overlap between essential genes and housekeeping
genes in mammals) and how intergene distance and recombi-
nation rate might interrelate. More generally, when more
whole genome dispensability data are available it will be
interesting to see if the preservation of essential clusters is a
common phenomenon and, in turn, ask about the underlying
rationale.
Materials and methods
Comparator species and genome data
We used data from the Yeast Gene Order Browser [22]. This
collection includes seven hemiascomycetes species, four of
them having diverged before the whole genome duplication
event occurred in the lineage. We considered only six for our
study, three pre-WGD, that is, A. gossypii, K. lactis and K.
waltii, and three post-WGD, that is, C. glabrata, S. castelli
and S. cerevisiae. To compute unambiguosly whether a given
syntenic pair in S. cerevisiae is conserved as syntenic in a
comparator species we analyzed only pairs from a subset of
genes termed ancestral loci. Each member of this set corre-
spond to a locus in a pre-WGD species, or the corresponding
duplicated pair of loci in the post-WGD species and has been
defined by homology and genome context information [23].
Metabolic network
We examined the metabolic relationship of a gene pair by
means of a metabolic network of S. cerevisiae recently recon-
structed using genomic, biochemical and physiological infor-
mation [30]. More specifically, we considered this network as
a graph whose nodes and edges are the metabolic genes and
the metabolic reactions, respectively [20], and quantified the
metabolic relationship of a pair by its shortest distance in the
network (graph has 851 nodes, and 294 of them are ancestral
loci). We computed how many syntenic pairs belonging to
this network (up to three intervening genes between them in
S. cerevisiae) are conserved as syntenic (non-syntenic) in C.
glabrata. We found 29 genes conserved in C. glabrata, 4 of
which are non-syntenic. The mean graph shortest distance of
those conserved (not conserved) as syntenic is = 3.58 ( =
5). This hints at metabolic network distance as a plausible
predictor of linkage conservation, that is, the closer in the
graph the more likely to be conserved as a linked pair corrob-
orating previous studies [9,20]. For the extended study with
all syntenic genes included, we assigned a null distance value
to those adjacent pairs without metabolic information. We set
this characteristic value to the network mean value ( =
3.83).
Co-expression and intergenic distance
To quantify gene co-expression, 40 different sets of genome-
wide transcription time series from ExpressDB were used as
compiled in [31]. In our analyses co-expression for a given
gene pair denotes then the mean of the 40 correlation coeffi-
cients of mRNA expression, corresponding to 40 different
experiments, for a given gene pair. All sequence information
was obtained from the Saccharomyces Genome Database
[32].
Density of lethals
We used a list of essential genes included in the Saccharomy-
ces Genome Database [32], which contains information on a
large-scale knockout study [33]. We introduced a score quan-
tifying the number of essential genes around a syntenic pair.
For each pair, the density of lethals reads as the mean number
of essential genes located at -3,-2,-1,pair1,pair2,1,2,3 gene
coordinates, that is, up to 4 genes in either the 5' to 3' or the
3' to 5' direction around each member of the pair.
Recombination rate
We considered the recombination data set obtained in [34],
an estimate of recombination rate, by using double strand
break analysis. To each gene we assigned a recombination
rate. For a syntenic pair we took the mean of each gene rate.
Co-regulation
We used a dataset of regulatory motifs determined in [35]. A
P value threshold of 0.001 was considered to select the tran-
scriptional factor binding sites. The co-regulation of a pair is
d d
d
Genome Biology 2007, Volume 8, Issue 11, Article R233 Poyatos and Hurst R233.11
Genome Biology 2007, 8:R233
denoted by the number of common regulatory motifs between
two genes [31]:
Here | | denotes the size of the set, ∩ the intersection and m
i
the number of regulatory motifs for gene i in the pair.
Protein-protein network
We used the high confidence data set of multi-validated pro-
tein interactions in S. cerevisiae [36] and quantified the pro-
tein-protein relationship of a pair by its shortest distance in
the network as before. Only 168 adjacent genes are included
in this graph (with 1088 nodes). We found 155 genes con-
served in S. castelli, 18 of which remained adjacent. The mean
graph shortest distance of those conserved (not conserved) as
adjacent is = 5.12 ( = 5.28). This hints at protein-protein
network distance as a plausible predictor of linkage
conservation, that is, the closer in the graph the more likely to
be conserved as a linked pair. For the extended study with all
adjacent genes included, we assigned a characteristic distance
value to those adjacent pairs without protein-protein interac-
tion information. We set this characteristic value to the net-
work mean value ( = 5.35).
Logistic regression
Logistic regression is a class of multivariate analyses usually
applied to describe the dependencies of binary responses with
respect to a set of variables [24]. While multiple regression
usually quantifies the influence of several factors on continu-
ous dependent variables, logistic regression extends these
techniques to the study of qualitative features. In our case, we
interpreted an adjacent pair in S. cerevisiae retained or not as
syntenic in a given comparator as such a binary, or discrete,
response to model. To estimate the relevance of each linkage
predictor in a robust way, given that genomic data are known
to be noisy and analysis of them might lead to very significant
but totally misleading results [37], we considered several
complementary strategies: simple (logistic) regression of
each of the variables; forward stepwise regression according
to the Akaike criterion (a measure of goodness of fit) [24], in
this case, predictors are included in the model only if they
increase the goodness of fit; multiple regression - here all pro-
posed variables are considered; and principal component
multiple regression (Additional data file 1). We scaled each of
the covariates to zero mean and unit variance (standardized
data) before carrying out the studies unless indicated. Corre-
lation between some of the determinants could be relevant,
for example, essential clusters having low recombination
rates. To quantify the correlation between independent vari-
ables, one can compute the correlation matrix of the parame-
ter estimates in the logistic equation. Large values of these
correlations indicate that multicollinearity may be complicat-
ing the modeling process. Alternatively, if correlations
between the estimates are fairly small, it is expected that
removing one variable from the model does not change the
coefficients and P values for other variables much.
Abbreviations
cex, gene co-expression; cre, gene co-regulation; igd, inter-
genic distance; let, density of lethals; met, metabolic relation-
ship; pro, distance in the protein-protein interaction
network; rec, recombination rate; WGD, whole genome
duplication.
Authors' contributions
JFP and LDH conceived and designed the study, analyzed the
data, and wrote the paper. LDH implemented the null mod-
els, JFP implemented the statistical models.
Additional data files
The following additional data are available with the online
version of this paper. Additional data file 1 is an extended dis-
cussion of the regression and null models corresponding to
several comparator species.
Additional data file 1Extended discussion of the regression and null models correspond-ing to several comparator speciesIncludes the extended discussion, a complementary figure related to the determinants of close non-adjacently conserved pairs versus distant adjacently conserved pairs, and a table summarizing the results of the principal component regression analysis.Click here for file
Acknowledgements
We thank Oscar Rueda, Andrés Cañada and Kevin Byrne for technical
assistance and valuable discussions. This research has been partially sup-
ported by the Spanish Ministerio de Educación y Ciencia Grant FIS2006-
10368 (JFP) and the UK Biotechnology and Biological Sciences Research
Council (LDH).
References
1. Cavalier-Smith T: Evolution of the eukaryotic genome. In The
Eukaryotic Genome: Organization and Regulation Edited by: Broda P,
Oliver S, Sims P. Cambridge: Cambridge University Press;
1993:333-385.
2. Maynard-Smith J: Evolutionary Genetics 2nd edition. Oxford: Oxford
University Press; 1998.
3. Hurst LD, Pál C, Lercher MJ: The evolutionary dynamics of
eukaryotic gene order. Nat Rev Genet 2004, 5:299-310.
4. Lercher MJ, Urrutia AO, Hurst LD: Clustering of housekeeping
genes provides a unified model of gene order in the human
genome. Nat Genet 2002, 31:180-183.
5. Lercher MJ, Urrutia AO, Pavlícek A, Hurst LD: A unification of
mosaic structures in the human genome. Hum Mol Genet 2003,
12:2411-2415.
6. Caron H, van Schaik B, van der Mee M, Baas F, Riggins G, van Sluis P,
Hermus MC, van Asperen R, Boon K, Voûte PA, et al.: The human
transcriptome map: clustering of highly expressed genes in
chromosomal domains. Science 2001, 291:1289-1292.
7. Versteeg R, van Schaik BD, van Batenburg MF, Roos M, Monajemi R,
Caron H, Bussemaker HJ, van Kampen AH: The human transcrip-
tome map reveals extremes in gene density, intron length,
GC content, and repeat pattern for domains of highly and
weakly expressed genes. Genome Res 2003, 13:1998-2004.
8. Cohen BA, Mitra RD, Hughes JD, Church GM: A computational
analysis of whole-genome expression data reveals chromo-
somal domains of gene expression. Nat Genet 2000, 26:183-186.
9. Lee JM, Sonnhammer EL: Genomic gene clustering analysis of
pathways in eukaryotes. Genome Res 2003, 13:875-882.
10. Wong S, Wolfe KH: Birth of a metabolic gene cluster in yeast
by adaptive gene relocation. Nat Genet 2005, 37:777-782.
11. Teichmann SA, Veitia RA: Genes encoding subunits of stable
O
mm
max m m
=
∩||
(| |,| |)
.
12
12
d d
d
Genome Biology 2007, 8:R233
Genome Biology 2007, Volume 8, Issue 11, Article R233 Poyatos and Hurst R233.12
complexes are clustered on the yeast chromosomes: an
interpretation from a dosage balance perspective. Genetics
2004, 167:2121-2125.
12. Poyatos JF, Hurst LD: Is optimal gene order impossible? Trends
Genet 2006, 22:420-423.
13. Képès F: Periodic epi-organization of the yeast genome
revealed by the distribution of promoter sites. J Mol Biol 2003,
329:859-865.
14. Lercher MJ, Hurst LD: Co-expressed yeast genes cluster over a
long range but are not regularly spaced. J Mol Biol 2006,
359:825-831.
15. Pál C, Hurst LD: Evidence for co-evolution of gene order and
recombination rate. Nat Genet 2003, 33:392-395.
16. Batada N, Hurst LD: Evolution of chromosome organization
driven by selection for reduced gene expression noise. Nat
Genet 2007, 39:945-949.
17. Hurst LD, Williams EJ, Pál C: Natural selection promotes the
conservation of linkage of co-expressed genes. Trends Genet
2002, 18:604-606.
18. Fischer G, Rocha EP, Brunet F, Vergassola M, Dujon B: Highly vari-
able rates of genome rearrangements between hemiasco-
mycetous yeast lineages. PLoS Genet 2006, 2:e32.
19. McLysaght A, Seoighe C, Wolfe K: High frequency of inversions
during eukaryote gene order evolution. In Comparative Genom-
ics Edited by: Sankoff D, Nadeau JH. Dordrecht: Kluwer Academic
Publishers; 2000:47-58.
20. Kharchenko P, Church GM, Vitkup D: Expression dynamics of a
cellular metabolic network. Mol Syst Biol 2005, 1:2005.0016.
2005.0016
21. Kruglyak S, Tang H: Regulation of adjacent yeast genes. Trends
Genet 2000,
16:109-111.
22. Byrne KP, Wolfe KH: Visualizing syntenic relationships among
the hemiascomycetes with the Yeast Gene Order Browser.
Nucleic Acids Res 2006:D452-455.
23. Scannell DR, Byrne KP, Gordon JL, Wong S, Wolfe KH: Multiple
rounds of speciation associated with reciprocal gene loss in
polyploid yeasts. Nature 2006, 440:341-345.
24. Agresti A: Categorical Data Analysis 2nd edition. New Jersey: John
Wiley and Sons; 2002.
25. Akhunov ED, Akhunova AR, Linkiewicz AM, Dubcovsky J, Hummel D,
Lazo G, Chao S, Anderson OD, David J, Qi L, et al.: Synteny pertur-
bations between wheat homoeologous chromosomes
caused by locus duplications and deletions correlate with
recombination rates. Proc Natl Acad Sci USA 2003,
100:10836-10841.
26. Slamovits CH, Fast NM, Law JS, Keeling PJ: Genome compaction
and stability in microsporidian intracellular parasites. Curr
Biol 2004, 14:891-896.
27. Bourque G, Zdobnov EM, Bork P, Pevzner PA, Tesler G: Compara-
tive architectures of mammalian and chicken genomes
reveal highly variable rates of genomic rearrangements
across different lineages. Genome Res 2005, 15:98-110.
28. Singer GA, Lloyd AT, Huminiecki LB, Wolfe KH: Clusters of co-
expressed genes in mammalian genomes are conserved by
natural selection. Mol Biol Evol 2005, 22:767-775.
29. Hentges KE, Pollock DD, Liu B, Justice MJ: Regional variation in
the density of essential genes in mice. PLoS Genet 2007, 3:e72.
30. Förster J, Famili I, Fu P, Palsson BO, Nielsen J: Genome-scale
reconstruction of the Saccharomyces cerevisiae metabolic
network. Genome Res 2003, 13:244-253.
31. Kafri R, Bar-Even A, Pilpel Y: Transcription control reprogram-
ming in genetic backup circuits. Nat Genet 2005, 37:295-299.
32. Ball CA, Jin H, Sherlock G, Weng S, Matese JC, Andrada R, Binkley G,
Dolinski K, Dwight SS, Harris MA, et al.: Saccharomyces Genome
Database provides tools to survey gene expression and func-
tional analysis data.
Nucleic Acids Res 2001, 29:80-81.
33. Winzeler EA, Shoemaker DD, Astromoff A, Liang H, Anderson K,
Andre B, Bangham R, Benito R, Boeke JD, Bussey H, et al.: Func-
tional characterization of the S. cerevisiae genome by gene
deletion and parallel analysis. Science 1999, 285:901-906.
34. Gerton JL, DeRisi J, Shroff R, Lichten M, Brown PO, Petes TD: Inau-
gural article: Global mapping of meiotic recombination
hotspots and coldspots in the yeast Saccharomyces cerevisiae.
Proc Natl Acad Sci USA 2000, 97:11383-11390.
35. Lee TI, Rinaldi NJ, Robert F, Odom DT, Bar-Joseph Z, Gerber GK,
Hannett NM, Harbison CT, Thompson CM, Simon I, et al.: Tran-
scriptional regulatory networks in Saccharomyces cerevisiae.
Science 2002, 298:799-804.
36. Batada NN, Reguly T, Breitkreutz A, Boucher L, Breitkreutz BJ, Hurst
LD, Tyers M: Stratus not altocumulus: A new view of the yeast
protein interaction network. PLoS Biol 2006, 4:e317.
37. Drummond DA, Raval A, Wilke CO: A single determinant dom-
inates the rate of yeast protein evolution. Mol Biol Evol 2006,
23:327-337.