Báo cáo y học: " PHOSIDA (phosphorylation site database): management, structural and evolutionary investigation, and prediction of phosphosites" ppsx
Bạn đang xem bản rút gọn của tài liệu. Xem và tải ngay bản đầy đủ của tài liệu tại đây (2.03 MB, 13 trang )
Genome Biology 2007, 8:R250
Open Access
2007Gnadet al.Volume 8, Issue 11, Article R250
Software
PHOSIDA (phosphorylation site database): management,
structural and evolutionary investigation, and prediction of
phosphosites
Florian Gnad, Shubin Ren, Juergen Cox, Jesper V Olsen, Boris Macek,
Mario Oroshi and Matthias Mann
Address: Department for Proteomics and Signal Transduction, Max-Planck Institute for Biochemistry, Am Klopferspitz, D-82152 Martinsried,
Germany.
Correspondence: Matthias Mann. Email:
© 2007 Gnad et al.; licensee BioMed Central Ltd.
This is an open access article distributed under the terms of the Creative Commons Attribution License ( which
permits unrestricted use, distribution, and reproduction in any medium, provided the original work is properly cited.
Phosphorylation site database<p>PHOSIDA, a phosphorylation site database, integrates thousands of phosphosites identified by proteomics in various species.</p>
Abstract
PHOSIDA , a phosphorylation site database, integrates thousands of high-
confidence in vivo phosphosites identified by mass spectrometry-based proteomics in various
species. For each phosphosite, PHOSIDA lists matching kinase motifs, predicted secondary
structures, conservation patterns, and its dynamic regulation upon stimulus. Using support vector
machines, PHOSIDA also predicts phosphosites.
Rationale
Protein phosphorylation is a ubiquitous and important post-
translational modification, responsible for modulating pro-
tein function, localization, interaction and stability [1-4].
High-throughput experimental studies such as our recent
large scale analysis of the human phosphoproteome by quan-
titative mass spectrometry, in which we measured the time
courses of more than 6,600 phosphorylation sites in response
to growth factor stimulation [5], enable us to study biological
systems from a global perspective. Those sites were identified
by high resolution mass spectrometry with an estimated false
positive rate of less than one percent and constitute an unbi-
ased, in-depth sampling of the in vivo phosphoproteome. In
addition, PHOSIDA includes large-scale phosphoproteomes
from various eukaryotic and prokaryotic organisms, such as
Bacillus subtilis [6] and Escherichia coli, providing informa-
tion about the evolution of phosphorylation events in the cell.
We developed PHOSIDA to retrieve and analyze phos-
phosites from large-scale and high-confidence quantitative
phosphoproteomics experiments, usually studying the
response of biological systems to various stimuli by the inte-
gration of time course data. Thus, it is the first phosphosite
database to explicitly store quantitative data on the relative
level of phosphorylation. PHOSIDA also matches kinase
motifs to phosphosites. A challenge in mass spectrometry-
based phosphosite mapping is the fact that phosphopeptides
are measured, which then need to be mapped to one or more
corresponding protein sequences. This problem is addressed
in PHOSIDA by a many-to-many mapping between phos-
phopeptide sequences and protein entries in the sequence
database. One of the fundamental strengths of PHOSIDA lies
in the high quality of the in vivo data contained in the data-
base and in the very large size of its in vivo data sets.
Published: 26 November 2007
Genome Biology 2007, 8:R250 (doi:10.1186/gb-2007-8-11-r250)
Received: 29 June 2007
Revised: 8 August 2007
Accepted: 26 November 2007
The electronic version of this article is the complete one and can be
found online at />Genome Biology 2007, 8:R250
Genome Biology 2007, Volume 8, Issue 11, Article R250 Gnad et al. R250.2
In this paper we describe the features and capabilities of
PHOSIDA. We also use the analysis tools in PHOSIDA to
investigate the structure and evolution of the phosphopro-
teome from a global point of view. Recent studies have found
support for the hypothesis that protein phosphorylation
occurs predominantly within regions without regular struc-
ture [7,8]. This was also the conclusion of a recent paper
describing MitoCheck (mtcPTM) [9], a recently established
database containing phosphorylation sites of human and
mouse. These authors used known structures and homology
modeling to determine the structural constraints of phospho-
rylation sites. Here we investigate and quantify this observa-
tion on a very large in vivo dataset. The resulting secondary
structure and accessibility information for each phosphosite
is available in PHOSIDA.
Although conservation of specific sites is often taken to imply
biological importance, relatively little is known about the evo-
lutionary constraints on the phosphoproteome. We investi-
gated these constraints on three levels: conservation of
phosphoproteins, regions surrounding the site and the phos-
phosite itself. Consequently, PHOSIDA provides the evolu-
tionary conservation of each phosphosite at these three levels.
In addition, we took advantage of the large number of in vivo
phosphosites to create a phosphosite predictor in PHOSIDA.
There have been various machine learning approaches to pre-
dict phosphorylation sites. For example, the prediction sys-
tem Netphos [10] is based on neural networks, whereas
Scansite uses a profile method to predict phosphorylation
events [11]. We use our large-scale studies to construct a
phosphorylation site predictor on the basis of a support vec-
tor machine (see [12] for an introduction). Support vector
machines (SVMs) have been applied to a large variety of fields
ranging from internet fraud to topics in molecular biology,
such as classification of gene expression profiles, and there
has already been one study that applied SVM techniques to
predict phosphorylation sites [13]. However, that approach
was exclusively based on the primary sequences of around
1,000 phosphorylation sites. Here we construct a predictor
based on more than 5,000 high confidence phosphosites. We
also show that information about the structure and conserva-
tion of phosphorylation sites slightly increases the perform-
ance of the predictor.
Furthermore, PHOSIDA can search for motifs of interest in
any input sequence. These motifs can be user generated or
drawn from already annotated kinase motifs.
Database management of phosphorylation sites
As mentioned above, PHOSIDA was first developed to facili-
tate retrieval and analysis of high-confidence phospho-data-
sets generated in our group. For example, PHOSIDA contains
a large number of phosphorylation sites from human cell
lines exposed to growth factor stimulation. Protein assign-
ments are based on the IPI database [14], which is cross-ref-
erenced with the Swissprot database by PHOSIDA. Entries of
both databases that correspond to the same proteins were
aligned to derive the exact positions of protein features such
as domains, active sites, motifs, and binding sites. Already
annotated phosphosites derived from Swissprot are trans-
ferred to the IPI sequences in the same way. The aligned
regions can be visualized via 'check alignment' buttons. Phos-
phoproteome data generated by the community will be regu-
larly imported into PHOSIDA in this way rather than by
individual import of specific projects. PHOSIDA will be
updated with sites identified according to Swissprot every 6
months at the least or as soon as substantial new large-scale
studies on phosphorylation are included in Swissprot. In the
case of prokaryotic phosphorylation sites, the protein assign-
ment was exclusively based on the TIGR database.
For each protein, the user is presented with general features
such as isoelectric point (pI), molecular weight, sequence,
and description at the protein level in addition to all phospho-
rylation sites that have been identified in our laboratory and
those that are extracted from Swissprot. Mass spectrometry
identifies phosphopeptides by matching fragmentation spec-
tra to databases and we require 99% confidence for peptide
identification to list peptides in PHOSIDA. However, localiza-
tion of phosphosites within the identified phosphorylated
peptides is sometimes ambiguous. We developed a probabil-
ity score ('localization score') that reflects the chance of each
potential phosphorylation site within the peptide to be phos-
phorylated given its fragmentation spectrum [5]. If the local-
ization probability is lower than 0.995, it is enclosed in round
brackets. When users click on any of the displayed phos-
phosites, the surrounding sequence and matching kinase
motifs are shown (Figure 1). Often, several phosphopeptides
covering the same phosphosite are measured by mass spec-
trometry. These peptides are also listed along with their local-
ization probabilities, Mascot scores, and MSQuant scores for
each instance. In many cases, for example, the growth factor
treatment mentioned above, PHOSIDA contains quantitative
and time-resolved data for the relative abundance of each
phosphopeptide. Figure 1 shows how the corresponding
ratios or clustered time courses are represented. These data
are listed separately for peptides as a function of their
sequences, degrees of phosphorylation, and further catego-
ries, such as experimental design or fraction. When moving
the mouse over the 'occurrences' button, protein entries shar-
ing the same phosphopeptide of interest are listed along with
the number of unique peptides that have been measured in
one experimental assay. Each peptide is color coded accord-
ing to the protein assignment: if the peptide sequence is
marked in green, the selected protein has the maximum
number of peptides in comparison to all other proteins that
contain the same peptide. If the protein assignment is ambig-
uous because of another protein with the same number of
identified peptides, the peptide is highlighted in blue. Red
indicates that other proteins exceed the number of detected
Genome Biology 2007, Volume 8, Issue 11, Article R250 Gnad et al. R250.3
Genome Biology 2007, 8:R250
peptides in comparison to the selected phosphoprotein. Each
feature of PHOSIDA is explained in the help menu, which is
accessible via the 'background' menu or via clicking on the
'question mark' button at the page of interest.
Structural investigation of the
phosphoproteome
Previous studies have already shown that phosphorylation
sites are mainly located in parts of proteins without regular
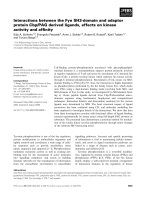
PHOSIDA: phosphorylation site informationFigure 1
PHOSIDA: phosphorylation site information. For each detected phosphorylation site, the position within the protein sequence along with its surrounding
region, maximum assignment localization value, matching kinase motifs, and accessibility is shown. In addition, all detected phosphopeptides that contain
the selected phosphosite are displayed along with their corresponding database identification scores, ratios after stimulus, fractions, and occurrences in
other proteins.
Genome Biology 2007, 8:R250
Genome Biology 2007, Volume 8, Issue 11, Article R250 Gnad et al. R250.4
structure [7,8]. To verify this observation on the basis of our
large-scale studies and to enable users to investigate the
structural context of each phosphorylation site of interest, we
performed large-scale solvent accessibility calculation as well
as secondary structure prediction employing the SABLE 2.0
program [15]. As shown in Figure 1, the structural attributes
of each phosphorylation site are visualized in PHOSIDA. To
determine the overall accessibility at the protein level, we
compared 1,044 human phosphoproteins that had an exact
match in Swissprot with a set of 998 human random proteins
from Swissprot. This was done to avoid bias due to redundant
entries in IPI. We find that phosphoproteins as a group have
significantly higher accessibilities than a set of randomly
selected proteins (t-test, σ = 0; Additional data file 1). This
means that all residues that occur in phosphoproteins show a
higher accessibility on average than all residues in non-phos-
phorylated proteins. Phosphoproteins, on average, are longer
than the average of the database; thus, this effect is not caused
by a smaller surface to volume ratio. A global analysis on the
human set, which contains 5,849 sites for which the localiza-
tion was unambiguous (class I sites), showed that the accessi-
bilities of phosphoserine (pS: t-test, σ
t
= 2 × 10
-111
; Mann-
Whitney test, σ
MW
= 4 × 10
-103
), phosphothreonine (pT: σ
t
= 1
× 10
-21
, σ
MW
= 3 × 10
-21
), and phosphotyrosine (pY: σ
t
= 1 × 10
-
4
, σ
MW
= 3 × 10
-4
) are significantly higher than non-phospho-
rylated serines, threonines or tyrosines (Figure 2). Non-phos-
phorylated residues were taken from phosphoproteins. Thus,
accessibility of phosphoresidues does not only follow from
the hydrophilicity of the amino acid but appears to be a req-
uisite for efficient phosphorylation. This finding also corre-
lates with the much higher frequency of pS and pT (80% and
18%, respectively) compared to pY (2%) [5]. Tyrosine is more
hydrophobic than serine and threonine and, therefore, tends
to be located in less accessible parts of the protein.
The high accessibility of phosphorylation sites suggests that
they are largely localized in hinges and loops, since these
structural elements are at the protein surface. In fact, this is
the case to a striking degree for pS (93.0%) as well as for pT
(88.5%). pY (67.3%) is also predominantly found in these
regions. Again, this pattern is not caused by the residues'
hydrophobicities alone as phosphoresidues have a signifi-
cantly higher tendency to be located in these regions (χ
2
test:
p = 0 (pS), p = 0 (pT), p = 5 × 10
-6
(pY); Figure 3). It is well
known that loop regions frequently participate in forming
binding sites and active sites of enzymes, making them excel-
lent substrates for regulation.
We next wanted to confirm the generality of this observation
for phosphoproteins with a solved structure and determined
proteins from our human phosphoset that had a structure in
the Protein Data Bank [16] and mapped our in vivo phospho-
rylation sites to their three-dimensional coordinates.
Secondary structures were assigned by DSSP [17]. DSSP is a
program that assigns secondary structures to given three-
dimensional coordinates of atoms of proteins. In total, we
assigned 26 phosphogroups to 16 structures of different pro-
teins (Additional data file 2). As is apparent from the
structures, the phosphogroups are always located in highly
accessible parts of the proteins. Furthermore, in all but one
case the phosphogroups are found in flexible parts of the
structure (hinges or loops). In 12 cases the structure around
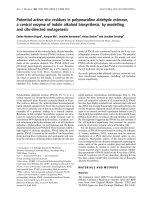
Accessibilities of phosphorylation sites as calculated by SABLEFigure 2
Accessibilities of phosphorylation sites as calculated by SABLE. The
relative accessibility prediction assigns a value between 0 (fully buried) and
9 (fully exposed) to each residue. For phosphoserines, phosphothreonines
and phosphotyrosines, accessibility is significantly higher than for their
non-phosphorylated counterparts in the same proteins.
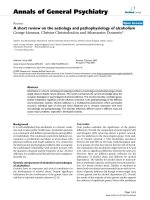
Proportion of phosphorylation sites located in loops and hinges as determined by SABLEFigure 3
Proportion of phosphorylation sites located in loops and hinges as
determined by SABLE. In each case, phosphosites are significantly more
frequently located in flexible regions.
Genome Biology 2007, Volume 8, Issue 11, Article R250 Gnad et al. R250.5
Genome Biology 2007, 8:R250
the phosphosite was so flexible that it had not been deter-
mined at all (Additional data file 3).
Evolutionary conservation of the
phosphoproteome
We next wished to integrate another dimension of biological
information of the phosphoproteome into PHOSIDA, namely
its evolutionary conservation. We determined homologous
proteins to all phosphoproteins across 70 species from E. coli
to mouse via BLASTP [18]. The homology search was per-
formed against protein databases of 53 bacteria, nine
archaea, and eight eukaryotes. These databases were
retrieved from Swissprot [19] in the case of Archaea and Bac-
teria. The yeast proteome was downloaded from SGD [20],
Drosophila melanogaster from FlyBase [21] and the other
eukaryotic sequences from IPI. We defined proteins to be
homologous when the resulting E-values were lower than 10
-
5
. For homologous proteins, we used a bidirectional BLASTP
approach to distinguish between paralogs and orthologs [22].
PHOSIDA displays the results of the homology searches using
an approximate phylogeny of all investigated species. Taxo-
nomic divisions are displayed on-screen when the cursor is
pointed at the phylogenetic tree. If the selected phosphopro-
tein is not homologous to any protein of a certain organism,
that organism is highlighted in red. If the similarity between
the sequence of the phosphoprotein and its homologous pro-
tein was the significantly best one in both directions, the
given organism is highlighted in green. A higher similarity
between the sequence of the homologous protein and another
protein of the organism of the selected phosphoprotein sug-
gests paralogy, which is indicated in blue.
We explored the conservation of the identified human phos-
phoproteome using the dataset of more than 2,200 phospho-
proteins from [5]. We investigated phosphoproteins that had
an exact sequence match in the Swissprot database (version
48.0). This resulted in a set of 1,044 human phosphoproteins.
As shown in Figure 4, phosphorylated proteins have a higher
proportion of two-directionally conserved interspecific
homologs (χ
2
test, p = 0) in comparison to the entire human
proteome (complete human Swissprot database), presumably
reflecting conserved regulatory functions. For example, in the
case of Danio rerio alignments, we observed that 62.78% of
all human proteins had orthologs in comparison to 84.11% of
the phospho set.
Additionally, we created global alignments between each
phosphoprotein and its corresponding interspecific homolog
via the Needleman-Wunsch algorithm [23,24]. Since the
length of alignments presents a further criterion for hom-
ology besides bi-directional significance via BLAST, users are
able to check the global alignments along with the propor-
tions of identities and to estimate the degree of homology by
themselves. If users click on any green or blue 'species but-
ton', the corresponding global alignment appears at the bot-
tom of the page (Figure 5).
With global alignments in hand, PHOSIDA directly tests
phosphosite and kinase motif conservation. In the evolution-
ary section of PHOSIDA, all phosphorylation sites that have
been measured in our laboratory are listed on the right side.
If users click on a phosphorylation site of interest, the conser-
vation status of the selected phosphorylation site is indicated
in red or green (Figure 6). Green points to conservation. For
conserved phosphosites, the alignment of the surrounding
sequence is displayed. Very seldom, sections of the align-
ments cause gaps in the sequence of the selected short region
of the phosphoprotein; in this case these gaps are not dis-
played. With alignments between the phosphorylation site of
interest and protein sequences from 70 organisms, PHOSIDA
enables users to check the conservation of each site of each
protein of interest. Furthermore, the conservation of match-
ing motifs can immediately be checked as shown in Figure 6.
This enables the user to distinguish conserved motifs around
the phosphosite from other motifs that also match the phos-
phosite but are not conserved and may thus be less likely to be
functionally important or have appeared only recently in
evolution.
On the basis of these global alignments for orthologous phos-
phoproteins, we found that regions containing phosphoryla-
tion sites showed lower conservation than the average
conservation of the entire protein. As seen in Additional data
file 4, the average identity in the 40 amino acid window
surrounding the aligned phosphorylation sites is lower for
Proportions of phosphoproteins with orthologsFigure 4
Proportions of phosphoproteins with orthologs. To examine the
conservation of phosphoproteins in comparison to the entire human
proteome, we aligned two-directionally against the protein sequences of
Saccharomyces cerevisiae, D. melanogaster, D. rerio, Gallus gallus, Bos bovis,
Rattus norvegicus and Mus musculus via BLASTP. Phosphoproteins (red)
have a much higher likelihood to have an ortholog than the entire set of
human proteins from SwissProt (blue).
Genome Biology 2007, 8:R250
Genome Biology 2007, Volume 8, Issue 11, Article R250 Gnad et al. R250.6
each eukaryotic species compared to the entire protein iden-
tity. This effect is most pronounced for serine and threonine
due to their almost exclusive location in fast evolving loop and
hinge regions.
These data suggest that the surrounding sequence regions
may diverge to such an extent that the structural effect (fast
sequence evolution) could compete with the constraining
pressure of function (slow sequence evolution). In order to
PHOSIDA: evolutionary sectionFigure 5
PHOSIDA: evolutionary section. The phylogeny in 70 species is illustrated for each phosphoprotein. The degree of homology is indicated by colors. Red
means that the selected phosphoprotein does not show any significant sequence similarity. Blue means that the sequence of the phosphoprotein is
significantly similar to a protein of another organism, but only one-directionally according to BLASTP. Green means that the phosphoprotein is probably
orthologous to a protein of the chosen organism, since its sequence is significantly similar to the homologous protein in both directions. To enable users
to set more stringent criteria for homology relating to the identities of aligned sequences and to check the entire sequence similarity, the global alignments
of homologous proteins are also provided.
Genome Biology 2007, Volume 8, Issue 11, Article R250 Gnad et al. R250.7
Genome Biology 2007, 8:R250
PHOSIDA: evolutionary sectionFigure 6
PHOSIDA: evolutionary section. The conservation status of phosphorylation sites within global alignments of homologous proteins is indicated in green or
red. Green means that the chosen phosphorylation is conserved. Furthermore, the surrounding aligned sequence is also displayed, to check the
conservation of matching kinase motifs.
Genome Biology 2007, 8:R250
Genome Biology 2007, Volume 8, Issue 11, Article R250 Gnad et al. R250.8
correctly assess the degree of conservation of phosphosites, it
is therefore important to take the structural effect - fast
evolution of loop regions - into account. We did this by choos-
ing only sites located in loop regions for the comparison set,
which should isolate the functional, evolutionary constraints
on the phosphosite itself.
The overall conservation of phosphorylation sites in ortholo-
gous eukaryotic proteins, based on the Needlemann-Wunsch
alignments, is shown in Figures 7, 8, 9, 10. The average amino
acid identity for all phosphoproteins with orthologs ranges
from greater than 80% in mammals to about 25% in yeast
(Figure 7). Figure 8 compares the conservation of phospho-
serines that occur in loops with all non-phosphoserines that
occur in loops in the same proteins. In all vertebrates, phos-
phoserine is significantly more conserved than serine (p = 0).
In Drosophila the effect is still observable, but is not signifi-
cant (p = 0.33). In yeast this is not the case. However, because
the sequence identity is already relatively high, the absolute
values of phosphoserine conservation are not much higher
than those of other serines. For example, compared to mice,
87.77 % of the phosphosites are conserved in orthologous
proteins, but 81.16% of all serines in loop regions of phospho-
proteins are also conserved. Threonine yields a similar result
to serine, but this amino acid is generally less conserved than
serine (Figure 9). Tyrosine tends to occur in more conserved
regions of the protein as mentioned above. Therefore, conser-
vation of all tyrosines in mouse is very high at 89.3% (Figure
10). However, the higher conservation of phosphorylated
tyrosines is still evident, but is not significant due to their low
number.
Percentage sequence identity of phosphoproteins with orthologsFigure 7
Percentage sequence identity of phosphoproteins with orthologs.
Conservation of phosphoserines (red) compared to non-phosphoserines (blue) in phosphoproteinsFigure 8
Conservation of phosphoserines (red) compared to non-phosphoserines
(blue) in phosphoproteins. Phosphoserines are significantly more
conserved except in yeast.
Conservation of phosphothreonines (red) compared to non-phosphothreonines (blue)Figure 9
Conservation of phosphothreonines (red) compared to non-
phosphothreonines (blue). Phosphothreonines are significantly more
conserved within mammals.
Conservation of phosphotyrosines (red) compared to non-phosphotyrosines (blue)Figure 10
Conservation of phosphotyrosines (red) compared to non-
phosphotyrosines (blue). Tyrosine is very highly conserved in mammals in
both forms. In more distantly related species the numbers are small and
differences are not statistically significant.
Genome Biology 2007, Volume 8, Issue 11, Article R250 Gnad et al. R250.9
Genome Biology 2007, 8:R250
What do these findings mean for the conservation of phos-
phorylation motifs? We plotted the conservation of amino
acids amino- and carboxy-terminal to the phosphorylation
site for the three phosphorylation sites and for all species. As
a typical example, Figure 11 shows the case of serine and
threonine in zebrafish (D. rerio). The figure reveals a sym-
metric region immediately adjacent to the phosphosite, in
which conservation is higher than in the surrounding region.
The length of this region is about -5 to +5 amino acids for both
serine and threonine and agrees well with the size of pub-
lished phosphorylation motifs. Thus, in the evolutionary sec-
tion of PHOSIDA, the surrounding region of -6 to +6 amino
Conservation of phosphorylation motifsFigure 11
Conservation of phosphorylation motifs. Bars represent the proportion of identical residues in zebrafish orthologs of human phosphoproteins. The red
line is the average identity in the region -20 to +20 amino acids surrounding the phosphosite. For both (a) serine and (b) threonine, about five amino acids
in each direction show elevated sequence identity.
Genome Biology 2007, 8:R250
Genome Biology 2007, Volume 8, Issue 11, Article R250 Gnad et al. R250.10
acids is shown, in order to check the conservation of matching
motifs. For phosphotyrosine the picture was less clear, per-
haps because of the limited number of sites in the data set.
Prediction of phosphorylation sites using
support vector machines
We then used the results of this large-scale study to construct
a phosphorylation site predictor on the basis of a SVM. As
shown above, phosphoserines, phosphothreonines and
phosphotyrosines show the same general patterns relating to
protein structure and conservation, but each to a different
extent. Therefore, we applied the machine learning approach
separately to the 4,731 pS, 664 pT and 107 pY sites. To create
a negative set of the same size, we randomly chose sites from
human proteins that were not present in the phosphoset. The
positive and negative datasets were split into a training set
(90%) and a test set (10%). SVMs attempt to partition true
from false sites by separating them in a high dimensional vec-
tor space with the help of hyperplanes and kernel functions. A
few sites out of the negative set may turn out to be phosphor-
ylation sites in future experiments. This problem was
addressed by optimizing the 'C parameter' of the SVM, which
controls the softness of the margin. We optimized the param-
eters C and σ by varying them from 2
-10
to 2
10
in multiplicative
steps of two and chose the best combination of both parame-
ters out of the 21 × 21 possibilities. The optimization was
based on a five-fold cross validation on the training set. To
determine the importance of each feature in the accuracy of
phosphosite prediction, we created various sets, which con-
tain different information for each phosphosite (Figure 12):
set a, the primary sequence comprising the site and its 12 sur-
Feature transformation of phosphorylation sites for in silico predictionFigure 12
Feature transformation of phosphorylation sites for in silico prediction. The surrounding sequence of a phosphorylation site comprises 260 dimensions.
Each dimension is defined by the position within the surrounding region and the amino acid type. The possible values in each dimension are 0 and 1. (a)
Primary sequence (b) Extends set a by three dimensions, which include information about the predicted secondary structure of the phosphorylation site.
(c) Extends set b by one dimension that contains the predicted accessibility. (d) Extends set a by three dimensions that reflect the conservation of the
phosphosite in mammals and seven additional dimensions that describe the protein conservation in yeast, fly, zebrafish, chicken, cow, rat and mouse. (e)
Combines set c and set d.
Genome Biology 2007, Volume 8, Issue 11, Article R250 Gnad et al. R250.11
Genome Biology 2007, 8:R250
rounding residues; set b, the surrounding primary sequence
and the predicted secondary structure of the site; set c, the
surrounding primary sequence and the predicted accessibility
in addition to the secondary structure of the site; set d, the
surrounding primary sequence, the conservation of the phos-
phosite in mammals and the protein conservation in yeast,
fly, zebrafish, chicken, cow, rat and mouse; and set e, the sur-
rounding primary sequence, the accessibility of the phos-
phosite and secondary structure as well as its conservation in
mammals, and the protein conservation. This resulted in 260
to 274 dimensions that represent the features of each
phosphosite.
We investigated several common kernel functions and found
that the radial basis function (RBF) turned out to be the most
powerful compared to linear, polynomial and sigmoid Kernel
functions. We optimized parameters C and σ, the width of the
Gaussians used as the RBFs, and trained the optimal model
for each set of each phosphor amino acid separately (Addi-
tional data file 5).
We found that the accuracy of the prediction based on the pri-
mary sequence was already very high: in the case of phospho-
serines, 89.85% were predicted correctly in the test set as
were 74.24% of the phosphothreonines (Additional data file
6). The accuracy of the prediction increased to 90.17% for pS
and 77.27% for pT by adding structural information (sets b
and c). For serines, the accessibility was slightly more impor-
tant than the secondary structure information, whereas for
threonines, the opposite was the case. The additional dimen-
sions reflecting the conservation of the site and of the entire
protein (set d) increased the accuracy to 90.70% (pS) and
81.06% (pT). By combining structural and evolutionary infor-
mation (set e), we found that 91.75% in the serine set and
81.06% in the threonine set were predicted correctly. The
accuracy of the prediction of phosphotyrosines increased
from 66.67% to 76.19% when including the structural and
conservational information. However, that increase is not
significant due to the fact that there were only around 100
phosphotyrosines sites.
The recall reflects the proportion of true positives to the sum
of true positives and false negatives, whereas the precision
describes the number of true positives out of all predicted
positives. As outlined in Figure 13, the precision-recall curve
of set e is slightly better than that of set a, indicating that the
inclusion of evolutionary and structural information
increased the recall and precision of the prediction to a minor
degree.
PHOSIDA includes the prediction of phosphorylated serines
and threonines on any input sequence on the basis of the
SVM, which was trained on the basis of raw sequences. Users
can set a certain cutoff directly on the precision-recall-curve
for the prediction. Sites that are predicted to be phosphor-
ylated are automatically matched to annotated kinase motifs.
In addition to the prediction, we also integrated a simple tool
that searches for matching kinase motifs on any sequence of
interest. Alternatively, users can define their own motif and
derive matching sites of the given sequence.
Outlook and conclusion
The concept of a phosphorylation site database is, of course,
not a novel one. PhosphoSite [25] and Phospho.ELM [26] are
already comprehensive databases that contain phosphoryla-
tion sites from different projects. The aim of PHOSIDA is to
include very high quality input data as well as quantitative
information such as regulation after stimuli. Additionally, we
take into account structures and evolutionary data across a
variety of species, in order to integrate biological context into
the database and to quantify constraints of phosphorylation
on a proteome-wide scale. Thus, PHOSIDA provides a rich
environment to the biologist wishing to analyze phosphoryla-
tion events of proteins of interest.
Our analysis of a large and unbiased set of in vivo phosphor-
ylation sites in human cells shows that phosphorylation
events are not distributed along the whole protein structure
but are instead constrained to sites of high accessibility and
structural flexibility. Particularly in the case of serine and
threonine, phosphorylation is almost completely restricted to
loops and hinges. Tyrosine is found to some degree in regular
secondary structure elements but phosphotyrosines are very
likely to be in flexible regions as well. Mechanistically, locali-
zation of phosphorylation in flexible regions of the protein is
advantageous as it provides access for the kinase to substrate,
which needs to be positioned into the active site. Further-
more, functional consequences of the phosphorylation in
many cases also depend on the flexibility of the phosphor-
ylated sequence, such as when loops are repositioned after
Precision-recall curve for phosphoserinesFigure 13
Precision-recall curve for phosphoserines. The two lines present the
tradeoff between false positives and false negatives without (blue) and with
(green) inclusion of structural and evolutionary constraints.
Genome Biology 2007, 8:R250
Genome Biology 2007, Volume 8, Issue 11, Article R250 Gnad et al. R250.12
phosphorylation or when the phosphorylated loop
participates in a protein-protein interaction. However, it is
important to emphasize that the structural analysis was based
on predictive methods rather than experimental data. Never-
theless, it stands to reason that the large size of the dataset
should compensate for statistical errors caused by the predic-
tion algorithm. Furthermore, as mentioned above, the
Mitocheck database (mtcPTM) [9] also came to similar con-
clusions relating to structural constraints of phosphosites.
This is gratifying because those authors used a different set of
phosphorylation sites (gathered in the European Union con-
sortium MitoCheck) and different methods to determine
preferential phosphorylation on different secondary
structure elements (homology modeling). The authors also
noted that phosphorylation sites can accumulate at the flanks
of structured domains and, in some cases, on buried residues.
Interestingly, phosphorylation of these sites could destabilize
part of the protein structure and, for example, allow or disal-
low protein-protein interactions [9].
The concordant results on structural constraints of phospho-
rylation sites between the MitoCheck study and this study
also implicitly validate our use of the SABLE prediction tool
for secondary structure and solvent accessibility prediction in
this context. Here we have used these predictions to extend
the feature space used in phosphorylation site prediction.
The analysis of the evolutionary sections of PHOSIDA shows
that the number of orthologs of the human phosphoproteome
is much higher than that of the entire human proteome, at
least when analyzing the phosphoproteins identified by Olsen
et al. [5]. This probably reflects important and conserved
functional roles of proteins with this post-translational mod-
ification. As a consequence of the location of phosphorylation
sites in loops and hinges, the sequence regions around
phosphorylation sites evolve faster than the rest of the pro-
tein. Practically, this leads to difficulties in correctly aligning
phosphosites in orthologous proteins, which can be overcome
by using a combination of fast, word-based algorithms
(BLASTP) to find candidates and exhaustive algorithms to
properly align phosphorylation sites (Needle).
Our analysis on the global alignments of orthologs in eukary-
otes shows that phosphorylation sites are more conserved
than non-phosphosites of the same proteins. However, for
any given site the sequence identity is already very high, for
example, more than 70% for serine and threonine in mam-
mals. For tyrosine, conservation is even higher. Therefore,
the mere conservation of a phosphorylation site in mammals
or in vertebrates does not necessarily indicate high selection
pressure. We found that a region of about five amino acids
around the phosphorylation site is more conserved than the
surrounding sequence context.
Furthermore, we integrated a tool that matches input
sequences with annotated kinase motifs or motifs that are
defined by users. In addition, we constructed a SVM-based
prediction algorithm for phosphorylation. Training of the
SVM on our large-scale dataset led to excellent prediction
accuracy. We also showed that the inclusion of structural and
evolutionary constraints on the phosphoproteome could
slightly increase the performance of the predictor.
The PHOSIDA phosphorylation site predictor makes it possi-
ble to find putative novel phosphorylation sites that have not
(yet) been experimentally identified. While experimental
data, especially quantitative data, are the 'gold standard', pre-
dicting novel phosphosites and matching kinase motifs on
proteins of interest should be valuable for the design of bio-
logical experiments or for predicting a protein's role in a path-
way [27]. Furthermore, once predictors are trained, these
prediction methods are basically 'free'. We provide an inter-
active method for setting a desired level of precision and
recall. For example, for mutagenesis experiments one may
want to set the precision very high, and for rationalizing the
function of a protein in a pathway one may want to set it rel-
atively low. Thus, in the absence of experimental data, the
prediction of novel phosphosites can be taken as the first
method of an experimental design uncovering functionality of
any protein of interest and elucidating its involvement in cer-
tain signaling cascades.
The integration process and analysis pipeline have been auto-
mated, so that structural and conservation data for phospho-
rylation sites from prospective studies can readily be
incorporated into PHOSIDA. As new phosphorylation data
are integrated to PHOSIDA our SVM will also be updated,
leading to increasingly accurate predictions.
Upcoming projects will investigate the phosphoproteomes of
prokaryotes, such as E. coli and Lactococcus lactis, and the
dynamics of phosphorylation after various stimuli in B. subti-
lis and in eukaryotes such as D. melanogaster, mouse, and
human.
Abbreviations
pS, phosphoserine; pT, phosphothreonine; pY, phosphotyro-
sine; RBF, radial basis function; SVM, support vector
machine.
Authors' contributions
FG designed and implemented Phosida, performed the anal-
yses and interpreted the bioinformatic findings. SR imple-
mented the support vector machine, JC helped in the design
of the support vector machine, JVO and BM contributed to
the interpretation of the experimental phosphorylation
results, MO contributed to the implementation of Phosida
and MM supervised the project and helped write the manu-
script. All authors read and approved the final manuscript.
Genome Biology 2007, Volume 8, Issue 11, Article R250 Gnad et al. R250.13
Genome Biology 2007, 8:R250
Additional data files
The following additional data are available with the online
version of the paper. Additional data file 1 is a figure showing
the accessibilities of phosphorylation sites as calculated by
SABLE. Additional data file 2 is a figure showing Protein Data
Bank structures of phosphoproteins. Additional data file 3 is
a table listing phosphorylation sites located in parts of phos-
phoproteins that are too flexible for structure determination.
Additional data file 4 is a figure that illustrates the conserva-
tion of the region surrounding the phosphosite (-20 to +20
amino acids). Additional data file 5 is a table listing the
optimal parameters for the SVM prediction. Additional data
file 6 is a table listing the prediction accuracies of the SVM
approach.
Additional data file 1Accessibilities of phosphorylation sites as calculated by SABLEThe relative accessibility prediction assigns a value between 0 (fully buried) and 9 (fully exposed) to each residue. For phosphoserines, phosphothreonines and phosphotyrosines, accessibility is signifi-cantly higher than for their non-phosphorylated counterparts in the same proteins. The overall accessibility of phosphoproteins is also significantly higher than for a random set of around 1,000 human proteins in Swissprot.Click here for fileAdditional data file 2Protein Data Bank structures of phosphoproteinsWe visualized determined structures of phosphoproteins via Mol-soft ICM Browser Pro (version 3.4-8f).Click here for fileAdditional data file 3Phosphorylation sites located in parts of phosphoproteins that are too flexible for structure determinationPhosphorylation sites located in parts of phosphoproteins that are too flexible for structure determination.Click here for fileAdditional data file 4Conservation of the region surrounding the phosphosite (-20 to +20 amino acids)(a) Conservation of phosphoserine surrounding sequences (green) in comparison to the average conservation of phosphoproteins (red). (b) Conservation of phosphothreonine surrounding sequences (claret-red). (c) Conservation of phosphotyrosine sur-rounding sequences (yellow). Regions around phosphosites are sig-nificantly less likely to be conserved than phosphoproteins on average.Click here for fileAdditional data file 5Optimal parameters for the SVM predictionOptimal parameters for the SVM prediction.Click here for fileAdditional data file 6Prediction accuracies of the SVM approachPrediction accuracies of the SVM approach.Click here for file
Acknowledgements
We thank other members of the Department for Proteomics and Signal
transduction for sharing insights, especially Marcus Krueger, Sidney Cam-
bridge and Matthias Selbach. We also thank Prof. John Parsch for helpful
discussions.
References
1. Hunter T: Signaling - 2000 and beyond. Cell 2000, 100:113-127.
2. Cohen P: The regulation of protein function by multisite
phosphorylation - a 25 year update. Trends Biochem Sci 2000,
25:596-601.
3. Pawson T, Nash P: Protein-protein interactions define specifi-
city in signal transduction. Genes Dev 2000, 14:1027-1047.
4. Schlessinger J: Cell signaling by receptor tyrosine kinases. Cell
2000, 103:211-225.
5. Olsen JV, Blagoev B, Gnad F, Macek B, Kumar C, Mortensen P, Mann
M: Global, in vivo, and site-specific phosphorylation dynamics
in signaling networks. Cell 2006, 127:635-648.
6. Macek B, Mijakovic I, Olsen JV, Gnad F, Kumar C, Jensen PR, Mann M:
The serine/threonine/tyrosine phosphoproteome of the
model bacterium Bacillus subtilis. Mol Cell Proteomics 2007,
6:697-707.
7. Iakoucheva LM, Radivojac P, Brown CJ, O'Connor TR, Sikes JG, Obra-
dovic Z, Dunker AK: The importance of intrinsic disorder for
protein phosphorylation. Nucleic Acids Res 2004, 32:1037-1049.
8. Dunker AK, Brown CJ, Lawson JD, Iakoucheva LM, Obradovic Z:
Intrinsic disorder and protein function. Biochemistry 2002,
41:6573-6582.
9. Jimenez JL, Hegemann B, Hutchins JR, Peters JM, Durbin R: A sys-
tematic comparative and structural analysis of protein phos-
phorylation sites based on the mtcPTM database. Genome Biol
2007, 8:R90.
10. Blom N, Gammeltoft S, Brunak S: Sequence and structure-based
prediction of eukaryotic protein phosphorylation sites. J Mol
Biol 1999, 294:1351-1362.
11. Obenauer JC, Cantley LC, Yaffe MB: Scansite 2.0: Proteome-wide
prediction of cell signaling interactions using short sequence
motifs. Nucleic Acids Res 2003,
31:3635-3641.
12. Noble WS: What is a support vector machine? Nat Biotechnol
2006, 24:1565-1567.
13. Kim JH, Lee J, Oh B, Kimm K, Koh I: Prediction of phosphoryla-
tion sites using SVMs. Bioinformatics 2004, 20:3179-3184.
14. Kersey PJ, Duarte J, Williams A, Karavidopoulou Y, Birney E,
Apweiler R: The International Protein Index: an integrated
database for proteomics experiments. Proteomics 2004,
4:1985-1988.
15. Wagner M, Adamczak R, Porollo A, Meller J: Linear regression
models for solvent accessibility prediction in proteins. J
Comput Biol 2005, 12:355-369.
16. Berman HM, Westbrook J, Feng Z, Gilliland G, Bhat TN, Weissig H,
Shindyalov IN, Bourne PE: The Protein Data Bank. Nucleic Acids
Res 2000, 28:235-242.
17. Kabsch W, Sander C: Dictionary of protein secondary struc-
ture: pattern recognition of hydrogen-bonded and geometri-
cal features. Biopolymers 1983, 22:2577-2637.
18. Altschul SF, Gish W, Miller W, Myers EW, Lipman DJ: Basic local
alignment search tool. J Mol Biol 1990, 215:403-410.
19. Swissprot []
20. Cherry JM, Adler C, Ball C, Chervitz SA, Dwight SS, Hester ET, Jia Y,
Juvik G, Roe T, Schroeder M, et al.: SGD: Saccharomyces
Genome Database. Nucleic Acids Res 1998, 26:73-79.
21. Grumbling G, Strelets V: FlyBase: anatomical data, images and
queries. Nucleic Acids Res 2006:D484-488.
22. O'Brien KP, Remm M, Sonnhammer EL: Inparanoid: a compre-
hensive database of eukaryotic orthologs. Nucleic Acids Res
2005:D476-480.
23. Needleman SB, Wunsch CD: A general method applicable to
the search for similarities in the amino acid sequence of two
proteins. J Mol Biol
1970, 48:443-453.
24. Rice P, Longden I, Bleasby A: EMBOSS: the European Molecular
Biology Open Software Suite. Trends Genet 2000, 16:276-277.
25. Hornbeck PV, Chabra I, Kornhauser JM, Skrzypek E, Zhang B: Phos-
phoSite: A bioinformatics resource dedicated to physiologi-
cal protein phosphorylation. Proteomics 2004, 4:1551-1561.
26. Diella F, Cameron S, Gemund C, Linding R, Via A, Kuster B, Sicheritz-
Ponten T, Blom N, Gibson TJ: Phospho.ELM: a database of
experimentally verified phosphorylation sites in eukaryotic
proteins. BMC Bioinformatics 2004, 5:79.
27. Nielsen H, Brunak S, von Heijne G: Machine learning approaches
for the prediction of signal peptides and other protein sort-
ing signals. Protein Engineering 1999, 12:3-9.
![Báo cáo Y học: The membrane-bound [NiFe]-hydrogenase (Ech) from Methanosarcina barkeri : unusual properties of the iron-sulphur clusters docx](https://media.store123doc.com/images/document/14/rc/ee/medium_eeh1395026426.jpg)