Báo cáo y học: " Picoeukaryotic sequences in the Sargasso Sea metagenome" potx
Bạn đang xem bản rút gọn của tài liệu. Xem và tải ngay bản đầy đủ của tài liệu tại đây (269.24 KB, 11 trang )
Genome Biology 2008, 9:R5
Open Access
2008Piganeauet al.Volume 9, Issue 1, Article R5
Research
Picoeukaryotic sequences in the Sargasso Sea metagenome
Gwenael Piganeau
*†
, Yves Desdevises
*†
, Evelyne Derelle
*†
and
Herve Moreau
*†
Addresses:
*
UPMC Univ Paris 06, UMR 7628, MBCE, Observatoire Océanologique, F-66651, Banyuls/mer, France.
†
CNRS, UMR 7628, MBCE,
Observatoire Océanologique, F-66651, Banyuls/mer, France.
Correspondence: Gwenael Piganeau. Email:
© 2008 Piganeau et al.; licensee BioMed Central Ltd.
This is an open access article distributed under the terms of the Creative Commons Attribution License ( which
permits unrestricted use, distribution, and reproduction in any medium, provided the original work is properly cited.
Picoeukaryote metagenome<p>Many sequences from picoeukaryotes were found in DNA sequence data assembled from Sargasso seawater.</p>
Abstract
Background: With genome sequencing becoming more and more affordable, environmental
shotgun sequencing of the microorganisms present in an environment generates a challenging
amount of sequence data for the scientific community. These sequence data enable the diversity of
the microbial world and the metabolic pathways within an environment to be investigated, a
previously unthinkable achievement when using traditional approaches. DNA sequence data
assembled from extracts of 0.8 µm filtered Sargasso seawater unveiled an unprecedented glimpse
of marine prokaryotic diversity and gene content. Serendipitously, many sequences representing
picoeukaryotes (cell size <2 µm) were also present within this dataset. We investigated the
picoeukaryotic diversity of this database by searching sequences containing homologs of eight
nuclear anchor genes that are well conserved throughout the eukaryotic lineage, as well as one
chloroplastic and one mitochondrial gene.
Results: We found up to 41 distinct eukaryotic scaffolds, with a broad phylogenetic spread on the
eukaryotic tree of life. The average eukaryotic scaffold size is 2,909 bp, with one gap every 1,253
bp. Strikingly, the AT frequency of the eukaryotic sequences (51.4%) is significantly lower than the
average AT frequency of the metagenome (61.4%). This represents 4% to 18% of the estimated
prokaryotic diversity, depending on the average prokaryotic versus eukaryotic genome size ratio.
Conclusion: Despite similar cell size, eukaryotic sequences of the Sargasso Sea metagenome have
higher GC content, suggesting that different environmental pressures affect the evolution of their
base composition.
Published: 7 January 2008
Genome Biology 2008, 9:R5 (doi:10.1186/gb-2008-9-1-r5)
Received: 16 October 2007
Revised: 6 December 2007
Accepted: 7 January 2008
The electronic version of this article is the complete one and can be
found online at />Genome Biology 2008, 9:R5
Genome Biology 2008, Volume 9, Issue 1, Article R5 Piganeau et al. R5.2
Background
Genome sequencing is becoming more and more affordable
and shotgun sequencing using DNA from environmental
microbial communities now provides the scientific commu-
nity with a challenging amount of sequence data (see [1,2], for
a review). These sequence data enable the diversity of the
microbial world and the metabolic pathways within environ-
ments to be investigated [3-5], a previously unthinkable
achievement when using traditional approaches, since it has
been estimated that 99% of marine microorganisms can not
be cultured in the laboratory [6].
Picoplankton is defined as a fraction of unicellular organisms
having a cell size ranging from 0.2 to 2 or 3 µm [7] and is
made up of both prokaryotic and eukaryotic cells, which can
be either heterotrophic or autotrophic. The ecology of pico-
plankton has been intensely investigated this past decade and
it now appears to play major roles in biogeochemical cycles
that occur in oceans, especially in oligotrophic areas [7-9]. At
present, the diversity of prokaryotes as studied mainly by
PCR 16S rRNA gene based approaches [10,11], or more
recently by random sequencing of filtered sea water [12], is
better characterized than that of eukaryotes. For example, in
samples collected from the Sargasso Sea, filtered through a
pore size of 0.8 µm and randomly sequenced, Proteobacteria,
Cyanobacteria and species in the CFB phylum (Cytophaga,
Flavobacterium, and Bacteroides) dominated [12], while the
presence of eukaryotic sequences was reported but without
phylogenetic analysis. Among photosynthetic bacteria, the
two genera Prochlorococcus and Synechococcus were clearly
dominant, as described for many other areas [9,13].
However, although picoeukaryotes are known to be a minor
component of picoplankton in terms of cell number, these
organisms, at least those that are photosynthetic, are known
to play a major role in primary productivity in oligotrophic
areas, where they can represent up to 80% of the autotrophic
biomass [7,14]. Picoeukaryotes usually have a bigger cell vol-
ume than prokaryotes, are subject to a high grazing mortality
and have a higher growth rate than cyanobacteria. They can
be responsible for 75% of net carbon production in some
coastal areas [14]. Picoeukaryote diversity is much less well
studied than its prokaryote counterpart, although some work
has been done recently [15-17]. It is mainly composed of phyla
such as Haptophytes, Dinoflagellates and Prasinophytes,
some phylogenetic groups inside these very broad phyla still
lacking cytological data [18,19]. Some quantitative studies
based on in situ hybridization experiments showed that,
among these groups, Prasinophytes apparently dominate
picoeukaryotes in different oceanic areas, and, more pre-
cisely, the genus Micromonas [20]. However, many other
species are found ubiquitously, even if they usually represent
a minority of cells.
The most ambitious marine metagenomics project is the Glo-
bal Ocean Survey (GOS), aiming to sequence picoplankton in
many locations all over the oceans of the planet [21]. The pilot
project of this study was published three years ago with sam-
ples from the Sargasso Sea [12]. The experimental design
used to collect sequence data was geared largely to examining
prokaryote diversity and gene content. However, some very
small eukaryotes can work their way through the filtration
system used (0.8 µm). This is indeed the case in the Sargasso
Sea samples, where 34 18S rRNA sequences were identified
but not analyzed in detail (Table S5 in [12]). Among picoeu-
karyote species or genera that could pass through the filtra-
tion cut off used, Ostreococcus is a likely candidate [12]. It is
a picophytoplankton genus that belongs to Prasinophytes, a
group of widespread green algae thought to have diverged
very early from the ancestor of all chloroplast-containing
green plants and algae. Ostreococcus is so far the smallest
eukaryotic cell known (diameter 0.8 µm), and has the small-
est currently described genome for a photosynthetic eukaryo-
tic organism [22-24]. Here, we analyze the picoeukaryotic
sequences present in the Sargasso Sea Database (SSD) to
assess the sequence quality, diversity and relative abundance
of these organisms and discuss the prospects of this approach
for evolutionary genomics.
Results
Homology based approach (BLAST) versus
phylogenetic tree reconstruction approach
We used sequence similarity as inferred from BLAST twice,
first to retrieve eukaryotic sequences from the SSD and sec-
ond to infer the taxonomic affiliation of these sequences. To
retrieve the eukaryotic scaffolds from the SSD, we used a ref-
erence dataset for each gene chosen as an anchor. We used
eight eukaryotic nuclear gene 'anchors', that is, well-con-
served genes across the eukaryotic tree of life: 18S rRNA, 28S
rRNA, and the genes encoding elongation factor 1a (EF1a),
elongation factor 2 (EF2), the large subunit of RNA polymer-
ase II (RPB1), actin, α-tubulin and β-tubulin. Since the genes
we selected were well conserved among the eukaryotic line-
age, we found little variation in the number of hits between
the different species contained in each reference dataset. We
even retrieved some prokaryotic scaffolds alongside the
eukaryotic ones because of distant conservation with the pro-
tein coding genes. We are therefore confident we retrieved all
eukaryotic scaffolds containing homologs to these genes
using this approach. However, the taxonomic affiliation of
these scaffolds as inferred from a local alignment approach
has several drawbacks and has been found to be more error
prone than phylogenetic based taxonomic affiliation [5]. Usu-
ally the blast best hit (BBH) against GenBank is the only way
to glean information about taxonomic affiliation from most
environmental sequences. The reliability of the affiliation
depends on the representation of each taxonomic group in
GenBank, but there is a high bias towards sequences from
Metazoans in this database, with a bias towards larger organ-
isms in general. To exemplify this, we identified no SSD scaf-
folds found to contain RPB1 matching with a Chlorophyta
Genome Biology 2008, Volume 9, Issue 1, Article R5 Piganeau et al. R5.3
Genome Biology 2008, 9:R5
RPB1, simply because there are no Chlorophyta RPB1 genes
in the GenBank protein database yet. Therefore, the taxo-
nomic affiliation is best described for genes sequenced in a
large number of species in a broad range of taxa, such as the
rRNA sequences. We also checked the taxonomic affiliation
by phylogenetic tree reconstruction for the rRNA sequences
(see Additional data files 1 and 2 for the 28S rRNA and 18S
rRNA supertrees). The taxonomic affiliation of a SSD scaffold
as inferred from its BBH was found to be consistent with the
tree topology for all rRNA SSD scaffolds for which phyloge-
netic position could be resolved, that is, for less than half of
the scaffolds (Additional data files 1 and 2). However,
reducing information to phylogenetic inference is too restric-
tive for this kind of highly fragmented sequence data. First,
because most of the sequences do not contain enough sites for
their phylogenetic position to be fully resolved, and second,
because highly variable regions have to be discarded from the
global alignment, whereas they may contain most of the infor-
mation (for example, the Internal Transcribed Spacer
sequences between ribosomal genes).
Picoeukaryotic diversity of the Sargasso Sea
metagenome
Depending on which gene we searched for, we retrieved 4
(EF2) to 41 (28SrRNA) distinct eukaryotic sequences from
the SSD (Table 1). This is less than the 69 18S rRNA
sequences reported in [12] because we analyzed the assem-
bled sequence data deposited in GenBank, which does not
contain the sequences obtained from samples 5 to 8 with
larger filter sizes [25] (up to 20 µm; Table S1 in [12]). The tax-
onomic distribution of the sequences, as inferred from BLAST
search against GenBank and phylogenetic analysis, is shown
in Table 1. Despite the small number of sequences, the species
diversity covered is impressive, since the five groups of the
tree of eukaryotes [26] are represented for three of the eight
nuclear genes (18S rRNA, RPB1, actin). The most abundant
high blast score hits were found to sequences from the
Dinophyceae (four out of the eight nuclear genes studied).
Table 1
Phylogenetic distribution of the eukaryotic SSD scaffolds
Number of SSD sequences
Supergroup Group 18S rRNA 28S rRNA EF1a EF2 RPB1 actin
α
-tubulin
β
-tubulin cox1 rbcL
Total 38 41 11 4 30 12 13 15 11 4
Rhizaria Cercozoa 1 - - - 2 1 - - - -
Polycystinea 3 1 - - - - - - - -
Chromalveolates Apicomplexa 1 5 - 1 1 - - - - -
Ciliophora 1 - 1 - 1 - 3 3 - -
Dinophyceae 10* (3) 11 1 - - - 3 3 1 -
Stramenopiles 1 (1) 6 (4) 2 - - 1 1 2 2 1
Excavates Euglenozoa 1 - - 1 - 1 - 1 - -
Heterolobosea - - - - 2 - - - - -
Plantae Chlorophyta 3 (2) 3 (3) 2 - x 1* 1 1 4 1*
Streptophyta 1 1 3 2* 7* 2 2* 2* 3* -
Rhodophyta - - - - 4 - - - - 2
Unikonts Ichthyosporea - 1 (1) - - 1 - - - - x
Arthropoda 7 7 (5) 1* - - 1 - - - x
Bryozoa 2 1 (1) - - - - - - - x
Cnidaria 4 2* (1) - - - - - - - x
Fungi 1 1 - - 10 3 - - - x
Platyhelminthes 1 - - - 2 - - - - x
Urochordata - 1 (1) 1 - - 1 1 1 1 x
Unknown 1 (32) 1 (25) - - - 1 - 2 - -
The number of scaffolds for which taxonomic affiliation was confirmed by phylogenetic analysis (Additional data files 1 and 2) is indicated in brackets.
The taxonomic affiliation of the largest scaffold is indicated by an asterisk. The groups for which the anchor gene has no representative in the
GenBank database are indicated by x.
Genome Biology 2008, 9:R5
Genome Biology 2008, Volume 9, Issue 1, Article R5 Piganeau et al. R5.4
This is consistent with previously reported marine picoeu-
karyotic diversity studies based on hundreds of 18S rRNA
sequences from water filtered through larger pore sizes (5 and
3 µm filter pore size in [19,27], respectively). The second most
abundant group belongs to the Streptophyta-Chlorophyta
(green plants) group, as might be expected for samples col-
lected from surface water.
Since the picoeukaryotic world generally comprises cells
smaller than 2 to 3 µm [19,27], the available SSD enables a
glimpse of the smaller part of the picoeukaryotic fraction (cell
size between 0.22 and 0.8 µm). It is not surprising, therefore,
that larger Prasinophytes, such as Bathycoccus, with a
reported cell diameter around 2 µm, were not found in the
data set.
We found two 18S scaffolds and one 28S scaffold matching
almost perfectly with an Ostreococcus strain, the smallest
photosynthetic picoeukaryotic known so far [23,24]. The two
SSD 18S rRNA sequences do not overlap and these two
sequences could thus belong to the same Ostreococcus,
closely related to strain RCC143, consistent with previous
analysis [28].
The presence of marine environmental arthropods (BBH is a
marine Copepod) and Urochordate sequences (BBH is Ciona)
was unexpected, because these organisms are usually much
bigger than 0.8 µm. Marine environmental sequences from
Copepods (and from Urochordate) have been previously
reported in nanoplankton studies (cell size between 2 and 20
µm) but never in picoeukaryotes. Several hypotheses can be
proposed to explain the presence of such sequences, one
being the presence of gametes or of cell debris from larger
organisms. However, even gametes are usually bigger than
0.8 µm and the DNA in cell debris is usually degraded.
Another explanation could be the presence of soluble DNA
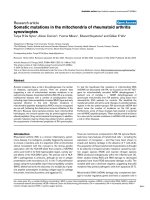
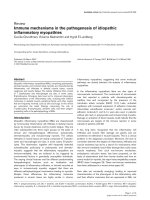
Phylogenetic position of the SSD Ostreococcus-like sequence as inferred from the 18S rRNA sequences in [30]Figure 1
Phylogenetic position of the SSD Ostreococcus-like sequence as inferred from the 18S rRNA sequences in [30]. Outgroup sequence, Bathycoccus; OT95,
Ostreococcus tauri (clade C); RCC356, RCC344 and MIC106, surface strains (clade A); RCC393 and RCC143, deep strains (clade B); RCC501, surface
strain (clade D). Numbers on branches are support values (posterior probability).
Outgroup
OT95
RCC356
RCC344
RCC393
RCC143
RCC501
100
100
100
100
MBIC10636
SSD sequence
Genome Biology 2008, Volume 9, Issue 1, Article R5 Piganeau et al. R5.5
Genome Biology 2008, 9:R5
fragments in the Seawater. Finally, a contamination of the fil-
tered batch by non-filtered water cannot be totally ruled out.
Another ecologically relevant issue is the estimation of the
relative abundance of phototrophic versus heterotrophic
organisms among these picoeukaryotes. Assuming that all
Viridiplantae and half of Dinophyceae are phototrophs [29],
we nevertheless find 9.5 phototrophs out of 41, that is less
than 24%. This is consistent with a higher observed diversity
of heterotrophs than autotrophs in picoplankton, suggesting
a complex role of heterotrophs in the microbial food web [15].
The phylogenetic analysis of the two 18S rRNA Ostreococcus
sequences found among the SSD showed that they belong to
the deep clade (cladeB in Figure 1 from [30]), even though the
sea water was collected close to the surface. This observation
has also been reported for Prochlorococcus in samples col-
lected from a similar location [31]. Since the four Sargasso
samples making up the SSD were collected during winter
deep-water mixing, this may be a possible explanation for the
presence of some deep water features of the SSD, as revealed
by a recent study of gene content along the water column [32].
Thus, the occurrence of deep microbial strains in surface
waters of the Sargasso Sea can probably be explained by fre-
quent upwelling in this ocean area.
Picoeukaryotic diversity from other oceanic
metagenomes
The SSD represents an unprecedented and yet unique
sequencing effort, since it corresponds to the assembly of a
total of 1.7 10
6
reads from four sea water samples from the
Sargasso Sea [12]. In this pilot study, three other sea water
samples have been sequenced in less depth and left unassem-
bled. One of these additional samples, sample 6, used more
conventional filter pore sizes to investigate the picoeukaryotic
world, 0.8-3 µm, when compared to the 0.22-0.8 µm range
used for three of the four SSD samples. Unfortunately, the
sequencing effort of sample 6 was only 5% of the total
sequencing effort realized to produce the SSD, or 29% of the
smallest SSD sample. As a consequence, this sample con-
tained far less eukaryotic material and enabled us to identify
6 (18S) to 11 (28S) additional eukaryotic paired reads, corre-
sponding to Chromalveolates (Additional data files 1 and 2).
We also screened seven additional marine metagenomes
from the GOS project, corresponding to samples from seven
different open ocean locations, for picoeukaryotic content.
These metagenomes are part of the GOS survey [21], and sea
water was filtered to collect 0.1-0.8 µm sized organisms. We
found out that their picoeukaryotic content was almost negli-
gible (from 0 to 4 reads matching a eukaryotic rRNA
sequence). There are at least two reasons for this picoeukary-
otic scarcity. First, the sequencing effort was much lower for
these locations (4-15% of the SSD sequencing effort), thus
reducing the overall diversity of the sample. Second, the col-
lection filters used for these metagenomes were smaller (0.1
µm compared to 0.22 µm for the SSD), which also reduces the
eukaryotic versus prokaryotic content. The collection filter
size seems to have a major effect on picoeukaryotic sampling,
since the one SSD sample collected with a 0.1 µm filter has
lower picoeukaryotic content than the three other SSD sam-
ples collected with a 0.22 µm filter, despite larger sequencing
depth (for example, Table S5 in [12]). Therefore, this study
focuses on eukaryotic sequence diversity from the largest
metagenome from the Sargasso Sea (SSD).
Picoeukaryotic versus prokaryotic content and
sequence features
We retrieved 41 distinct scaffolds containing 28S rRNA
sequences and 558 distinct scaffolds containing 16S rRNA
from the SSD. Assuming an equal distribution of the number
of rRNA repeats in the genomes of Eukaryotes and Prokaryo-
tes, that is, assuming that counting the number of rRNA
repeats to estimate species richness is biased in the same way
in both Eukaryotes and Prokaryotes, we can estimate the
eukaryotic/prokaryotic species number ratio,
ρ
, equal to
ρ
=
41/558 = 7.3%. The rRNA gene copy number is known to be
variable in both prokaryotes [33] and picoeukaryotes [34].
Due to the greater occurrence of duplication in eukaryotic
genomes, the number of rRNA copies reached in some
eukaryotic species is several orders of magnitudes higher
than in prokaryotic species. Thus, the above ratio is likely to
be an overestimation. The average number of different
eukaryotic SSD scaffolds over the 8 nuclear genes is 20, so it
seems more realistic to assume
ρ
= 20/558 = 3.7%. However,
this is an underestimate because eukaryotic genomes are, on
average, larger than prokaryotic ones. Assuming an equal
species abundance, the probability of sequencing orthologous
regions of 100 bp in two genomes of size G1 = 10 Mb, that is,
of the probability of identifying two distinct species, is one
order of magnitude lower than the probability of sequencing
two orthologous regions of 100 bp in two genomes of size G2
= 1 Mb (equal to the ratio G1/G2). Thus, this ratio must be
corrected by the difference in genome size between prokaryo-
tic and eukaryotic organisms. However, this ratio cannot be
estimated precisely, but a minimum of five seems realistic
(the Ostreococcus/Synechococcus genome size ratio is 12.6/
2.4 = 5.25). Thus, assuming a minimum average difference in
picoeukaryotic-prokaryotic genome size of 5,
ρ
= 3.7 × 5 =
18.5%, which is consistent with recent experimental esti-
mates of relative picoeukaryotic/prokaryotic abundance in
surface coastal water [14].
Because some of the anchor genes contained the same SSD
scaffolds (for 18S and 28S rRNA, α- and β-tubulin) the total
number of distinct eukaryotic scaffolds for all nuclear genes is
128. The nuclear eukaryotic SSD scaffolds have two striking
differences to the prokaryotic and organellar scaffolds (Table
2). The first difference is that the nuclear scaffolds are, on
average, 25% shorter than the prokaryotic and organellar
scaffolds (Student test between SSD scaffolds containing16S
rRNA and SSD scaffolds containing 18S rRNA, p value < 10
-
7
). The shorter length of the eukaryotic nuclear scaffolds can
be explained in at least three ways. First it could solely reflect
Genome Biology 2008, 9:R5
Genome Biology 2008, Volume 9, Issue 1, Article R5 Piganeau et al. R5.6
the genome size difference as explained above, since the prob-
ability of finding two overlapping sequences and, thus, larger
assemblies is smaller for larger genomes. Second, it may also
reflect the greater abundance of prokaryotic versus eukaryo-
tic genomes. A greater number of prokaryotic genomes is the
direct consequence of a greater number of prokaryotic cells,
as estimated experimentally [14], whereas a greater number
of organellar genomes could reflect a higher number of
genome copies in the organelles compared to the nucleus. Our
result suggests that organellar DNA may be present in more
copies than nuclear DNA in picoeukaryotes, as observed in
the green alga Chlamydomonas [35]. Third, the shorter
length of eukaryotic scaffolds could also be due to different
efficiencies in DNA extraction and sequencing between circu-
lar and linear DNA, or between sequences of different base
composition.
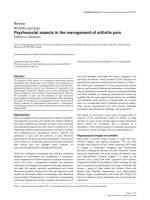
The second difference is that the AT content of the SSD
eukaryotic scaffolds we retrieved is much lower than the aver-
age AT content of the SSD (51.4% versus 61.4%; Student test,
p value < 10
-15
; Figure 2). The few eukaryotic sequences we
retrieved from the seven GOS open ocean locations also have
a lower AT content (52.2%) than the AT content observed in
these metagenomes [36]. To test whether this observation is
a consequence of a GC biased anchor dataset, we compared
the base composition of our anchor dataset to the average GC
content in the two complete picoeukaryotic genomes of
Ostreococcus tauri and Cyanidioschyzon merolae. The base
composition of the eight nuclear anchor genes is actually AT
biased in O. tauri (n = 8, f
AT
= 45.0% versus n = 7166, f
AT
=
39.6, p value = 0.003) and not significantly different from the
average AT content of the genes in C.merolae (n = 8, f
AT
=
44.4, n = 6699, f
AT
= 44.7, p value = 0.79). Foerstner and col-
leagues [37] argued that the environment shapes the nucle-
otide composition of genomes because the Sargasso Sea
prokaryotic sequences have a higher AT content than
sequences from other environments, though the causes
responsible for this compositional bias are not clear yet.
We compared the AT composition of the SSD eukaryotic
sequences with the AT composition of their GenBank BBH
and found no trend in average base composition differences
on the alignments (exact test on the difference of AT content
between each pair of sequences, p value = 0.93, n = 128);
restricting the comparison to non-marine BBH was not sig-
nificant either (p value = 0.83, n = 30). We also compared the
AT composition of 30 of the 128 eukaryotic SSD scaffolds hav-
ing a blast hit against the soil metagenome (e-value < 10
-6
) [3]
and found no significant difference in base composition over
the alignments (p value = 0.76, n = 30).
Shorter genome sizes and the higher cost of synthesis of G and
C compared to A or T nucleotides have been invoked as possi-
ble explanations for base composition differences between
genomes, because of their indirect influence on growth rate
[38]. Global environmental features (nutrient availability,
organism density, ecosystem complexity) may induce differ-
ent pressures on growth rates and, thus, on genomic base
composition [37]. This analysis suggests that base composi-
tion in picoeukaryotes is not subjected to the same selective
or neutral forces as prokaryotic sequences in the Sargasso
Sea.
Discussion
We have shown that the SSD contains genomic data from at
least 41 eukaryotes with cell sizes below 0.8 µm, with
representatives in the five supergroups of the eukaryote tree
Table 2
Comparison of the sequence features of the picoeukaryotic scaffolds retrieved from the SSD
Number of scaffolds Average length* (bp) Length* of largest
scaffold (Kbp)
Average distance
between gap (bp)
Average AT content
(%) (minimum-
maximum)
All SSD 232,141 2,165 205.9 920 61.4 (16.4-99.2)
16S rRNA 558 3,942 76.1 1,103 59.9 (38.6-74.7)
18S rRNA 38 2,673 24.3 1,028 51.9 (32.5-71.1)
28S rRNA 41 1,760 4.3 880 50.5 (34.7-66.7)
EF1a 11 11,301 86.6 1,518 46 (33.7-67.2)
EF2 4 4,163 8.8 1,342 41.6 (38.5-44.6)
RPB1 30 1,724 2.7 862 61.9 (34.9-76.7)
actin 12 2,844 17.2 910 41.5 (30.1-60.3)
α
-tubulin 13 1,986 6.7 864 48.6 (31.3-73.7)
β
-tubulin 15 1,887 6.7 832 46.2 (30.5-73.7)
All nuclear 128 2,910 86.6 1,253 51.4 (30.1-76.7)
cox1 11 3,962 19.4 1,230 66.3 (58.6-70.5)
rbcL 4 4,173 11.3 2,033 64.7 (59.4-67.6)
*Excluding gaps.
Genome Biology 2008, Volume 9, Issue 1, Article R5 Piganeau et al. R5.7
Genome Biology 2008, 9:R5
of life. This represents 4-18% of the prokaryotic diversity of
this dataset, in agreement with recent experimental estimates
in surface water [14]. We cannot rule out the hypothesis that
some of these sequences come from larger organisms that
have contaminated some of the water samples.
Also, the assembly of environmental sequences is a great
methodological challenge and erroneous assembly may lead
to an over- or under-estimation of this number of distinct
species. However, this is unlikely for the SSD eukaryotic data
we retrieved, because the eukaryotic scaffolds are very short
(of the size of the anchor genes) and most of them are 'mini-
scaffolds' (consisting of a read and its mate-pair, as described
in the supplementary information in [12]).
Overall, the eukaryotic scaffolds were shorter than the
prokaryotic ones, which is consistent with larger genome
sizes and/or lower cell numbers for picoeukaryotes, and they
have a lower AT content. These sequence data contribute
information for studying evolutionary genomics in marine
picoeukaryotes.
Most questions in evolutionary genomics need either a com-
plete genome or a representative subset of it. With the
sequence of one organism, we can address such issues as the
evolution of codon usage bias, the evolution of base composi-
tion variation, the dynamics of duplication or the dynamics of
transposable elements. With several genomes sequenced
from different phylogenetically related species, we can tackle
similar issues but from a phylogenetic perspective (for exam-
ple, which genomic process took place before or after the spe-
ciation event). We can also compare homologous sequences
from two species to detect positive selection on amino-acid
composition [39] or putative regulatory sequences of gene
expression by phylogenetic footprinting [40,41]. However,
the distinction between orthologous sequences (descending
from a common ancestor by speciation) and paralogous
sequences (descending from a common ancestor by duplica-
tion) is essential for evolutionary genomics [42]. This kind of
information can be obtained only from a well-annotated com-
plete genome and not from the fragmented and highly gapped
environmental sequence data. However, environmental
sequences such as those of the Sargasso Sea can provide pre-
cious additional data for evolutionary genomics provided that
a complete genome is already available. This will soon be the
case within the class of Prasinophyceae (Chlorophyta) since
seven genome projects are underway: three Ostreococcus,
three Micromonas and one Bathycoccus. For example, 13% of
AT frequency d 128 eukaryotic SSD scaffolds retrieved (white bars) versus AT frequency distribution in the total SSD scaffolds (black bars)Figure 2
AT frequency distribution in the 128 eukaryotic SSD scaffolds retrieved (white bars) versus AT frequency distribution in the total SSD scaffolds (black
bars).
0
0.05
0.1
0.15
0.2
0.25
0.3
0.15-0.2
0.2-0.25
0.25-0.3
0.3-0.35
0.35-0.4
0.4-0.45
0.45-0.5
0.5-0.55
0.55-0.6
0.6-0.65
0.65-0.7
0.7-0.75
0.75-0.8
0.8-0.85
0.85-0.9
0.9-0.95
>0.95
AT frequency in scaffolds
Frequency in dataset
Genome Biology 2008, 9:R5
Genome Biology 2008, Volume 9, Issue 1, Article R5 Piganeau et al. R5.8
the 8,166 annotated coding sequences of O. tauri's genome
[43] match with high blast scores against the SSD (score > 105
and E-value < 10
-26
), and 41% of these scaffolds contain syn-
teny groups with up to seven genes in the same order and ori-
entation in both the SSD scaffold and O.tauri's genome [41].
This metagenomic data could also be used to improve a
genome assembly by bridging a gap between two genes, pro-
vided that the genomic coverage of the species is high enough
in the SSD.
Another potential crucial output of metagenomes is the
retrieval of new, mainly free-living, eukaryotic sequences.
This could have outstanding significance for phylogenetic
studies, and help to resolve the deep branches of the
eukaryotic tree of life by providing sequences from missing
links [16]. It is striking that the Sargasso Sea data, despite a
relatively small number of different species for the same gene,
contains such amazing phylogenetic spread, with representa-
tives from the five branches of the eukaryotic tree of life [26].
Since the analysis unit of a metagenome is an assembled
sequence with no more information on the organism, we need
assemblies to be as long and reliable as possible to provide
maximum phylogenetic information (maximum number of
genes) for each organism sequenced. Unfortunately, the
assembly of sequences from metagenomes is a great method-
ological challenge [44] and the average length of a SSD
picoeukaryotic sequence is the average size of a gene, that is,
around 2,000 bp for rRNA. The development of phylogenetic
methods to deal with partial alignments (supertrees) enables
phylogenetic inference from gapped data (for example, see
references in [5,44]), thus partly overcoming this problem.
Conclusion
Specific environmental sequencing efforts addressing more
specifically picoeukaryotes are needed, with less emphasis on
prokaryotes. This would enable better coverage and, thus,
larger assemblies of eukaryotic genomes. The objective of the
Sargasso Sea environmental sequencing was clearly to obtain
prokaryotic sequences and this was done by using a very small
filter porosity, sieving organisms of between 0.22 and 0.8 µm.
The simplest way to improve the representation of picoeu-
karyotes in a metagenome would be to shift the filtration
range to between 0.5 and 2 µm and increase the sequencing
effort to a minimum of one million reads. This would elimi-
nate a large fraction of the prokaryotes and would increase
the proportion of picoeukaryotes present in the water sample.
Material and methods
Data
The SSD sequence data was retrieved from GenBank (acces-
sion number AACY01000000
, Locus CH004737 to
CH236877
). These sequence data are the database of scaf-
folds not associated with any particular organism. It was
obtained from samples 1-4, prefiltered through 0.8 µm and
collected on one 0.1 and three 0.22 µm filters (Table S1 in
[12]). The reads corresponding to this assembly, the reads
obtained from sample 6, prefiltered through 3 µm and col-
lected on 0.8 µm filters, and the reads corresponding to the
seven other open ocean locations were downloaded from the
CAMERA database [45,46]. The O. tauri gene content was
retrieved from GenBank (accession numbers CR954201
-
CR954220
).
To assess picoeukaryotic diversity, we used eight eukaryotic
nuclear gene 'anchors', that is, well-conserved genes across
the eukaryotic tree of life: 18S rRNA, 28S rRNA, and genes
encoding EF1a, EF2, RPB1, actin, α-tubulin and β-tubulin.
For each of the six nuclear protein coding genes, we retrieved
the seven corresponding genes from the KOG database [47],
corresponding to the genes of Arabidopsis thaliana,
Caenorhabditis elegans, Drosophila melanogaster, Homo
sapiens, Saccharomyces cerevisiae, Schizosaccharomyces
pombe, Encephalitozoon cuniculi and the corresponding O.
tauri gene. We then extended each reference dataset by
searching GenBank for representatives of these genes in each
of the supergroups of the eukaryotic tree of life [26]. The total
number of genes in each dataset was 17 (EF1a), 15 (EF2), 21
(RPB1), 22 (actin), 20 (α-tubulin) and 20 (β-tubulin).
We also used one chloroplast gene, that encoding the large
subunit of ribulose carboxylase (rbcL), and one mitochon-
drial gene, that encoding the first subunit of cytochrome oxy-
dase (cox1). For each gene, we retrieved 21 and 31 genes from
GenBank, respectively, randomly sampling representatives in
each of the five supergroups of the eukaryotic tree of life.
To assess prokaryotic diversity on the same dataset, we used
16S rRNA. The reference dataset for 16S rRNA was retrieved
from the RDPII database [48] and contained 4,409
sequences. We randomly chose one sequence for each
sequence sharing the same taxonomic affiliation (given by the
first name of the organism, for example, Persephonella),
which reduced the number of sequences to 906.
The reference datasets for 18S and 28S RNA were retrieved
from GenBank using the ACNUC retrieval system [49]
excluding sequences from metazoans. As for the 16S rRNA
dataset we randomly chose one sequence when several organ-
isms shared the same taxonomic affiliation. We thus obtained
a reference dataset of 252 18S and 246 28S sequences.
Picoeukaryotic diversity and abundance
To assess the diversity and abundance of picoeukaryotes in
this dataset, we performed a BLAST search [50] of the ten
eukaryotic 'anchor' genes against the SSD, blastn for RNA and
tblastn for proteins. We retrieved all Sargasso Sea scaffolds
matching these genes with E-values smaller than 10
-14
for
blastn and 10
-7
for tblastn. We then retrieved these SSD scaf-
folds and performed a BLAST search against GenBank for
taxonomic affiliation. We used blastn against GenBank for
Genome Biology 2008, Volume 9, Issue 1, Article R5 Piganeau et al. R5.9
Genome Biology 2008, 9:R5
scaffolds containing one of the two rRNA genes, and blastx
against GenBank's protein database for the scaffolds contain-
ing one of the eight 'anchor' protein genes. We deduced the
taxonomic affiliation of the environmental sequence from the
taxonomic affiliation of the BBH when the E-value of the BBH
was smaller than 10
-18
(blastn) and 10
-10
(blastx). Otherwise,
we considered it as unknown.
Phylogeny of rRNA SSD scaffolds
The SSD scaffolds matching a gene of the anchor 18S and 28S
datasets, the corresponding anchor gene and the GenBank
BBH, were aligned by MAFFT version 5 [51,52] and the align-
ment was checked by eye with Se-Al v2.0a11 [53]. Ambiguous
regions were deleted from the alignment, for a final length of
3,045 bp for the 28S rRNA dataset (90 sequences in total) and
1,374 bp for the 18S rRNA dataset (61 sequences in total).
Most SSD scaffolds are of different sizes, together covering
almost all 18S and/or 28S rRNA. These sequence length dif-
ferences made it difficult to recontruct a phylogenetic tree
directly from the whole matrix of aligned sequences. Thus,
overlapping subsets of sequences were defined for the
maximum possible number of species, given that the aligned
sequences were long enough to reconstruct well-supported
phylogenetic trees. The trees issued from these datasets will
hereafter be named 'subtrees'. They were reconstructed by
Bayesian analysis with MrBayes 3.1.2 [54]. The reconstruc-
tion used four chains of 10
6
generations with the best evolu-
tionary models chosen via hierarchical likelihood ratio test by
MrModelTest 2.2 [55,56] (the MrModeltest 2.2 program is
distributed by the author, Evolutionary Biology Centre, Upp-
sala University). The Burnin value was set to 20% of the sam-
pled trees (1% of the number of generations) and only clades
with at least 90% posterior probability support were kept as
conservative estimates in the final consensus tree. Thirty-one
subtrees (28S rRNA) and 23 subtrees (18S rRNA) were
constructed.
All subtrees were combined in a supertree with the use of
RadCon [57], using matrix representation with parsimony
with the Baum [58] and Ragan [59] coding scheme [60,61].
The combined matrix was subjected to a parsimony analysis
with the heuristic algorithm implemented in PAUP* [62],
using 500 random addition replicates and the tree bisection-
reconnection branch-swapping algorithm, holding a maxi-
mum of 1,000 trees for each replicate. The 498,000 (28S) and
423,000 (18S) most parsimonious trees obtained were com-
bined in a majority-rule consensus. Supertrees computed
from subtrees obtained via Bayesian analysis and maximum
likelihood were not significantly different (p < 0.01, symmet-
ric-difference test [63], computed with PAUP* 4.0), and only
supertrees computed from Bayesian inferred subtrees are
presented. To assign a SSD scaffold to a taxonomic group, the
branch support of this sequence within a taxonomic group
had to be over 80%; otherwise, we assumed that the taxo-
nomic affiliation of the SSD scaffold was unresolved by the
supertree topology.
Phylogenetic position of the SSD Ostreococcus like 18S
sequence
The 18S rRNA sequences from several Ostreococcus strains
[30] and the corresponding first blast hit of the O.tauri 18S on
the SSD were aligned manually. This alignment was used to
build a phylogenetic tree by Bayesian analysis with MrBayes
3.1.1 [54]. The reconstruction used four chains of 10
6
genera-
tions with the best evolutionary models chosen via hierarchi-
cal likelihood ratio test by MrModelTest 2.2 [56]. The best
model was Hasegawa-Kishino-Yano (HKY+Γ) for 18S rRNA.
Several analyses were independently run from random trees
and to assess convergence. The tree was rooted using related
prasinophyte taxa: Bathycoccus.
Sequence analysis
For each SSD scaffold, we computed the length; the number
of gaps, the distance between gaps and the base composition
using home made computer programs (C language). Statisti-
cal analysis was performed with R software [64].
To compare the AT frequency between the SSD scaffolds and
the AT frequency of the corresponding BBH, we derived the
variance, V, of the average of the difference in AT frequency
between the two sequences, M. Under the null hypothesis of
no difference in AT composition, M follows a normal distribu-
tion of mean 0 and variance V:
with n the number of SSD scaffolds used, k
i
the length of the
alignment over which the AT frequencies of the SSD scaffold,
f
i
, and the corresponding BBH, f'
i
, was computed.
Abbreviations
BBH, best blast hit; EF, elongation factor; GOS, Global Ocean
Survey; RPB1, large subunit of RNA polymerase II; SSD, Sar-
gasso Sea Database.
Authors' contributions
GP designed the study and performed data analysis. YD per-
formed phylogenetic analysis. ED provided Ostreococcus
sequences and helped with data analysis. GP and HM wrote
the paper. All authors have read and approved the final
manuscript.
Additional data files
The following additional data are available with the online
version of this paper. Additional data file 1 shows the super-
V
n
f
i
f
i
f
i
f
i
k
i
i
n
=
−+ −
=
∑
1
2
11
1
()’(’)
Genome Biology 2008, 9:R5
Genome Biology 2008, Volume 9, Issue 1, Article R5 Piganeau et al. R5.10
tree of 28S rRNA, a consensus of 498,000 trees. Additional
data file 2 is the supertree of 18S rRNA, a consensus of
423,000 trees. Additional data file 3 is a table listing the mod-
els chosen for each subtree with ModelTest.
Additional data file 1Supertree of 28S rRNA, a consensus of 498,000 treesSupertree of 28S rRNA, a consensus of 498,000 trees.Click here for fileAdditional data file 2Supertree of 18S rRNA, a consensus of 423,000 treesSupertree of 18S rRNA, a consensus of 423,000 trees.Click here for fileAdditional data file 3Models chosen for each subtree with ModelTestModels chosen for each subtree with ModelTest.Click here for file
Acknowledgements
This work was supported by the Centre National de la Recherche Scienti-
fique and the Université Pierre et Marie-Curie (Paris VI). We would like to
thank Nigel Grimsley for insightful comments and Sebastien Gourbiere for
statistical expertise. We are grateful to Yves van de Peer's Bioinformatics
and Evolutionary Genomics lab at Ghent University for their work on the
gene annotation of O.tauri (special thanks to Stephan Rombauts, Steven
Robens and Pierre Rouze) and access to computing facilities. The work pre-
sented here was conducted within the framework of the 'Marine Genomics
Europe' European Network of Excellence (2004-2008) (GOCE-CT-2004-
505403).
References
1. Streit WR, Schmitz RA: Metagenomics the key to the uncul-
tured microbes. Curr Opin Microbiol 2004, 7:492-498.
2. Schloss PD, Handelsman J: Metagenomics for studying uncultur-
able microorganisms: cutting the Gordian knot. Genome Biol
2005, 6:229.
3. Tringe SG, von Mering C, Kobayashi A, Salamov AA, Chen K, Chang
HW, Podar M, Short JM, Mathur EJ, Detter JC, et al.: Comparative
metagenomics of microbial communities. Science 2005,
308:554-557.
4. Johnston AW, Li Y, Ogilvie L: Metagenomic marine nitrogen fix-
ation feast or famine? Trends Microbiol 2005, 13:416-420.
5. von Mering C, Hugenholtz P, Raes J, Tringe SG, Doerks T, Jensen LJ,
Ward N, Bork P: Quantitative phylogenetic assessment of
microbial communities in diverse environments. Science
2007, 315:1126-1130.
6. Woese CR: Whither microbiology? Phylogenetic trees. Curr
Biol 1996, 6:1060-1063.
7. Li W: Primary production of prochlorophytes, cyanobacteria,
and eukaryotic ultraphytoplankton: Measurements from
flow cytometric sorting. Limnol Oceanogr 1994, 39:169-175.
8. Campbell L, Nolla HA, Vaulot D: The importance of Prochloro-
coccus to community struc- ture in the central North Pacific
Ocean. chlorococcus sp. (Prochlorophyta) strains isolated
from the North Atlantic and the Mediterranean Sea. Plant.
Limnol Oceanogr 1994, 39:954-961.
9. Rocap G, Distel DL, Waterbury JB, Chisholm SW: Resolution of
Prochlorococcus and Synechococcus ecotypes by using 16S-
23S ribosomal DNA internal transcribed spacer sequences.
Appl Environ Microbiol 2002, 68:1180-1191.
10. Giovannoni SJ, Britschgi TB, Moyer CL, Field KG: Genetic diversity
in Sargasso Sea bacterioplankton. Nature 1990, 345:60-63.
11. Suzuki M, Rappe MS, Giovannoni SJ: Kinetic bias in estimates of
coastal picoplankton community structure obtained by
measurements of small-subunit rRNA gene PCR amplicon
length heterogeneity. Appl Environ Microbiol 1998, 64:4522-4529.
12. Venter JC, Remington K, Heidelberg JF, Halpern AL, Rusch D, Eisen
JA, Wu D, Paulsen I, Nelson KE, Nelson W, et al.: Environmental
genome shotgun sequencing of the Sargasso Sea. Science
2004, 304:66-74.
13. Partensky F, Hess WR, Vaulot D: Prochlorococcus, a marine
photosynthetic prokaryote of global significance. Microbiol Mol
Biol Rev 1999, 63:106-127.
14. Worden AZ, Nolan JK, Palenik B: Assessing the dynamics and
ecology of marine picophytoplankton: The importance of
the eukaryotic component. Limnology And Oceanography 2004,
49:168-179.
15. Vaulot D, Romari K, Not F: Are autotrophs less diverse than
heterotrophs in marine picoplankton? Trends Microbiol 2002,
10:266-267.
16. Moreira D, Lopez-Garcia P: The molecular ecology of microbial
eukaryotes unveils a hidden world. Trends Microbiol 2002,
10:31-38.
17. Guillou L, Eikrem W, Chretiennot-Dinet MJ, Le Gall F, Massana R,
Romari K, Pedros-Alio C, Vaulot D: Diversity of picoplanktonic
prasinophytes assessed by direct nuclear SSU rDNA
sequencing of environmental samples and novel isolates
retrieved from oceanic and coastal marine ecosystems. Pro-
tist 2004, 155:193-214.
18. Lopez-Garcia P, Lopez-Lopez A, Moreira D, Rodriguez-Valera F:
Diversity of free-living prokaryotes from a deep-sea site at
the Antarctic Polar Front. FEMS Microbiol Ecol 2001, 36:193-202.
19. Moon-van der Staay SY, De Wachter R, Vaulot D: Oceanic 18S
rDNA sequences from picoplankton reveal unsuspected
eukaryotic diversity. Nature 2001, 409:607-610.
20. Not F, Latasa M, Marie D, Cariou T, Vaulot D, Simon N: A single
species, Micromonas pusilla (Prasinophyceae), dominates
the eukaryotic picoplankton in the Western English
Channel. Appl Environ Microbiol 2004, 70:4064-4072.
21. Rusch DB, Halpern Aaron L, Sutton G, Heidelberg Karla B, William-
son S, Yooseph S, Wu D, Eisen Jonathan A, Hoffman , et al.: The Sor-
cerer II Global Ocean Sampling Expedition: Northwest
Atlantic through Eastern Tropical Pacific. PLoS Biology 2007,
e77:3.
22. Derelle E, Ferraz C, Lagoda P, Eychenie S, Cooke R, Regad F, Sabau
X, Courties C, Delseny M, Demaille J, et al.: Dna libraries for
sequencing the genome of Ostreococcus tauri (Chlorophyta,
Prasinophyceae): The smallest free-living eukaryotic cell.
Journal Of Phycology 2002, 38:1150-1156.
23. Courties C, Vaquer A, Troussellier M, Lautier J, Chretiennot-Dinet
MJ, Neveux J, Machado C, Claustre H: Smallest eukaryotic
organism. Nature 1994, 370:255.
24. Chretiennot-Dinet MJ, Courties C, Vaquer A, Neveux J, Claustre H,
Lautier J, Machado MC: A New Marine Picoeucaryote - Ostreo-
coccus Tauri Gen Et Sp-Nov (Chlorophyta, Prasinophyceae).
Phycologia 1995, 34:285-292.
25. Remington KA, Heidelberg K, Venter JC: Taking metagenomic
studies in context. Trends Microbiol 2005, 13:404.
26. Keeling PJ, Burger G, Durnford DG, Lang BF, Lee RW, Pearlman RE,
Roger AJ, Gray MW: The tree of eukaryotes. Trends Ecol Evol
2005, 20:670-676.
27. Lopez-Garcia P, Rodriguez-Valera F, Pedros-Alio C, Moreira D:
Unexpected diversity of small eukaryotes in deep-sea Ant-
arctic plankton. Nature 2001, 409:603-607.
28. Worden AZ: Picoeukaryote diversity in coastal waters of the
Pacific Ocean. Aquatic Microbial Ecology 2006, 43:165-175.
29. Leander BS, Keeling PJ: Morphostasis in alveolate evolution.
Trends In Ecology & Evolution 2003, 18:395-402.
30. Rodriguez F, Derelle E, Guillou L, Le Gall F, Vaulot D, Moreau H:
Ecotype diversity in the marine picoeukaryote Ostreococcus
(Chlorophyta, Prasinophyceae). Environmental Microbiology 2005,
7:853-859.
31. West NJ, Bacchieri R, Hansen G, Tomas C, Lebaron P, Moreau H:
Rapid quantification of the toxic alga Prymnesium parvum in
natural samples by use of a specific monoclonal antibody and
solid-phase cytometry. Appl Environ Microbiol 2006, 72:860-868.
32. DeLong EF, Preston CM, Mincer T, Rich V, Hallam SJ, Frigaard NU,
Martinez A, Sullivan MB, Edwards R, Brito BR, et al.: Community
genomics among stratified microbial assemblages in the
ocean's interior. Science 2006, 311:496-503.
33. Fogel GB, Collins CR, Li J, Brunk CF: Prokaryotic Genome Size
and SSU rDNA Copy Number: Estimation of Microbial Rel-
ative Abundance from a Mixed Population. Microb Ecol 1999,
38:93-113.
34. Zhu F, Massana R, Not F, Marie D, Vaulot D: Mapping of picoeu-
caryotes in marine ecosystems with quantitative PCR of the
18S rRNA gene. FEMS Microbiol Ecol 2005, 52:79-92.
35. Bastia D, Chiang KS, Swift H, Siersma P: Heterogeneity, complex-
ity, and repetition of the chloroplast DNA of
Chlamydomonas reinhardtii. Proc Natl Acad Sci USA 1971,
68:1157-1161.
36. Raes J, Foerstner KU, Bork P: Get the most out of your metage-
nome: computational analysis of environmental sequence
data. Curr Opin Microbiol 2007, 10:490-498.
37. Foerstner KU, von Mering C, Hooper SD, Bork P: Environments
shape the nucleotide composition of genomes. Embo Reports
2005, 6:1208-1213.
38. Rocha E, Danchin A: Base composition bias might result from
competition for metabolic resources. Trends Genet 2002,
18:291-294.
39. Yang Z, Bielawski JP: Statistical methods for detecting molecu-
lar adaptation. Trends In Ecology And Evolution 2000, 15:496-503.
40. Duret L, Bucher P: Searching for regulatory elements in
Genome Biology 2008, Volume 9, Issue 1, Article R5 Piganeau et al. R5.11
Genome Biology 2008, 9:R5
human noncoding sequences. Curr Opin Struct Biol 1997,
7:399-406.
41. Piganeau G, Moreau H: Screening the Sargasso Sea metagen-
ome for data to investigate genome evolution in Ostreococ-
cus (Prasinophyceae, Chlorophyta). Gene 2007, 406:184-190.
42. Koonin E: Orthologs, paralogs, and evolutionary genomics.
Annu Rev Genet 2005, 39:309-338.
43. Derelle E, Ferraz C, Rombauts S, Rouze P, Worden AZ, Robbens S,
Partensky F, Degroeve S, Echeynie S, Cooke R, et al.: Genome anal-
ysis of the smallest free-living eukaryote Ostreococcus tauri
unveils many unique features. Proc Natl Acad Sci USA 2006,
103:11647-11652.
44. Chen K, Pachter L: Bioinformatics for whole-genome shotgun
sequencing of microbial communities. PLoS Comput Biol 2005,
1:106-112.
45. CAMERA
[http:web.camera.calit2.necamerawegworg.jcvi.camera.web.gwt.dnro
jectSamplesPagojectSam plesPage.htm]
46. Seshadri R, Kravitz SA, Smarr L, Gilna P, Frazier M: CAMERA: A
Community Resource for Metagenomics. PLoS Biology 2007,
e75:3.
47. [ />48. [ />49. Gouy M, Gautier C, Attimonelli M, Lanave C, di Paola G: ACNUC -
- a portable retrieval system for nucleic acid sequence data-
bases: logical and physical designs and usage. Comput Appl
Biosci 1985, 1:167-172.
50. Altschul SF, Gish W, Miller W, Myers EW, Lipman DJ: Basic local
alignment search tool. J Mol Biol 1990, 215:403-410.
51. Katoh K, Kuma K, Toh H, Miyata T: MAFFT version 5: improve-
ment in accuracy of multiple sequence alignment. Nucleic
Acids Research 2005, 33:511-518.
52. Katoh K, Misawa K, Kuma K, Miyata T: MAFFT: a novel method
for rapid multiple sequence alignment based on fast Fourier
transform. Nucleic Acids Research 2002, 30:3059-3066.
53. [ />54. Ronquist F, Huelsenbeck JP: MrBayes 3: Bayesian phylogenetic
inference under mixed models. Bioinformatics 2003,
19:1572-1574.
55. Posada D, Crandall KA: Modeltest: testing the model of DNA
substitution. Bioinformatics 1998, 14:817-818.
56. Nylander JA, Ronquist F, Huelsenbeck JP, Nieves-Aldrey JL: Bayesian
phylogenetic analysis of combined data. Syst Biol 2004,
53:47-67.
57. Thorley JL, Page RD: RadCon: phylogenetic tree comparison
and consensus. Bioinformatics 2000, 16:486-487.
58. Baum B: Combining trees as a way of combining data sets for
phylogenetic inference, and the desirability of combining
gene trees. Taxon 1992, 41:3-10.
59. Ragan M: Phylogenetic inference based on matrix representa-
tion of trees. Molecular Phylogenetics and Evolution 1992, 1:53-58.
60. Wiens J, Reeder TW: Combining data sets with different num-
bers of taxa for phylogenetic analysis. Systematic Biology 1995,
44:548-549.
61. Sanderson M, Purvis A, Henze C: Phylogenetic supertrees:
assembling the trees of life. Trends in Ecology and Evolution 1998,
13:105-109.
62. Swofford D: PAUP*. Phylogenetic Analysis Using Parsimony
(*and Other Methods). Version 4d10. Sinauer Associates, Sun-
derland, Massachusetts; 2003.
63. Penny D, Hendy MD: The use of tree comparison metrics. Sys-
tematic Biology 1985, 34:75-82.
64. [].