Báo cáo y học: "Novel insights into the relationships between dendritic cell subsets in human and mouse revealed by genome-wide expression profiling" ppt
Bạn đang xem bản rút gọn của tài liệu. Xem và tải ngay bản đầy đủ của tài liệu tại đây (1.36 MB, 27 trang )
Genome Biology 2008, 9:R17
Open Access
2008Robbinset al.Volume 9, Issue 1, Article R17
Research
Novel insights into the relationships between dendritic cell subsets
in human and mouse revealed by genome-wide expression profiling
Scott H Robbins
*†‡‡‡
, Thierry Walzer
*†‡
, Doulaye Dembélé
§¶¥#
,
Christelle Thibault
§¶¥#
, Axel Defays
*†‡
, Gilles Bessou
*†‡
, Huichun Xu
**
,
Eric Vivier
*†‡††
, MacLean Sellars
§¶¥#
, Philippe Pierre
*†‡
, Franck R Sharp
**
,
Susan Chan
§¶¥#
, Philippe Kastner
§¶¥#
and Marc Dalod
*†‡
Addresses:
*
CIML (Centre d'Immunologie de Marseille-Luminy), Université de la Méditerranée, Parc scientifique de Luminy case 906,
Marseille F-13288, France.
†
U631, INSERM (Institut National de la Santé et de la Recherche Médicale), Parc scientifique de Luminy case 906,
Marseille F-13288, France.
‡
UMR6102, CNRS (Centre National de la Recherche Scientifique), Parc scientifique de Luminy case 906, Marseille
F-13288, France.
§
Hematopoiesis and leukemogenesis in the mouse, IGBMC (Institut de Génétique et de Biologie Moléculaire et Cellulaire),
rue Laurent Fries, ILLKIRCH F-67400, France.
¶
U596, INSERM, rue Laurent Fries, ILLKIRCH F-67400, France.
¥
UMR7104, CNRS, rue
Laurent Fries, ILLKIRCH F-67400, France.
#
UM41, Université Louis Pasteur, rue Laurent Fries, Strasbourg F-67400, France.
**
The Medical
Investigation of Neurodevelopmental Disorders Institute, University of California at Davis Medical Center, Sacramento, CA 95817, USA.
††
Hôpital de la Conception, Assistance Publique-Hôpitaux de Marseille, Boulevard Baille, Marseille F-13385, France.
‡‡
Current address:
Genomics Institute of the Novartis Research Foundation, John Jay Hopkins Drive, San Diego, CA 92121, USA.
Correspondence: Marc Dalod. Email:
© 2008 Robbins et al.; licensee BioMed Central Ltd.
This is an open access article distributed under the terms of the Creative Commons Attribution License ( which
permits unrestricted use, distribution, and reproduction in any medium, provided the original work is properly cited.
Profiling dendritic cell subsets<p>Genome-wide expression profiling of mouse and human leukocytes reveal conserved transcriptional programs of plasmacytoid or con-ventional dendritic cell subsets.</p>
Abstract
Background: Dendritic cells (DCs) are a complex group of cells that play a critical role in
vertebrate immunity. Lymph-node resident DCs (LN-DCs) are subdivided into conventional DC
(cDC) subsets (CD11b and CD8α in mouse; BDCA1 and BDCA3 in human) and plasmacytoid DCs
(pDCs). It is currently unclear if these various DC populations belong to a unique hematopoietic
lineage and if the subsets identified in the mouse and human systems are evolutionary homologs.
To gain novel insights into these questions, we sought conserved genetic signatures for LN-DCs
and in vitro derived granulocyte-macrophage colony stimulating factor (GM-CSF) DCs through the
analysis of a compendium of genome-wide expression profiles of mouse or human leukocytes.
Results: We show through clustering analysis that all LN-DC subsets form a distinct branch within
the leukocyte family tree, and reveal a transcriptomal signature evolutionarily conserved in all LN-
DC subsets. Moreover, we identify a large gene expression program shared between mouse and
human pDCs, and smaller conserved profiles shared between mouse and human LN-cDC subsets.
Importantly, most of these genes have not been previously associated with DC function and many
have unknown functions. Finally, we use compendium analysis to re-evaluate the classification of
interferon-producing killer DCs, lin
-
CD16
+
HLA-DR
+
cells and in vitro derived GM-CSF DCs, and
show that these cells are more closely linked to natural killer and myeloid cells, respectively.
Conclusion: Our study provides a unique database resource for future investigation of the
evolutionarily conserved molecular pathways governing the ontogeny and functions of leukocyte
subsets, especially DCs.
Published: 24 January 2008
Genome Biology 2008, 9:R17 (doi:10.1186/gb-2008-9-1-r17)
Received: 28 August 2007
Revised: 19 December 2007
Accepted: 24 January 2008
The electronic version of this article is the complete one and can be
found online at />Genome Biology 2008, 9:R17
Genome Biology 2008, Volume 9, Issue 1, Article R17 Robbins et al. R17.2
Background
Dendritic cells (DCs) were initially identified by their unique
ability to present antigen for the priming of naïve CD4 and
CD8 T lymphocytes [1]. DCs have more recently been shown
to be key sentinel immune cells able to sense, and respond to,
danger very early in the course of an infection due to their
expression of a broad array of pattern recognition receptors
[2]. Indeed, DCs have been shown to play a major role in the
early production of effector antimicrobial molecules such as
interferon (IFN)-α and IFN-β [3] or inducible nitric oxide
synthase [4] and it has been demonstrated that DCs can also
activate other innate effector cells such as natural killer (NK)
cells [5]. In light of these properties, it has been clearly estab-
lished that DCs are critical for defense against infections, as
they are specially suited for the early detection of pathogens,
the rapid development of effector functions, and the trigger-
ing of downstream responses in other innate and adaptive
immune cells.
DCs can be divided into several subsets that differ in their tis-
sue distribution, their phenotype, their functions and their
ontogeny [6]. Lymph node-resident DCs (LN-DCs) encom-
pass conventional DCs (cDCs) and plasmacytoid DCs (pDCs)
in both humans and mice. LN-cDCs can be subdivided into
two populations in both mouse (CD8α and CD11b cDCs) [6]
and in human (BDCA1 and BDCA3 cDCs) [7]. In mouse,
CD8α cDCs express many scavenger receptors and may be
especially efficient for cross-presenting antigen to CD8 T cells
[8] whereas CD11b cDCs have been suggested [9,10], and
recently shown [11], to be specialized in the activation of CD4
T cells. As human cDC functions are generally studied with
cells derived in vitro from monocytes or from CD34
+
hemat-
opoietic progenitors, which may differ considerably from the
naturally occurring DCs present in vivo, much less is known
of the eventual functional specialization of human cDC sub-
sets. Due to differences in the markers used for identifying DC
subsets between human and mouse and to differences in the
expression of pattern recognition receptors between DC sub-
sets, it has been extremely difficult to address whether there
are functional equivalences between mouse and human cDC
subsets [6].
pDCs, a cell type discovered recently in both human and
mouse, appear broadly different from the other DC subsets to
the point that their place within the DC family is debated [3].
Some common characteristics between human and mouse
pDCs that distinguish them from cDCs [3] include: their abil-
ity to produce very large amounts of IFN-α/β upon activation,
their limited ability to prime naïve CD4 and CD8 T cells under
steady state conditions, and their expression of several genes
generally associated with the lymphocyte lineage and not
found in cDCs [12]. Several differences have also been
reported between human and mouse pDCs, which include the
unique ability of mouse pDCs to produce high levels of IL-12
upon triggering of various toll-like receptors (TLRs) or stim-
ulation with viruses [13,14]. Adding to the complexity of accu-
rately classifying pDCs within leukocyte subsets are recent
reports describing cell types bearing mixed phenotypic and
functional characteristics of NK cells and pDCs in the mouse
[15,16]. Collectively, these findings raise the question of how
closely related human and mouse pDCs are to one another or
to cDCs as compared to other leukocyte populations.
Global transcriptomic analysis has recently been shown to be
a powerful approach to yield new insights into the biology of
specific cellular subsets or tissues through their specific gene
expression programs [17-21]. Likewise, genome-wide com-
parative gene expression profiling between mouse and man
has recently been demonstrated as a powerful approach to
uncover conserved molecular pathways involved in the devel-
opment of various cancers [22-27]. However, to the best of
our knowledge, this approach has not yet been applied to
study normal leukocyte subsets. Moreover, DC subsets have
not yet been scrutinized through the prism of gene expression
patterns within the context of other leukocyte populations. In
this report, we assembled compendia comprising various DC
and other leukocyte subtypes, both from mouse and man.
Using intra- and inter-species comparisons, we define the
common and specific core genetic programs of DC subsets.
Results
Generation/assembly and validation of the datasets for
the gene expression profiling of LN-DC subsets
We used pan-genomic Affymetrix Mouse Genome 430 2.0
arrays to generate gene expression profiles of murine splenic
CD8α (n = 2) and CD11b (n = 2) cDCs, pDCs (n = 2), B cells (n
= 3), NK cells (n = 2), and CD8 T cells (n = 2). To generate a
compendium of 18 mouse leukocyte profiles, these data were
complemented with published data retrieved from public
databases, for conventional CD4 T cells (n = 2) [28] and
splenic macrophages (n = 3) [29]. We used Affymetrix
Human Genome U133 Plus 2.0 arrays to generate gene
expression profiles of blood monocytes, neutrophils, B cells,
NK cells, and CD4 or CD8 T cells [30]. These data were com-
plemented with published data on human blood DC subsets
(pDCs, BDCA1 cDCs, BDCA3 cDCs, and lin
-
CD16
+
HLA-DR
+
cells) retrieved from public databases [31]. All of the human
samples were done in independent triplicates. Information
regarding the original sources and the public accessibility of
the datasets analyzed in the paper are given in Table 1.
To verify the quality of the datasets mentioned above, we ana-
lyzed signal intensities for control genes whose expression
profiles are well documented across the cell populations
under consideration. Expression of signature markers were
confirmed to be detected only in each corresponding popula-
tion (see Table 2 for mouse data and Table 3 for human data).
For example, Cd3 genes were detected primarily in T cells and
often to a lower extent in NK cells; the mouse Klrb1c (nk1.1)
gene or the human KIR genes in NK cells; Cd19 in B cells; the
mouse Siglech and Bst2 genes or the human LILRA4 (ILT7)
Genome Biology 2008, Volume 9, Issue 1, Article R17 Robbins et al. R17.3
Genome Biology 2008, 9:R17
Table 1
Information on the sources and public access for the datasets analyzed in the paper
Figures
‡
Dataset Population* Laboratory
†
Public repository Accession number 1a,c; 2a 1b,d; 2b 1e 3 4a 4b 5a 5b
Affymetrix
Mouse
Genome 430
2.0 data
Spleen CD8 DCs (2) MD/SCPK GEO [95] GSE9810 X X X X X
Spleen CD11b DCs (2) MD/SCPK GEO GSE9810 X X X X X
Spleen pDCs (2) MD/SCPK GEO GSE9810 X X X X X
Spleen NK cells (2) MD/SCPK GEO GSE9810 X X X
Spleen CD8 T cells (2) MD/SCPK GEO GSE9810 X X
Spleen B cells (3) MD/SCPK GEO GSE9810 X X X
Spleen CD4 T cells (2) AYR GEO GSM44979; GSM44982 X X X
Spleen monocytes (3) SB NCI caArray [96] NA X X X
Spleen monocytes (2) BP GEO GSM224733;
GSM224735
X
Peritoneal MΦ (1) SA GEO GSM218300 X
BM-MΦ (2) RM GEO GSM177078;
GSM177081
X
BM-MΦ (1) CK GEO GSM232005 X
BM-DCs (2) RM GEO GSM40053; GSM40056 X
BM-DCs (2) MH GEO GSM101418;
GSM101419
X
Affymetrix
Mouse
U74Av2 data
Spleen CD4 T cells (3) CB/DM GEO GSM66901;
GSM66902; GSM66903
X
Spleen B2 cells (2) CB/DM GEO GSM66913; GSM66914 X
Spleen B1 cells (2) CB/DM GEO GSM66915; GSM66916 X
Spleen NK cells (2) FT EBI ArrayExpress
[97]
E-MEXP-354 X
Spleen CD4 DCs (2) CRES GEO GSM4697; GSM4707 X
Spleen CD8 DCs (2) CRES GEO GSM4708; GSM4709 X
Spleen DN DCs (2) CRES GEO GSM4710; GSM4711 X
Spleen IKDCs (2) FH GEO GSM85329; GSM85330 X
Spleen cDCs (2) FH GEO GSM85331; GSM85332 X
Spleen pDCs (2) FH GEO GSM85333; GSM85334 X
Affymetrix
Human
Genome
U133 Plus
2.0 data
Blood monocytes (3) FRS Authors' webpage
[86]
NA X X X X
Blood CD4 T cells (3) FRS Authors' webpage NA X X X
Blood CD8 T cells (3) FRS Authors' webpage NA X X X
Blood B cells (3) FRS Authors' webpage NA X X X
Blood NK cells (3) FRS Authors' webpage NA X X X
Genome Biology 2008, 9:R17
Genome Biology 2008, Volume 9, Issue 1, Article R17 Robbins et al. R17.4
and IL3RA (CD123) genes in pDCs; and Cd14 in myeloid cells.
As expected, many markers were expressed in more than a
single cell population. For example, in the mouse, Itgax
(Cd11c) was found expressed to high levels in NK cells and all
DC subsets; Itgam (Cd11b) in myeloid cells, NK cells, and
CD11b cDCs; Ly6c at the highest level in pDCs but also
strongly in many other leukocyte populations; and Cd8a in
pDCs and CD8α cDCs. However, the analysis of combinations
of these markers confirmed the lack of detectable cross-con-
taminations between DC subsets: only pDCs expressed high
levels of Klra17 (Ly49q) and Ly6c together, while Cd8a, ly75
(Dec205, Cd205), and Tlr3 were expressed together at high
levels only in CD8α cDCs, and Itgam (Cd11b) with Tlr1 and
high levels of Itgax (Cd11c) only in CD11b cDCs. Thus, each
cell sample studied harbors the expected pattern of expres-
sion of control genes and our data will truly reflect the gene
expression profile of each population analyzed, without any
detectable cross-contamination.
LN-DCs constitute a specific leukocyte family that
includes pDCs in both the human and the mouse
To determine whether LN-DCs may constitute a specific leu-
kocyte family, we first evaluated the overall proximity
between LN-DC subsets as compared to lymphoid or myeloid
cell types, based on the analysis of their global gene expres-
sion program. For this, we used hierarchical clustering with
complete linkage [32], principal component analysis (PCA)
[33], as well as fuzzy c-means (FCM) partitional clustering
approaches [34]. Hierarchical clustering clearly showed that
the three LN-DC subsets studied clustered together, both in
mouse (7,298 genes analyzed; Figure 1a) and human (11,507
genes analyzed; Figure 1b), apart from lymphocytes and mye-
loid cells. The close relationship between all the DC subsets in
each species was also revealed by PCA for mouse (Figure 1c)
and human (Figure 1d). Finally, FCM clustering also allowed
clear visualization of a large group of genes with high and spe-
cific expression levels in all DC subtypes (Figure 2, 'pan DC'
clusters). These analyses, which are based on very different
mathematical methods, thus highlight the unity of the LN-DC
family. To investigate the existence of a core genetic program
common to the LN-DC subsets and conserved in mammals,
clustering of mouse and human data together was next per-
formed. We identified 2,227 orthologous genes that showed
significant variation of expression in both the mouse and
human datasets. After normalization (as described in Materi-
als and methods), the two datasets were pooled and a com-
plete linkage clustering was performed. As shown in Figure
1e, the three major cell clusters, lymphocytes, LN-DCs, and
myeloid cells, were obtained as observed above when cluster-
ing the mouse or human data alone. Thus, this analysis shows
that DC subsets constitute a specific cell family distinct from
the classic lymphoid and myeloid cells and that pDCs belong
to this family in both mice and humans. All the LN-DC sub-
sets studied therefore share a common and conserved genetic
signature, which must determine their ontogenic and func-
tional specificities as compared to other leukocytes, including
other antigen-presenting cells.
Identification and functional annotation of the
conserved transcriptional signatures of mouse and
human leukocyte subsets
Genes that are selectively expressed in a given subset of leu-
kocytes in a conserved manner between mouse and human
were identified and are presented in Table 4. Our data analy-
sis is validated by the recovery of all the genes already known
to contribute to the characteristic pathways of development
or to the specific functions for the leukocyte subsets studied,
as indicated in bold in Table 4. These include, for example,
Cd19 and Pax5 for B cells [35], Cd3e-g and Lat for T cells [36],
as well as Ncr1 [37] and Tbx21 (T-bet) [38] for NK cells. Sim-
ilarly, all the main molecules involved in major histocompat-
ibility (MHC) class II antigen processing and presentation are
Blood neutrophils (3) FRS Authors'
webpage
NA X X X
Blood pDCs (3) CAKB EBI ArrayExpress E-TABM-34 X X X X X
Blood BDCA1 DCs (3) CAKB EBI ArrayExpress E-TABM-34 X X X X X
Blood BDCA3 DCs (3) CAKB EBI ArrayExpress E-TABM-34 X X X X X
Blood CD16 DCs (3) CAKB EBI ArrayExpress E-TABM-34 X X
PBMC-derived MΦ (2) SYH GEO GSM109788;
GSM109789
X
Monocyte-derived MΦ LZH GEO GSM213500 X
Monocyte-derived
DCs (3)
MVD GEO GSM181931;
GSM181933;
GSM181971
X
*The number of replicates is shown in parentheses.
†
MD/SCPK, M Dalod, S Chan, P Kastner; AYR, AY Rudensky; SB, S Bondada; BP, B Pulendran;
SA, S Akira; RM, R Medzhitov; CK, C Kim; MH, M Hikida; CB/DM, C Benoist, D Mathis; FT, F Takei; CRES, C Reis e Sousa; FH, F Housseau; FRS, FR
Sharp; CAKB, CAK Borrebaeck; SYH, S Yla-Herttuala; LZH, L Ziegler-Heitbrock; MVD, MV Dhodapkar.
‡
Shown in the indicated figure in this study.
BM-DC, mouse bone-marrow derived GM-CSF DCs; BM-MΦ, mouse bone marrow-derived M-CSF macrophages; monocyte-derived MΦ,
monocyte-derived M-CSF macrophages; NA, not applicable; PBMC-derived MΦ, human peripheral blood mononuclear cell-derived M-CSF
macrophages; peritoneal MΦ, peritoneal mouse macrophages.
Table 1 (Continued)
Information on the sources and public access for the datasets analyzed in the paper
Genome Biology 2008, Volume 9, Issue 1, Article R17 Robbins et al. R17.5
Genome Biology 2008, 9:R17
found selectively expressed in antigen-presenting cells
(APCs). Indeed, a relatively high proportion of the genes
selectively expressed in lymphocytes or in APCs has been
known for a long time to be involved in the biology of these
cells. However, we also found genes identified only recently as
important in these cells, such as March1 [39] or Unc93b1
[40,41] for APCs, and Edg8 for NK cells [42]. Interestingly,
we also identified genes that were not yet known to be
involved in the biology of these cells, to the best of our
knowledge, such as the E430004N04Rik expressed sequence
tag in T cells, the Klhl14 gene in B cells, or the Osbpl5 gene in
NK cells.
In contrast to the high proportion of documented genes selec-
tively expressed in the cell types mentioned above, most of the
genes specifically expressed in LN-DCs have not been previ-
ously associated with these cells and many have unknown
functions. Noticeable exceptions are Flt3, which has been
recently shown to drive the differentiation of all mouse [43-
45] and human [46] LN-DC subsets [47], and Ciita (C2ta),
which is known to specifically regulate the transcription of
MHC class II molecules in cDCs [48]. Interestingly, mouse or
human LN-DCs were found to lack expression of several tran-
scripts present in all the other leukocytes studied here,
including members of the gimap family, especially gimap4,
which have been very recently shown to be expressed to high
levels in T cells and to regulate their development and sur-
vival [49-51].
Thus, the identity of the gene signatures specific for the vari-
ous leukocyte subsets studied highlights the sharp contrast
between our advanced understanding of the molecular bases
that govern the biology of lymphocytes or the function of
antigen presentation and our overall ignorance of the genetic
programs that specifically regulate DC biology. This contrast
is enforced upon annotation of each of the gene signatures
found with Gene Ontology terms for biological processes,
molecular functions, or cellular components, and with path-
ways, or with interprotein domain names, using DAVID bio-
informatics tools [52,53] (Table 5). Indeed, many significant
annotations pertaining directly to the specific function of
myeloid cells, lymphocyte subsets or APCs are recovered, as
indicated in bold in Table 5. In contrast, only very few signif-
icant annotations are found for LN-DCs, most of which may
not appear to yield informative knowledge regarding the spe-
cific functions of these cells.
Table 2
Expression of control genes in mouse cells
Dendritic cells Lymphocytes
Probe set ID Gene Myeloid cells pDC CD8α DC CD11b DC NK CD8 T CD4 T B
1419178_at Cd3g 40 ± 10 <20 <20 <20 97 ± 31 2,074 ± 287 1,974 ± 478 22 ± 3
1422828_at Cd3d 111 ± 14 <20 <20 <20 214 ± 16 2,815 ± 11 4,520 ± 1,414 21 ± 2
1422105_at Cd3e 115 ± 30 27 ± 10 22 ± 2 23 ± 5 26 ± 9 387 ± 58 522 ± 210 26 ± 10
1426396_at Cd3z <20 <20 <20 <20 1,147 ± 81 1,545 ± 10 2,117 ± 482 25 ± 9
1426113_x_at Tcra 83 ± 8 <20 23 ± 4 <20 116 ± 39 2,517 ± 42 5,601 ± 1,818 34 ± 13
1419696_at Cd4 24 ± 2 1,233 ± 144 <20 369 ± 49 <20 <20 1,052 ± 73 <20
1450570_a_at Cd19 190 ± 44 <20 <20 <20 <20 <20 23 ± 5 2,259 ± 292
1449570_at Klrb1c (NK1.1) <20 <20 <20 <20 2,328 ± 112 <20 25 ± 7 <20
1425436_x_at Klra3 (Ly49C) 130 ± 11 24 ± 3 156 ± 0 242 ± 31 9,186 ± 479 170 ± 61 70 ± 42 <20
1450648_s_at H2-Ab1 6,887 ± 84 7,339 ± 5 9,101 ± 100 9,056 ± 277 81 ± 6 83 ± 56 978 ± 11 7,028 ± 239
1419128_at Itgax (CD11c) 454 ± 5 1,928 ± 169 2,827 ± 454 4,701 ± 56 3,403 ± 45 108 ± 44 22 ± 2 <20
1457786_at Siglech 31 ± 4 3,454 ± 536 24 ± 5 <20 <20 <20 33 ± 13 <20
1425888_at Klra17 (Ly49Q) 98 ± 4 3,413 ± 116 30 ± 14 163 ± 2 28 ± 11 24 ± 6 38 ± 10 <20
1424921_at Bst2 (120G8) 2,364 ± 149 5,571 ± 718 237 ± 30 196 ± 44 61 ± 24 162 ± 12 90 ± 3 88 ± 32
1421571_a_at Ly6c 4,420 ± 261 8,255 ± 151 98 ± 5 30 ± 8 2,082 ± 365 4,530 ± 229 1,789 ± 1,242 302 ± 303
1422010_at Tlr7 439 ± 13 846 ± 40 <20 322 ± 45 <20 <20 22 ± 2 118 ± 83
1440811_x_at Cd8a <20 337 ± 134 825 ± 44 <20 <20 1,235 ± 227 22 ± 2 <20
1449328_at Ly75 (Dec205) 249 ± 27 <20 159 ± 4 22 ± 3 24 ± 6 170 ± 29 79 ± 1 21 ± 1
1422782_s_at Tlr3 27 ± 2 25 ± 3 3,376 ± 159 287 ± 14 <20 <20 <20 52 ± 45
1422046_at Itgam (CD11b) 956 ± 57 <20 <20 162 ± 1 188 ± 38 <20 <20 21 ± 1
1449049_at Tlr1 1,218 ± 54 31 ± 15 101 ± 4 1,601 ± 92 <20 889 ± 109 498 ± 103 1,141 ± 484
1417268_at Cd14 7,649 ± 169 187 ± 52 107 ± 0 115 ± 34 <20 <20 31 ± 8 27 ± 12
1449498_at Marco 174 ± 19 <20 <20 <20 <20 <20 <20 <20
1460282_at Trem1 415 ± 19 <20 <20 <20 <20 <20 <20 <20
Genome Biology 2008, 9:R17
Genome Biology 2008, Volume 9, Issue 1, Article R17 Robbins et al. R17.6
Thus, when taken together, our data show that LN-DC sub-
sets constitute a specific family of leukocytes, sharing selec-
tive expression of several genes, most of which are still of
unknown function. We believe that the identification of these
genes selectively expressed in LN-DC subsets in a conserved
manner between mouse and human will be very helpful for
future investigation of the mechanisms regulating LN-DC
biology by the generation and study of novel genetically
manipulated animal models.
Search for a genetic equivalence between mouse and
human LN-DC subsets
To search for equivalence between mouse and human LN-DC
subsets, we examined their genetic relationships in the hier-
archical clustering depicted in Figure 1e. Two observations
can be made. First and remarkably, mouse and human pDCs
clustered together. This result indicates a high conservation
in their genetic program and establishes these two cell types
as homologs. Indeed, human and mouse pDCs share a large
and specific transcriptional signature (Table 4), with a
number of genes comparable to those of the transcriptional
signature of NK or T cells. To the best of our knowledge, most
of these genes had not been reported to be selectively
expressed in pDCs, with the exception of Tlr7 [31,54] and
Plac8 (C15) [55]. Second, although mouse and human cDCs
clustered together, the two cDC subsets of each species
appeared closer to one another than to the subsets of the
other species. Thus, no clear homology could be drawn
between human and mouse cDC subsets in this analysis.
However, it should be noted that known homologous human
and mouse lymphoid cell types also failed to cluster together
in this analysis and were closer to the other cell populations
from the same species within the same leukocyte family. This
is clearly illustrated for the T cell populations as mouse CD4
and CD8 T cells cluster together and not with their human
CD4 or CD8 T cell counterparts (Figure 1e). Therefore, to fur-
ther address the issue of the relationships between human
and mouse cDC subsets, we used a second approach. We per-
formed hierarchical clustering with complete linkage on the
mouse and human LN-DC datasets alone (1,295 orthologous
Table 3
Expression of control genes in human cells
Lymphocytes Dendritic cells Myeloid cells
Probe set ID Genes NK CD8 T CD4 T B pDC BDCA1 BDCA3 Mono Neu
206804_at CD3G 858 ± 71 1,760 ± 241 1,975 ± 132 53 ± 6 <50 <50 <50 <50 52 ± 4
213539_at CD3D 5,413 ± 238 7,134 ± 635 6,291 ± 285 276 ± 24 <50 <50 51 ± 2 112 ± 9 276 ± 4
205456_at CD3E 247 ± 21 569 ± 67 679 ± 91 <50 <50 <50 <50 <50 <50
210031_at CD3Z 8,688 ± 181 5,223 ± 218 4,749 ± 123 2,996 ± 217 56 ± 10 60 ± 17 54 ± 7 914 ± 96 132 ± 15
209671_x_at TCR@ 147 ± 16 3,127 ± 260 3,462 ± 170 71 ± 7 <50 <50 <50 <50 111 ± 16
205758_at CD8A 911 ± 26 5,259 ± 217 67 ± 10 79 ± 16 <50 <50 <50 <50 99 ± 7
207979_s_at CD8B 77 ± 9 3,596 ± 299 <50 <50 <50 <50 <50 <50 53 ± 5
203547_at CD4 <50 <50 391 ± 20 83 ± 20 1,301 ± 119 1,004 ± 74 278 ± 61 205 ± 34 <50
206398_s_at CD19 <50 51 ± 1 <50 1,726 ± 115 <50 <50 <50 57 ± 12 <50
212843_at NCAM1 (CD56) 2,074 ± 96 144 ± 14 65 ± 2 135 ± 9 <50 <50 82 ± 17 52 ± 3 <50
207314_x_at KIR3DL2 3,131 ± 172 454 ± 14 227 ± 18 265 ± 16 <50 <50 <50 59 ± 8 <50
208203_x_at KIR2DS5 3,472 ± 140 444 ± 7 236 ± 10 284 ± 14 <50 <50 <50 <50 <50
239975_at HLA-DPB2 <50 <50 <50 63 ± 22 777 ± 701 1,565 ± 519 2,056 ± 577 <50 <50
210184_at ITGAX (CD11c) 1,017 ± 50 112 ± 37 166 ± 17 752 ± 45 74 ± 21 2,151 ± 430 729 ± 98 1,284 ± 115 2,133 ± 196
210313_at LILRA4 (ILT7) 226 ± 10 117 ± 13 346 ± 42 1,109 ± 76 7,916 ± 612 230 ± 16 1,659 ± 1,183 524 ± 41 <50
206148_at IL3RA (CD123) 84 ± 3 59 ± 8 91 ± 2 324 ± 9 4,728 ± 365 61 ± 10 116 ± 110 120 ± 3 74 ± 12
1552552_s_at CLEC4C (BDCA2) 93 ± 6 61 ± 5 99 ± 4 408 ± 9 6,789 ± 737 76 ± 39 859 ± 434 217 ± 8 175 ± 25
205987_at CD1C (BDCA1) 76 ± 8 61 ± 12 159 ± 8 1,715 ± 85 64 ± 23 8,313 ± 272 722 ± 845 560 ± 59 <50
204007_at FCGR3B (CD16) 459 ± 54 115 ± 24 65 ± 5 322 ± 46 63 ± 23 <50 51 ± 1 160 ± 11 5,554 ± 57
201743_at CD14 94 ± 3 139 ± 5 343 ± 5 1,274 ± 113 <50 202 ± 183 <50 7,638 ± 446 4,621 ± 374
205786_s_at ITGAM (CD11b) 5,688 ± 116 1,980 ± 147 1,161 ± 71 2,513 ± 117 360 ± 184 703 ± 28 86 ± 63 5,541 ± 193 5,232 ± 576
208982_at
PECAM1 (CD31) 2,232 ± 48 2,144 ± 91 1,487 ± 58 4,644 ± 102 3,834 ± 601 2,825 ± 290 2,680 ± 363 5,479 ± 219 7,699 ± 853
205898_at CX3CR1 10,056 ± 53 6,633 ± 232 4,351 ± 170 6,055 ± 263 262 ± 45 1,296 ± 84 362 ± 419 5,717 ± 451 616 ± 21
39402_at IL1B 69 ± 6 72 ± 7 52 ± 3 209 ± 27 <50 195 ± 131 69 ± 27 198 ± 9 2,920 ± 183
202859_x_at IL8 95 ± 7 77 ± 6 72 ± 5 385 ± 26 218 ± 185 90 ± 9 680 ± 561 310 ± 17 8,685 ± 776
207094_at IL8RA 199 ± 30 74 ± 8 81 ± 12 82 ± 2 <50 61 ± 9 67 ± 1 90 ± 1 4,784 ± 521
Mono, monocyte; neu, neutrophil.
Genome Biology 2008, Volume 9, Issue 1, Article R17 Robbins et al. R17.7
Genome Biology 2008, 9:R17
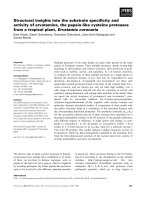
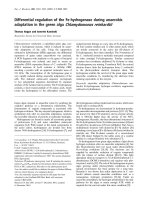
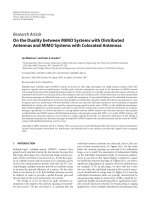
Clustering of mouse and human leukocyte subsetsFigure 1
Clustering of mouse and human leukocyte subsets. Hierarchical clustering with complete linkage was performed on the indicated cell populations isolated
from: (a) mouse, (b) human, and (e) mouse and human. PCA was performed on the indicated cell populations isolated from: (c) mouse and (d) human.
Mono, monocytes; neu, neutrophils.
Principal component 2
Principal component 3
0.3
0.2
0.1
0
-0.1
0.2
-0.2
-0.3
-0.4
-0.6 0 0.4-0.4 -0.2
NK cells
CD4 T
cells
CD8 T
cells
B cells
Neutrophils
Monocytes
pDCs
BDCA1 cDCs
BDCA3 cDCs
m. CD4 T
m. CD8 T
Lymphocytes DCs Myeloid cells
h. CD8 T
h. CD4 T
h. pDC
m. pDC
h. BDCA3
h. BDCA1
m. CD11b
m. CD8
h. mono.
h. neu.
m. CD11b
LymphocytesDCsMyeloid
cells
m. B
m. CD4 T
m. CD8 T
m. NK
m. pDC
m. CD11b
m. CD8
m. CD11b
(a)
Lymphocytes DCs Myeloid
cells
h. B
h. NK
h. CD8 T
h. CD4 T
h. pDC
h. BDCA1
h. BDCA3
h. mono.
h. neu.
(b)
(e)
Myeloid cells
T cells
NK cells
B cells
pDCs
cDCs
(c)
(d)
Principal component 3
Principal component 2
m. B
h. B
h. NK
m. NK
0.8
0.6
0.4
0.2
0
-0.2
-0.4
-0.4 -0.2 0 0.2 0.4 0.6
Genome Biology 2008, 9:R17
Genome Biology 2008, Volume 9, Issue 1, Article R17 Robbins et al. R17.8
LN-DC genes), without taking into account the pattern of
expression of each gene in the other leukocyte subsets as it
may have hidden some degree of similarity between subsets
clustering in the same branch. The results of the analysis of
gene expression focused on DCs confirmed that mouse and
human pDCs cluster together and apart from cDCs (Figure 3).
Importantly, when analyzing the DC datasets alone, mouse
CD8α and human BDCA3 cDCs on the one hand, and mouse
CD11b and human BDCA1 cDCs on the other hand, clustered
together and shared a conserved genetic signature (Figure 3
and Table 6). Thus, although a higher genetic distance is
observed between mouse and human conventional DC
subsets as opposed to pDCs, a partial functional equivalence
is suggested between these cell types. The majority of the
genes conserved between mouse CD8α and human BDCA3
cDCs versus mouse CD11b and human BDCA1 cDCs have
unknown functions and have not been previously described to
exhibit a conserved pattern of expression between these
mouse and human cell types. Notable exceptions are Tlr3
[31,56] and the adhesion molecule Nectin-like protein 2
(Cadm1, also called Igsf4) [57], which have been previously
described to be conserved between mouse CD8α and human
BDCA3 cDCs. When comparing cDC to pDCs, a few genes
already known to reflect certain functional specificities of
these cells when compared to one another are identified. Tlr7
and Irf7 are found preferentially expressed in pDCs over
cDCs, consistent with previous reports that have documented
their implication in the exquisite ability of these cells to pro-
duce high levels of IFN-α/β in response to viruses [58-60].
Ciita, H2-Ob, Cd83 and Cd86 are found preferentially
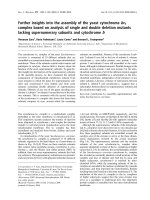
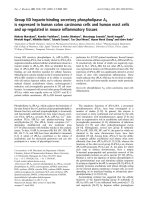
FCM partitional clusteringFigure 2
FCM partitional clustering. FCM partitional clustering was performed on the mouse and human gene chip datasets. (a) FCM partitional clustering for
mouse data. (b) FCM partitional clustering for human data. The color scale for relative expression values as obtained after log
10
transformation and median
centering of the values across cell samples for each gene is given below the heat map.
Myeloid
cells
pan DCs
cDCs
CD8 DCs
CD11b DCs
pDCs
B cells
NK cells
pan T
CD8 T
CD4 T
Neutrophils
Monocytes
BDCA1 DCs
BDCA3 DCs
cDCs
pan DCs
pDCs
B cells
NK cells
pan T
(a)
(b)
sllec TsCD
M
y
e
l
o
i
d
c
e
l
l
s
C
D
8
C
D
1
1
b
p
D
C
s
B
c
e
l
l
s
N
K
c
e
l
l
s
C
D
8
T
C
D
4
T
N
e
u
t
r
o
p
h
i
l
s
B
D
C
A
1
B
D
C
A
3
p
D
C
s
B
c
e
l
l
s
N
K
c
e
l
l
s
C
D
8
T
C
D
4
T
Mo
n
o
c
y
t
e
s
sllec TsCD
-4 0-2 2 4
-4 0-2 2 4
Genome Biology 2008, Volume 9, Issue 1, Article R17 Robbins et al. R17.9
Genome Biology 2008, 9:R17
expressed in cDCs over pDCs, which is consistent with their
higher efficiency for MHC class II antigen presentation and T
cell priming [61].
The functional annotations associated with the genes selec-
tively expressed in specific DC subsets when compared to the
others are listed in Table 7. The most significant clusters of
functional annotations in pDCs point to the specific expres-
sion in these cells of many genes expressed at the cell surface
or in intracellular compartments, including the endoplasmic
reticulum, the Golgi stack, and the lysosome. A cluster of
genes involved in endocytosis/vesicle-mediated transport is
also observed. This suggests that pDCs have developed an
exquisitely complex set of molecules to sense, and interact
with, their environment and to regulate the intracellular
trafficking of endocytosed molecules, which may be
consistent with the recent reports describing different intrac-
ellular localization and retention time of endocytosed CpG
oligonucleotides in pDCs compared to cDCs [62,63]. The
most significant clusters of functional annotations in cDCs
concerns the response to pest, pathogens or parasites and the
activation of lymphocytes, which include genes encoding
TLR2, costimulatory molecules (CD83, CD86), proinflamma-
tory cytokines (IL15, IL18), and chemokines (CXCL9,
CXCL16), consistent with the specialization of cDCs in T cell
priming and recruitment. Clusters of genes involved in
inflammatory responses are found in both pDCs and cDCs.
However, their precise analysis highlights the differences in
the class of pathogens recognized, and in the nature of the
cytokines produced, by these two cell types: IFN-α/β produc-
tion in response to viruses by pDCs through mechanisms
involving IRF7 and eventually TLR7; and recognition and
killing of bacteria and production of IL15 or IL18 by cDCs
through mechanisms eventually involving TLR2 or lys-
ozymes. Many genes selectively expressed in cDCs are
involved in cell organization and biogenesis, cell motility, or
cytoskeleton/actin binding, consistent with the particular
morphology of DCs linked to the development of a high mem-
Table 4
Specific transcriptomic signatures identified in the leukocyte populations studied
Expression ratio (log
2
) of specific genes*
Cell type 3-4 2-3 1-2 0,4-1
Myeloid cells - Steap4; Clec4d; Clec4e; Fpr1 Nfe2; Mpp1; Snca; Ccr1; Slc40a1;
S100a9; Cd14; Tlr4; F5; Fcgr3; Fpr-rs2;
Tlr2; Abhd5; Gca; Atp6v1b2; Ier3; Sod2;
Pilra; Slc11a1
Sepx1; Ninj1; Hp; Sdcbp; Bst1; Ifit1;
S100a8; Adipor1; Bach1; Marcks;
Pira2; Wdfy3; Ifrd1; Fcho2; Csf3r;
C5ar1; Cd93; Snap23; Cebpb; Clec7a;
Yipf4; Hmgcr; Slc31a2; Fbxl5
Pan-DC Flt3 Sh3tc1 Trit1; Bri3bp; Prkra; Etv6; Tmed3;
Bahcc1; Scarb1
cDC - - Arhgap22; Btbd4; Slamf8;
9130211I03Rik; Nav1
C2ta; Avpi1; Spint1; Cs
pDC Epha2; Pacsin1; Zfp521; Sh3bgr Tex2; Runx2; Atp13a2; Maged1;
Tm7sf2; Tcf4; Gpm6b; Cybasc3
Nucb2; Alg2; Pcyox1; LOC637870;
Scarb2; Dnajc7; Trp53i13; Plac8;
Pls3; Tlr7; Ptprs; Bcl11a
B cells Ebf1; Cd19; Klhl14 Bank1; Pax5 Blr1; Ralgps2; Cd79b; Pou2af1;
Fcer2a; Cr2; Cd79a; Fcrla
Ms4a1; Blk; Cd72; Syvn1;
BC065085; Fcrl1; Phtf2; Tmed8; Grap;
Pip5k3; Pou2f2
NK cells - Ncr1 Tbx21; Osbpl5 Rgs3; 1700025G04Rik; Plekhf1; Fasl;
Zfpm1; Edg8; Cd160; Klrd1; Il2rb;
Il18rap; Ctsw; Ifng; Prf1; Sh2d2a;
Llgl2; Gpr178; Prkx; Gab3; Nkg7;
Cst7; Sntb2; Runx3; Myo6; F2r;
Vps37b; Dnajc1; Gfi1
Pan-T cells - Camk4; E430004N04Rik; Trat1 Cxcr6; Tnfrsf25; Ccdc64; Plcg1 Cd3e; Cd5; Lrig1; Cd3g; Ubash3a;
Cd6; Lat; Bcl11b;
Tcf7; Icos
CD8 T cells - Gzmk
CD4 T cells - Ctla4 - Icos; Tnfrsf25; Cd5; Cd28; Trat1
Lymphocytes - - Ablim1; Lax1; D230007K08Rik;
Rasgrp1; Bcl2
Spnb2; Cdc25b; Ets1; Sh2d2a;
Ppp3cc; Cnot6l
Myeloid, B, DC - H2-DMb2; H2-DMb1 C2ta; March1; Aldh2; Bcl11a; Btk Ctsh; H2-Eb1; Cd74; Ctsz; Clic4;
Kynu; 5031439G07Rik; Nfkbie;
Unc93b1
Non-DC Gimap4 -Vps37bLck; Pde3b
*Ratio expressed as Minimum expression among the cell types selected/Maximum expression among all other cell types. Genes already known to be
preferentially expressed in the cell types selected are shown in boldface.
Genome Biology 2008, 9:R17
Genome Biology 2008, Volume 9, Issue 1, Article R17 Robbins et al. R17.10
brane surface for sampling of their antigenic environment
and for the establishment of interactions with lymphocytes.
pDCs and cDCs also appear to express different arrays of
genes involved in signal transduction/cell communication,
transcription regulation and apotosis. A statistically signifi-
cant association with lupus erythematosus highlights the pro-
posed harmful role of pDCs in this autoimmune disease [64].
The mCD11b/hBDCA1 cDC cluster of genes comprises many
genes involved in inflammatory responses and the positive
regulation of the I-kappaB kinase/NF-kappaB cascade. A sta-
tistically significant association with asthma also highlights
the proinflammatory potential of this cell type. Recently, it
has been reported that the mouse CD11b cDC subset is spe-
cialized in MHC class II mediated antigen presentation in
vivo [11]. In support of our findings here that mouse CD11b
cDCs are equivalent to human BDCA1 cDCs, we found that
many of the genes involved in the MHC class II antigen pres-
entation pathway that were reported to be expressed to higher
levels in mouse CD11b cDCs over CD8α cDCs [11] are also
preferentially expressed in the human BDCA1 cDC subset
over the BDCA3 one. These genes include five members of the
Table 5
Selected annotations for the conserved transcriptomic signatures identified for the cell types studied
Cell type* Annotation Genes
Myeloid cells Defense response/response to pest, pathogen or
parasite/inflammatory response
C5ar1, Sod2, Fcgr3, Tlr2, Ccr1, Ifrd1, Csf3r, Clec7a, Bst1, Ifit1,
Clec4e, Tlr4, Clec4d, Cd14, Cebpb, Hp
Response to bacteria or fungi/pattern recognition
receptor activity/C-type lectin
SLC11A1, TLR2, TLR4, CLEC7A, Clec4e, Clec4d
H_tollpathway: Toll-like receptor pathway CD14, TLR2, TLR4
Regulation of cytokine biosynthesis/positive regulation
of TNF-α or IL-6 biosynthesis
Fcgr3, Tlr2, Tlr4, Cebpb, Clec7a
Macrophage activation/mast cell activation/neutrophil
chemotaxis
CD93, TLR4, Fcgr3, Csf3r
Pan-DC Binding ETV6, PRKRA, FLT3, SCARB1, TRIT1, BAHCC1, SH3TC1
cDC Nucleobase, nucleoside, nucleotide and nucleic acid metabolism NAV1, BTBD4, CIITA, SNFT
Molecular function unknown Btbd4, Avpi1, Arhgap22
pDC Transcription cofactor activity Maged1, Bcl11a, Tcf4
Integral to membrane TLR7, EPHA2, TMEPAI, SCARB2, ATP13A2, ALG2, CYBASC3,
TM7SF2, GPM6B, PTPRS
Cellular component unknown Maged1, Sh3bgr, Cybasc3, Alg2, Plac8
B cells MMU04662: B cell receptor signaling pathway/B cell
activation
Cr2, Cd79a, Cd79b, Cd72, Cd19, Blr1, Ms4a1
MMU04640: hematopoietic cell lineage Cr2, Fcer2a, Ms4a1, Cd19
Defense response/response to pest, pathogen or
parasite/humoral immune response
PAX5, POU2F2, CR2, MS4A1, CD72, CD19, POU2AF1, BLR1,
CD79A, CD79B, FCER2
NK cells MMU04650: natural killer cell mediated cytotoxicity/
apotosis
Klrd1, Ifng, Ncr1, Fasl, Prf1, Prf1, Plekhf1
Defense response IL18RAP, CTSW, IFNG, FASLG, CD160, NCR1, PRF1, KLRD1, CST7
Pan-T cells HSA04660: T cell receptor signaling pathway/
immunological synapse
CD3E, ICOS, PLCG1, LAT, CD3G, Trat1
Defense response/immune response Cd5, Icos, Cd3e, Ubash3a, Lat, Trat1, Cd3g
HSA04640: hematopoietic cell lineage CD3E, CD3G, CD5
CD8 T cells No annotations -
CD4 T cells Defense response/immune response Cd28, Icos, Cd5, Ctla4, Trat1
M_ctla4pathway: the co-stimulatory signal during T-cell
activation
Cd28, Icos, Ctla4
Lymphocytes Immune response BCL2, LAX1, ETS1
Myeloid, B, DC Antigen presentation, exogenous antigen via MHC class
II
H2-Eb1, H2-DMb2, H2-DMb1, Cd74
HSA04612: antigen processing and presentation HLA-DRB1, CIITA, CD74, HLA-DMB
Defense response/immune response H2-Eb1, H2-DMb2, H2-DMb1, Bcl11a, Cd74
Non-DC Phosphoric ester hydrolase activity LCK, PDE3B
*The annotations recovered are written in boldface when they correspond to known specificities of the cell subset studied and are thus confirmatory
of the type of analysis performed.
Genome Biology 2008, Volume 9, Issue 1, Article R17 Robbins et al. R17.11
Genome Biology 2008, 9:R17
cathepsin family (Ctsb, Ctsd, Ctsh, Ctss, and Ctsw) as well as
Ifi30 and Lamp1 and Lamp2 (see Additional data file 2 for
expression values). Thus, it is possible that, like the mouse
CD11b cDC subset, human BDCA1 cDCs serve as a subset of
DCs that are specialized in presenting antigen via MHC class
II molecules. It is also noteworthy that mCD11b and hBDCA1
cDCs express high constitutive levels of genes that are known
to be induced by IFN-α/β and that can contribute to cellular
antiviral defense (Oas2, Oas3, Ifitm1, Ifitm2, Ifitm3).
No significant informative functional annotations are found
for the mCD8α/hBDCA3 cDC gene cluster. However, groups
of genes involved in cell organization and biogenesis or in
small GTPase regulator activity are found and the study of
these genes may increase our understanding of the specific
functions of these cells. Mouse CD8α cDCs have been pro-
posed to be specialized for a default tolerogenic function but
to be endowed with the unique ability to cross-present anti-
gen for the activation of naïve CD8 T cells within the context
of viral infection [65]. It will be important to determine
whether this is also the case for hBDCA3 cDCs. From this
point of view, it is noteworthy that hBDCA3 cDCs selectively
express TLR3, lack TLR7 and TLR9, and exhibit the highest
ratio of IRF8 (ICSBP)/TYROBP (DAP12) expression, all of
which have been shown to participate in the regulation of the
balance between tolerance and cross-presentation by mouse
CD8α cDCs [65,66].
Use of leukocyte gene expression compendia to classify
cell types of ambiguous phenotype or function
Interferon-producing killer dendritic cells
A novel cell type has been recently reported in the mouse that
presents mixed phenotypic and functional characteristics of
pDCs and NK cells, IKDCs [15,16]. A strong genetic
relationship between IKDCs and other DC populations was
suggested. However, this analysis was based solely on com-
parison of the transcriptional profile of IKDCs to DCs and not
to other cell populations [15]. As IKDCs were also reported to
be endowed with antigen presentation capabilities [15] and to
be present in mice deficient for the expression of RAG2 and
the common γ chain of the cytokine receptors [16], they have
been proposed to belong to the DC family rather than to be a
subset of NK cells in a particular state of differentiation or
activation. However, IKDCs have been reported to express
many mRNA specific for NK cells and many of their pheno-
typic characteristics that were claimed to discriminate IKDCs
from NK cells [16] are in fact consistent with classical NK cell
features as recently reviewed [67], including the expression of
B220 [68] and CD11c [69,70] (BD/Pharmingen technical
datasheet of the CD11c antibody) [71]. To clarify the genetic
nature of IKDCs, we reanalyzed the published gene chip data
on the comparison of these cells with other DC subsets [15],
together with available datasets on other leukocyte popula-
tions. We thus assembled published data generated on the
same type of microarrays (Affymetrix U74Av2 chips) to build
a second mouse compendium, allowing us to compare the
transcriptomic profile published for the IKDCs (n = 2) with
that of pDCs (n = 2), cDCs (n = 2) [15], CD8α
+
(n = 2), CD4
+
(n = 2) or double-negative (n = 2) cDC subsets [56], NK cells
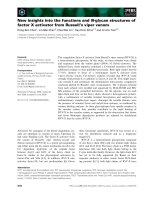
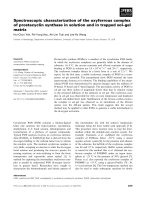
Conserved genetic signatures between mouse and human DC subsetsFigure 3
Conserved genetic signatures between mouse and human DC subsets.
Hierarchical with complete linkage clustering was performed on the
indicated DC populations isolated from mouse and human.
pDC
(228)
(53)
mCD8α
huBDCA3
(21)
m CD11b
huBDCA1
(111)
h. pDC
m. pDC
h. BDCA3
h. BDCA1
m. CD11b
m. CD8
2-2 0-1 1
Genome Biology 2008, 9:R17
Genome Biology 2008, Volume 9, Issue 1, Article R17 Robbins et al. R17.12
[72], CD4 T cells (n = 2), and B1 (n = 2) and B2 (n = 2) cells
[18]. Information regarding the original sources and the pub-
lic accessibility of the corresponding datasets are given in
Table 1. As depicted in Figure 4a, the hierarchical clustering
with complete linkage results of these data sets, together with
our novel 430 2.0 data, clearly show that IKDCs cluster with
NK cells, close to other lymphocytes, and not with DCs.
Indeed, IKDCs express the conserved genetic signature of NK
cells but not of DCs (Table 8 and Additional data file 4). Thus,
these results strongly support the hypothesis that the cells
described as IKDCs feature a specific subset of mouse NK
cells that are in a particular differentiation or activation sta-
tus, rather than a new DC subset.
Table 6
Conserved specific transcriptomic signatures of DC subsets compared to one another
Expression ratio (log
2
) of specific genes*
Cell type >4 3-4 2-3 1-2 0,4-1
pDC Pacsin1; Sla2;
2210020M01Rik
- Epha2; Sh3bgr; Ets1;
Cobll1; Blnk; Myb; Sit1;
Zfp521; Nucb2; Igj;
Stambpl1; Ptprcap;
Spib; Glcci1; Syne2;
Ahi1; Atp13a2; Tcf4;
Lair1
Runx2; LOC637870;
Hs3st1; Asph; L3mbtl3;
Tex2; Nrp1; Npc1;
Maged1; Tm7sf2; Igh-6;
Csf2rb2; Ccr2; Cdk5r1;
Fcrla; Rnasel; Arid3a;
Rassf8; Tgfbr3; Tlr7;
Trp53i11; Ltb4dh;
Arhgap24; Creb3l2; Itpr2;
Bcl11a; Usp11; Gpm6b;
Snx9; Hivep1; Irf7; Cnp1;
Cybasc3; Pcyox1; Aacs
Ifnar2; Ugcg; Kmo; Tspan31; Xbp1; Alg2;
Txndc5; Abca5; Carhsp1; Ptp4a3; Lypla3;
Cxxc5; Sema4c; Vamp1; Klhl9; BC031353;
Cybb; Scarb2; Card11; Cdkn2d;
4931406C07Rik; Gimap8; Plxdc1; Lman1;
4631426J05Rik; Tcta; Mgat5; Ern1; Atp8b2;
Lrrc16; Cln5; Rexo2; Atp2a3; Tspyl4; Anks3;
Slc23a2; Gata2; Trp53i13; Slc44a2;
Tmem63a; Dnajc7; Rhoh; Daam1; Lancl1;
Aff3; Chst12; Unc5cl; Rwdd2; Armcx3;
Vps13a; Mcoln2; Tm7sf3; Stch; Glt8d1; Pscd4;
Ormdl3; 1110028C15Rik; Snag1; Prkcbp1;
Klhl6; Cbx4; Pcmtd1; Bet1; Ccs; Tceal8;
Dpy19l3; Pcnx; LOC672274; Sec11l3; Ctsb;
Slc38a1; Ostm1; Acad11; Zbtb20;
1110032A03Rik; Ralgps2; Dtx3; Pls3; Ptprs;
Zdhhc8; Rdh11; Bcl7a; Tbc1d2b
cDC - 9130211I03Rik;
Hnrpll; Fgl2; Id2;
Slamf8
Chn2; Ddef1; Havcr2;
A530088I07Rik;
Rab32; Adam8;
2610034B18Rik;
Dusp2; Btbd4; Pak1;
Bzrap1; Anpep;
Apob48r; Aif1
Arrb1; H2-Ob; Arhgap22;
Aytl1; 2810417H13Rik;
Pik3cb; Nav1; Acp2;
Tnfaip2; Tspan33; Ralb;
Marcks; Epb4.1l2; Rab31;
Aim1; Cias1; Cd86; Cdca7;
Rin3; Hk2; Actn1; Snx8;
Cd1d1; Cxcl9; Sestd1;
Anxa1; Il15; Ahr; Myo1f;
Avpi1; Pde8a; Stom; Spint1;
Kit; 1100001H23Rik;
Specc1; Bcl6; Tpi1; Kcnk6;
Efhd2; Cxcl16; Ddb2;
C2ta; Tgif; Pfkfb3; Ptpn12;
Pitpnm1; Rtn1; Maff; Sgk;
BB220380; Tes; Elmo1;
Tm6sf1; Mast2; Stx11;
Dhrs3; Tlr2
Il18; Vasp; Ppfibp2; Itfg3; Wdfy3; Atad2; Hck;
Cnn2; BC039210; Lima1; Fhod1; Klhl5; Flna;
Egr1; Mrps27; Gas2l3; Atp2b1; Gypc; Lst1;
8430427H17Rik; Lmnb1; Junb; Irf2; Soat1;
Cd83; Spg21; Nab2; Rbpsuh; Tiam1; Spfh1;
Gemin6; Entpd1; Lzp-s; Lyzs; Slc8a1; Dusp16;
Plscr1; Ptcd2; Slc19a2; Mthfd1l; Copg2; Dym;
Limd2; Bag3; Csrp1; Ppa1; Nr4a2; Snx10;
Hmgb3; Plekhq1; Oat; Rgs12; Numb; Hars2;
Pacs1; Gtdc1; Ezh2; Swap70; Rasgrp4; Asahl;
Susd3; Lrrk2; Sec14l1; Asb2; Txnrd2;
E330036I19Rik; Sla; Fscn1; Nr4a1; Inpp1;
Tdrd7; 4933406E20Rik; Usp6nl
mCD8 and
hBDCA3
- Clnk Gcet2; BC028528;
Igsf4a
sept3; Sema4f; Fkbp1b;
Tlr3; Lima1; Dbn1;
Plekha5; Fuca1; Fgd6;
Snx22; Gfod1
Rasgrp3; Btla; Asahl; 4930506M07Rik; Lrrc1;
1700025G04Rik; Tspan33; Fnbp1; Itga6;
Zbed3; 9030625A04Rik; Rab32; Ptcd2;
Gas2l3; Rab11a; Ptplb; Cbr3; Pqlc2; Slamf8;
St3gal5; 4930431B09Rik; Dock7; Stx3;
Csrp1; Nbeal2; Gnpnat1; Slc9a9; Ncoa7
mCD11b
and
hBDCA1
- - Il1rn; Papss2; Pram1 Il1r2; Oas3; Rin2; Ptgs2;
Csf1r; Tlr5; Centa1; Pygl;
Igsf6; Csf3r; Tesc; Ncf2;
S100a4; Rtn1; Cst7; Car2;
Ifitm1; 1810033B17Rik;
Lrp1; Dennd3; Ifitm3
Gbp2; Oas2; Ccl5; Pilra; Sirpa; Pla2g7; Ifitm2;
Ms4a7; Cdcp1; Nfam1; BC013672; Slc7a7;
Ripk2; Map3k3; Ripk5; Lactb; Rsad2; Parp14;
D930015E06Rik; Gyk; Ank; Atp8b4; Emilin2;
Arrdc2; Slc16a3; Fcgr3; Clec4a2; Ksr1; Itgax;
Sqrdl; Hdac4; Rel; Pou2f2; Chka; Lyst; Ubxd5;
Jak2; Cd300a; Lst1; Ssh1; Casp1;
D12Ertd553e; Ogfrl1; Rin3; Cd302; Pira2
*Ratio expressed as Minimum expression among the cell types selected/Maximum expression among all other cell types. Genes already known to be
preferentially expressed in the cell types selected are shown in boldface.
Genome Biology 2008, Volume 9, Issue 1, Article R17 Robbins et al. R17.13
Genome Biology 2008, 9:R17
Lineage
-
CD16
+
HLA-DR
+
cells
A subset of leukocytes characterized as lineage
-
CD16
+
HLA-
DR
+
(hereafter referred to as CD16 cells) has been reported in
human blood, and claimed to be a subpopulation of DCs
based on their antigen-presentation capabilities. This subset
segregates apart from BDCA1 and BDCA3 DCs and pDCs
upon gene expression profiling [31]. It is not found in signifi-
cant amounts in secondary lymphoid organs of healthy
Table 7
Selected annotations for the conserved transcriptomic signatures identified for DC subsets when compared to one another
Cell type Annotation Genes
pDC Endoplasmic reticulum Ern1, Lman1, Txndc5, Rdh11, Tm7sf2, Asph, Ormdl3, Stch, Nucb2,
Ugcg, Itpr2, Bet1, Sec11l3, Atp2a3
Golgi stack BET1, HS3ST1, CHST12, SNAG1, LMAN1, MGAT5, GLCCI1, Pacsin1
Lysosome Lypla3, Npc1, Scarb2, Ctsb, Pcyox1, Cln5
Endocytosis/vesicle-mediated transport Bet1; Gata2; Igh-6; Lman1; Npc1; Pacsin1; Vamp1
Integral to plasma membrane EPHA2, SCARB2, CSF2RB, SIT1, ATP2A3, IFNAR2, VAMP1, PTPRS,
SLC23A2, PTPRCAP, LANCL1, TM7SF2, CCR2, TSPAN31
Inflammatory response TLR7, CYBB, IRF7, CCR2, BLNK
Intracellular signaling cascade/I-κB kinase/NF-κB cascade SNAG1, SLC44A2, TMEPAI, CARD11, ERN1, SLA2, IFNAR2, CARHSP1,
SNX9, RALGPS2, CXXC5, CCR2, BLNK, RHOH
Regulation of transcription, DNA-dependent/DNA binding/
transcription regulator activity/RNA polymerase II transcription
factor activity/IPR004827: Basic-leucine zipper (bzip) transcription
factor
1110028C15Rik; Aff3; Anks3; Arid3a; Bcl11a; Carhsp1; Cbx4; Cdkn2d;
Creb3l2; Cxxc5; Ern1; Ets1; Gata2; Hivep1; Ifnar2; Irf7; Maged1; Myb;
Nucb2; Prkcbp1; Runx2; Sla2; Spib; Tcf4; Tspyl4; Xbp1; Zbtb20
Systemic lupus erythematosus LMAN1, CCR2, ETS1
Regulation of apoptosis CDK5R1, CARD11, ERN1, CBX4, TXNDC5, CTSB
cDC Response to pest, pathogen or parasite/defense response/immune
response/response to stress/inflammatory response/cytokine
biosynthesis/response to bacteria/lymphocyte activation
ANXA1; NR4A2; CIAS1; TLR2; CD83; CD86; IL18; CXCL16; MAST2;
AIF1; CIITA; SNFT; Lzp-s, Lyzs; ENTPD1; CXCL9; PLSCR1; BCL6; SGK;
TXNRD2; DDB2; AHR; IRF2; LST1; SOAT1; HLA-DOB; CD1D; IL15;
Rbpsuh; Swap70; Hmgb3; Egr1
Cytoskeleton/actin binding/filopodium/cell motility FLNA; FHOD1; CNN2; MYO1F; ACTN1; VASP; EPB41L2; FSCN1;
KLHL5; MARCKS; Epb4,1l2; Mast2; Aif1; Csrp1; Elmo1; LIMA1;
LMNB1; STOM; Nav1, CXCL16, ANXA1
Morphogenesis/cell organization and biogenesis/neurogenesis Rasgrp4; Myo1f; Aif1; Pak1; Pacs1; Vasp; Tiam1; Lst1; Cnn2; Numb;
Csrp1; Fhod1; Nav1; Rab32; Stx11; Ezh2; Epb4,1l2; Flna; Acp2; Elmo1;
Ralb; Rab31; Id2; Tnfaip2; Txnrd2; Anpep; Il18; Rbpsuh, Nr4a2; Spint1
Signal transduction/cell communication/MMU04010:MAPK signaling
pathway/regulation of MAPK activity/GTPase regulator activity/
small GTPase mediated signal transduction/IPR003579:Ras small
GTPase, Rab type
ADAM8; AHR; ANXA1; ARRB1; Asb2; Avpi1; CD83; CD86; Chn2;
CIAS1; CXCL9; Dusp16; DUSP2; Elmo1; ENTPD1; FLNA; Hck; IL15;
IL18; INPP1; Kit; Lrrk2; Mast2; NR4A1; NR4A2; PAK1; PDE8A; PIK3CB;
PPFIBP2; Rab31; Rab32; Ralb; Rasgrp4; RBPSUH; RGS12; Rin3; RTN1;
Sla; SLC8A1; Snx10; Snx8; Tiam1; TLR2; Arhgap22; Ddef1; Rgs12;
Usp6nl
Transcription regulator activity Junb, Id2, Asb2, Ddef1, Irf2, Nr4a2, C2ta, Nab2, Egr1, Nr4a1, Ahr,
9130211I03Rik, Tgif, Rbpsuh, Bcl6
Apoptosis Ahr, Nr4a1, Il18, Bag3, Cias1, Elmo1, Cd1d1, Sgk, Bcl6
mCD8
and
hBDCA3
Cell organization and biogenesis DBN1, RAB32, ITGA6, FGD6, RAB11A, SEMA4F
Intracellular signaling cascade/small GTPase mediated signal MIST, TLR3, SNX22; DOCK7; FGD6; RAB11A; RAB32; RASGRP3; sep3
mCD11b
and
hBDCA1
Immune response/defense response/inflammatory response/positive
regulation of cytokine production/response to pest, pathogen or
parasite/antimicrobial humoral response/IPR006117:2-5-
oligoadenylate synthetase
IFITM3, PTGS2, POU2F2, LST1, GBP2, CCL5, OAS2, FCGR2A, NCF2,
CSF1R, TLR5, CSF3R, IL1R2, CST7, IL1RN, NFAM1, IFITM2, IFITM1,
LILRB2, OAS3, LYST, CLEC4A, IGSF6, HDAC4, PLA2G7, RIPK2, OAS2,
OAS3; Rel; Fcgr3
Signal transduction/cell communication/signal transducer activity/
positive regulation of I-κB kinase/NF-κB cascade/protein-tyrosine
kinase activity/IPR003123:Vacuolar sorting protein 9;
vesicle-mediated transport; endocytosis
CASP1; CCL5; CD300A; CD302; CENTA1; CHKA; CLEC4A; CSF1R;
CSF3R; FCGR2A; IFITM1; IGSF6; IL1R2; IL1RN; ITGAX; JAK2; KSR1;
LILRB2; LRP1; LYST; MAP3K3; MS4A7; NFAM1; OGFRL1; REL; RIN2;
RIN3; RIPK2; RIPK5; RTN1; TLR5; Fcgr3
Chemotaxis/cell adhesion ITGAX, CD300A, CSF3R, EMILIN2, CLEC4A, CCL5, Fcgr3
HSA04640:hematopoietic cell lineage CSF1R, CSF3R, IL1R2
Asthma. Atopy PLA2G7, CCL5,
Genome Biology 2008, 9:R17
Genome Biology 2008, Volume 9, Issue 1, Article R17 Robbins et al. R17.14
donors, contrary to pDCs and BDCA1 or BDCA3 cDCs. It
expresses specific pattern recognition receptors, such as
TLR4 and TLR8, and chemokine receptors, such as CX3CR1
and CMKOR1 [31], which were initially described to be pref-
erentially expressed by monocytes in humans [73]. As the
transcriptional relationship of CD16 cells with other known
DC populations was originally established based solely on the
transcriptional profile of DCs, we sought to better understand
the nature of these cells. For this, we reanalyzed the global
gene expression profile of CD16 cells in comparison to not
only DC subsets but also to monocytes, neutrophils, and lym-
phocytes. The results depicted in Figure 4b clearly show that
the CD16 cells cluster with neutrophils and monocytes and
not with LN-DCs. Indeed, we find many genes that are
expressed to much higher levels in monocytes or neutrophils
and CD16 cells than in LN-DC subsets (Table 9 and
Additional data file 2). Interestingly, MAFB, which has been
described to inhibit the differentiation of DCs but to promote
that of macrophages from hematopoeitic precursors [74], is
expressed to much higher levels in CD16 cells and monocytes
compared to DCs (average signal intensity of 6,263 in CD16
cells compared to 3,479 in monocytes, 65 in pDCs, 309 in
BDCA1 DCs and <50 in BDCA3 DCs). CD16 cells also express
to high levels many genes that are absent or only expressed to
very low levels in LN-DCs compared to both lymphoid and
myeloid cells, in particular many members of the gimap fam-
ily. Reciprocally, many of the genes characterized above as
specifically expressed in human and mouse LN-DCs are
absent or expressed only to low levels in CD16 cells, in partic-
ular FLT3 and SCARB1. Thus, CD16 cells likely differentiate
along the canonical myeloid lineage rather than belong to the
LN-DC family. However, many genes are also specifically
expressed to much higher levels in LN-DC subsets and CD16
cells than in monocytes, neutrophils and lymphocytes, attest-
ing to the existence of biological functions common, and spe-
cific, to DC subsets and CD16 cells. Thus, these results
strongly suggest that CD16 cells represent a particular subset
of monocytes endowed with DC-like properties. One
possibility is that CD16 cells are the naturally occurring equiv-
alents of the 'monocyte-derived DCs' generated in vitro.
In vitro GM-CSF derived DCs
In vitro derived GM-CSF DCs are the most commonly used
model to analyze DC biology. They are often used to investi-
gate the interaction between DCs and other cell types or with
pathogens, both in mouse (bone marrow (BM)-derived GM-
CSF DCs) and human (monocyte-derived GM-CSF DCs).
However, the relationship between these in vitro GM-CSF-
derived DCs and the LN-DC subsets present in vivo in the
steady state is not clear. A very recent publication suggests
that in vitro derived GM-CSF mouse DCs may correspond to
the DCs that differentiate from Ly6C
+
monocytes in vivo only
under inflammatory conditions and appear specialized in the
production of high levels of tumor necrosis factor-α and
inducible nitric oxide synthase in response to intracellular
bacteria, therefore differing from LN-DCs according to both
ontogenic and functional criteria [75]. To gain further
insights into the relationship between monocytes,
macrophages, LN-DCs, and in vitro derived GM-CSF DCs, we
thus compared their global gene expression profiling in both
human and mouse, using publicly available gene chip data.
Information regarding the original sources and the public
accessibility of the corresponding datasets are given in Table
1. The results depicted in Figure 5 clearly show that the in
vitro derived GM-CSF DCs cluster with monocytes and mac-
rophages and not with the LN-DCs. This result was further
confirmed by PCA, which also showed that both mouse and
human GM-CSF DCs are close to macrophages, and distant
from LN-DCs (Additional data file 6). Indeed, we found many
genes that are expressed to much higher levels in monocytes,
macrophages and in vitro derived GM-CSF DCs than in LN-
DC subsets (Tables 10 and 11). As for human CD16 cells, these
genes include the transcription factor Mafb. Reciprocally,
some of the genes identified in this study as specific to LN-
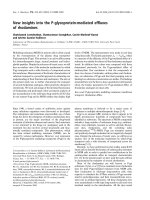
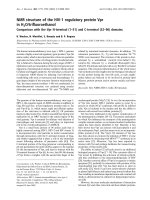
Clustering of mouse IKDCs and human CD16 cellsFigure 4
Clustering of mouse IKDCs and human CD16 cells. Hierarchical clustering
with complete linkage was performed on the indicated cell populations
isolated from: (a) mouse and (b) human. Mono, monocytes; neu,
neutrophils.
m. B2
m. CD4 T
m. NK
m. pDC
m. IKDC
m. CD8
m. CD8
m. DN
m. CD4
m. CD11b
m. pDC
m. cDC
m. CD4 T
m. B1
m. B
m. NK
LymphocytesDCs
NK
(a)
h. B
h. NK
h. CD8 T
h. CD4 T
h. pDC
h. BDCA1
h. BDCA3
h. mono.
h. neu.
h. CD16
Lymphocytes
DCs Myeloid
cells
(b)
Genome Biology 2008, Volume 9, Issue 1, Article R17 Robbins et al. R17.15
Genome Biology 2008, 9:R17
cDCs are expressed only to much lower levels in GM-CSF
DCs. However and interestingly, compared to monocytes, in
vitro derived GM-CSF DCs harbor stronger levels of other
lymph node resident cDC-specific genes, including scarb1,
snft/9130211l03Rik, spint1, ctsh, C22ORF9/
5031439G07Rik, and bri3bp. Thus, in vitro derived GM-CSF
DCs seem to harbor a strong myeloid gene signature but also
express some of the LN-DC-specific genes, consistent with
their myeloid ontogeny and their ability to exert myeloid-type
functions but also with their acquisition of DC functional
properties. In conclusion, our gene chip data analysis is
consistent with a very recent report suggesting that in vitro
derived GM-CSF mouse DCs correspond to inflammatory
DCs and differ greatly from LN-DCs [75]. Indeed, several
papers have recently established that in vitro derived FLT3-L
DCs constitute the true equivalent of LN-DCs and constitute
the only proper surrogate model currently available for their
study [75-77].
Discussion
By performing meta-analyses of various datasets describing
global gene expression of mouse spleen and human blood
leukocyte subsets, we have been able to identify for the first
time conserved genetic programs common to human and
mouse LN-DC subsets. All the LN-DC subsets examined here
are shown to share selective expression of several genes, while
Table 8
Expression of APC, DC and NK signature genes in IKDCs
Ratio
Probe set ID Gene CD8 DC DN DC CD4 DC pDC cDC IKDC NK IKDC/DC NK/DC IKDC/NK
APC signature genes
98035_g_at H2-DMb1 2,701* 3,416 4,281 1,105 2,722 179 36 0.2 <0.1 5
92668_at Btk 454 259 331 252 277 91 20 0.4 <0.1 5
94834_at Ctsh 1,606 2,650 2,862 2,993 1,653 129 20 0.1 <0.1 6
94285_at H2-Eb1 8,183 7,761 7,201 5,285 14,120 1,018 74 0.2 <0.1 14
101054_at Cd74 9,094 7,810 7,313 5,158 12,258 1,031 55 0.2 <0.1 19
92633_at Ctsz 520 1,246 1,171 887 750 117 44 0.2 <0.1 3
94256_at Clic4 1,668 1,067 1,234 739 717 440 295 0.6 0.4 1
160781_r_at Unc93b1 683 710 789 301 138 36 22 0.3 0.2 2
Pan-DC signature genes
95295_s_at Flt3 2,769 2,004 2,231 2,069 2,547 270 45 0.1 <0.1 6
100095_at Scarb1 716 405 333 297 398 125 73 0.4 0.2 2
Non-DC signature genes
96172_at Gimap4 29 62 20 314 319 5,274 982 263 49 5
92398_at Vps37b 111 139 44 76 56 462 159 11 4 3
161265_f_at Lck 99 80 105 235 199 1,991 366 25 5 5
NK signature genes
97781_at Ncr1 20 20 20 73 39 1,483 120 20 2 12
97113_at Fasl 20 28 20 22 30 440 263 15 9 2
102272_at Cd160 75 107 62 82 58 780 246 7 2 3
100764_at Il2rb 26 45 40 50 65 84 501 1 8 0.2
99334_at Ifng 20 20 20 29 38 203 109 5 3 2
93931_at Prf1 33 21 35 94 86 839 1,287 9 14 1
92398_at Vps37b 111 139 44 76 56 462 159 11 4 3
Table 9
Expression of APC, DC and myeloid signature genes in CD16 cells
Dendritic cells Myeloid cells Ratio to DC
Genome Biology 2008, 9:R17
Genome Biology 2008, Volume 9, Issue 1, Article R17 Robbins et al. R17.16
Probe set ID Gene BDCA1 BDCA3 pDC Mono Neu CD16 cells CD16 Mono Neu
APC signature genes
203932_at HLA-DMB 8,636* 7,929 5,894 5,194 173 2,581 0.3 0.6 <0.1
205101_at CIITA 2,803 2,354 724 531 50 226 <0.1 0.2 <0.1
219574_at MARCH1 587 777 544 1,214 58 810 1 2 <0.1
201425_at ALDH2 9,279 7,841 6,034 8,504 706 1,760 0.2 0.9 <0.1
222891_s_at BCL11A 569 747 4,502 310 50 213 <0.1 <0.1 <0.1
205504_at BTK 1,120 822 1,132 1,409 281 1,786 2 1 0.3
202295_s_at CTSH 6,197 2,528 1,211 3,949 75 2,440 0.39 0.6 <0.1
213831_at DQA1 11,535 7,503 5,919 4,701 50 252 <0.1 0.4 <0.1
215536_at DQB2 432 391 157 180 81 52 0.1 0.4 0.2
209312_x_at DRB1 14,608 14,477 13,250 11,915 228 14,007 1 0.8 <0.1
209619_at CD74 12,533 12,210 10,498 9,020 867 7,383 0.6 0.7 <0.1
210042_s_at CTSZ 906 848 692 370 153 673 0.7 0.4 0.2
201560_at CLIC4 920 305 663 3,023 165 354 0.4 3 0.2
217388_s_at KYNU 2,414 1,059 2,204 3,516 50 3,738 2 1 <0.1
203927_at NFKBIE 529 272 232 197 63 290 0.5 0.4 0.1
220998_s_at UNC93B1 966 850 1,938 862 449 1,235 0.6 0.4 0.2
Pan-DC signature genes
206674_at FLT3 3,032 5,883 2,169 208 <50 <50 <0.1 <0.1 <0.1
219256_s_at SH3TC1 1,263 899 1,128 392 166 858 0.7 0.3 0.1
218617_at TRIT1 1,159 1,246 1,851 509 <50 339 0.2 0.3 <0.1
231810_at BRI3BP 691 735 836 298 146 279 0.3 0.4 0.2
209139_s_at PRKRA 846 1,067 1,440 316 74 497 0.3 0.2 <0.1
225764_at ETV6 2,172 2,432 1,726 1,143 938 941 0.4 0.5 0.4
208837_at TMED3 1,317 1,852 1,859 665 <50 1,022 0.6 0.4 <0.1
219218_at BAHCC1 87 86 250 <50 <50 <50 0.2 0.2 0.2
1552256_a_at SCARB1 325 425 942 165 128 59 <0.1 0.2 0.1
Non-DC signature genes
219243_at GIMAP4 68 <50 <50 4,404 3,504 1,334 20 65 52
221704_s_at VPS37B 54 <50 <50 593 962 487 9 11 18
204891_s_at LCK <50 <50 <50 92 181 65 - - -
214582_at PDE3B 78 <50 <50 129 625 114 1 2 8
Myeloid signature genes
225987_at STEAP4 <50 <50 <50 877 6,090 <50 - - -
1552773_at CLEC4D <50 <50 <50 452 520 <50 - - -
222934_s_at CLEC4E 214 124 133 2,837 5,885 229 1 13 28
202974_at
MPP1 591 281 377 3,721 2,408 1,341 2 6 4
205098_at CCR1 93 <50 115 3,712 3,627 106 1 32 31
223044_at SLC40A1 769 276 321 5,018 3,444 <50 - 6 4
224341_x_at TLR4 94 <50 <50 1,411 2,869 540 6 15 31
204714_s_at F5 <50 <50 <50 1,392 2,313 <50 - - -
203561_at FCGR2A 1,010 44 51 2,985 7,151 2,857 3 3 7
210772_at FPRL1 <50 <50 <50 389 3,454 70 3 - -
204924_at TLR2 904 211 57 2,870 5,548 1,606 2 3 6
215223_s_at SOD2 1,474 946 528 3,528 7,599 4,236 3 2 5
222218_s_at PILRA 1,168 150 136 2,899 4,035 3,982 3 2 3
210423_s_at SLC11A1 81 60 38 1,767 2,930 3,334 41 22 36
203045_at NINJ1 357 66 71 1,104 3,129 1,934 5 3 9
201669_s_at MARCKS 521 389 <50 2,449 3,224 1,730 3 5 6
207697_x_at LILRB2 1,271 78 774 3,353 3,711 4,903 4 3 3
1553297_a_at CSF3R 1,902 409 156 3,433 6,687 282 0.2 2 4
220088_at C5AR1 56 34 93 2,316 5,099 3,824 41 25 55
221698_s_at CLEC7A 3,229 4,295 79 6,642 7,061 5,680 1 2 2
204204_at SLC31A2 442 187 <50 1,579 2,047 1,671 4 4 5
*Average expression across replicates. Mono, monocyte; neu, neutrophil.
Table 9 (Continued)
Expression of APC, DC and myeloid signature genes in CD16 cells
Genome Biology 2008, Volume 9, Issue 1, Article R17 Robbins et al. R17.17
Genome Biology 2008, 9:R17
Table 10
Comparison of the transcriptome of human GM-CSF monocyte-derived DCs to that of blood DCs
Ratio to monocytes
Probe set ID Name Mono PBMC-MΦ mo-MΦ mo-DC CD16 BDCA3 BDCA1 pDCs
Myeloid signature genes
222934_s_at CLEC4E 2,358 0.20 0.19 0.04 - - 0.05 -
209930_s_at NFE2 823 0.06 0.06 0.89 0.10 - 0.06 -
202974_at MPP1 3,622 0.40 1.25 0.68 0.33 0.08 0.15 0.11
205098_at CCR1 3,528 0.76 1.63 1.83 0.03 - 0.03 0.03
203535_at S100A9 11,192 0.05 0.37 0.01 0.12 0.02 0.17 0.01
201743_at CD14 8,096 0.44 1.13 0.34 0.01 - 0.02 0.01
224341_x_at TLR4 1,417 0.13 1.10 0.35 0.34 - 0.06 -
203561_at FCGR2A 2,946 0.18 0.80 1.36 0.85 - 0.33 0.02
204924_at TLR2 3,220 0.14 0.80 0.32 0.54 0.08 0.31 0.02
218739_at ABHD5 285 0.35 0.99 0.67 0.33 - - -
201089_at ATP6V1B2 3,178 2.05 2.46 1.70 0.66 0.12 0.34 0.21
201631_s_at IER3 2,042 0.42 1.74 0.82 0.10 0.06 0.14 0.12
222218_s_at PILRA 2,709 0.73 1.24 1.23 1.25 0.05 0.39 0.05
210423_s_at SLC11A1 1,713 0.47 0.82 0.25 1.75 0.04 0.05 -
203045_at NINJ1 1,190 1.69 3.59 3.41 1.59 0.27 0.44 0.26
200958_s_at SDCBP 11,323 0.87 1.16 0.90 0.61 0.33 0.40 0.26
202917_s_at S100A8 15,661 0.02 0.41 0.01 0.11 0.01 0.27 0.03
217748_at ADIPOR1 2,229 0.57 0.48 1.16 0.30 0.30 0.36 0.28
201669_s_at MARCKS 2,340 0.84 2.57 1.57 0.65 0.16 0.20 -
207697_x_at LILRB2 3,260 0.29 0.64 0.76 1.36 0.02 0.39 0.24
228220_at FCHO2 619 4.50 4.04 3.62 0.76 0.35 0.26 0.23
1553297_a_at CSF3R 3,121 0.42 0.69 0.37 0.08 0.11 0.52 0.04
220088_at C5AR1 2,059 2.56 3.63 1.30 1.60 - 0.03 0.04
212501_at CEBPB 3,490 3.26 3.23 3.30 1.26 0.06 0.49 0.06
221698_s_at CLEC7A 6,596 0.24 0.55 0.63 0.74 0.62 0.46 0.01
209551_at YIPF4 526 0.85 1.65
1.91 0.41 0.37 0.44 0.37
204204_at SLC31A2 1,933 0.94 1.14 0.69 0.76 0.10 0.22 0.03
Pan-DC signature genes
206674_at FLT3 221 - - - - 24.01 12.76 9.26
219256_s_at SH3TC1 395 1.02 2.73 1.12 2.01 2.22 3.01 2.86
218617_at TRIT1 498 0.49 0.58 0.86 0.71 2.46 2.15 3.61
231810_at BRI3BP 301 0.98 1.42 1.99 0.98 2.35 2.10 2.70
209139_s_at PRKRA 325 1.12 1.77 1.47 1.57 3.17 2.42 4.37
225764_at ETV6 1,097 0.43 1.13 2.00 0.75 2.04 1.78 1.48
208837_at TMED3 595 1.50 2.81 1.64 1.46 2.91 1.98 2.94
219218_at BAHCC1 - - - - - >1.7 >1.5 >4.7
1552256_a_at SCARB1 151 8.98 6.58 7.21 - 2.33 1.70 5.30
cDC signature genes
206298_at ARHGAP22 - >5.8 >6.5 >3.1 - >6.2 >4.6 -
227329_at BTBD4 - >1.6 >2.8 >5.8 - >9.3 >8.7 -
219386_s_at SLAMF8 98 24.75 38.66 23.99 0.51 15.48 5.30 0.51
220358_at SNFT 148 0.62 0.34 8.62 5.66 16.01 4.82 0.34
224772_at NAV1 64 2.01 3.25 1.40 2.00 23.87 10.50 1.62
205101_at CIITA 481 0.29 0.12 1.09 0.48 4.51 5.28 1.43
Genome Biology 2008, 9:R17
Genome Biology 2008, Volume 9, Issue 1, Article R17 Robbins et al. R17.18
harboring only low levels of other transcripts present in all
other leukocytes. These analyses indicate that LN-DCs,
including pDCs, constitute a specific family of leukocytes,
distinct from those of classic lymphoid or myeloid cells. Fur-
thermore, we demonstrate a striking genetic proximity
between mouse and human pDCs, which are shown for the
first time to harbor a very distinct transcriptional signature as
large and specific as that observed for NK cells or T cells. In
contrast, a higher genetic distance is observed between
mouse and human conventional DC subsets, although a par-
tial functional equivalence is suggested between mCD8α and
hBDCA3 cDCs on the one hand versus mCD11b and hBDCA1
cDCs on the other hand.
Our finding that LN-DCs constitute a distinct entity within
immune cells raises the question of whether these cells form
a distinct lineage in terms of ontogeny, or whether their
shared gene expression profile (notably that between cDCs
and pDCs) reflects a functional rather than a developmental
similarity. To date, the place of both cDCs and pDCs in the
hematopoietic tree is not clear [78,79]. A BM progenitor,
named macrophage and dendritic cell progenitor (MDP), has
been recently identified that specifically gives rise to mono-
cytes/macrophages and to cDCs, but not to polymorphonu-
clear cells or to lymphoïd cells [80,81]. Under the
experimental conditions used in the corresponding report,
pDCs were not detected in the progeny of MDPs. Here, we
show that the transcriptome programs of mouse spleen and
human blood cDCs exhibit only a very limited overlap with
that of monocytes/macrophages (Figure 2). This is consistent
with the recent observation that monocytes can give rise to
mucosal, but not splenic, cDCs, suggesting that splenic cDCs
develop from MDPs without a monocytic intermediate [81].
While mouse pDCs have been argued to arise from both lym-
phoid or myeloid progenitors, their gene expression overlaps
with lymphoid or myeloid cells are limited. Interestingly, a
murine progenitor cell line that exhibits both cDC and pDC
differentiation potential has been described recently [82],
suggesting that putative pan-DC progenitors might also exist
in vivo, which would be consistent with the gene profiling
analyses presented here.
Our study identifies transcriptional signatures conserved
between mouse and human, common to all LN-DC subsets
examined, or specific to pDCs, cDCs, or individual cDC
subsets. A genetic equivalence is suggested between mouse
218631_at AVPI1 - >18.7 >31.3 >64.8 >1.6 >3.2 >7.0 -
202826_at SPINT1 84 4.65 7.15 8.79 0.90 2.59 2.92 0.68
208660_at CS 1,848 1.24 0.99 1.04 0.84 1.70 1.63 0.89
APC signature genes
203932_at HLA-DMB 5,137 1.28 0.64 1.37 0.44 1.45 1.62 1.14
219574_at MARCH1 1,133 0.42 0.89 0.73 0.62 0.64 0.44 0.46
201425_at ALDH2 8,782 0.51 0.54 0.34 0.18 0.84 1.01 0.69
222891_s_at BCL11A 310 0.98 0.34 0.50 0.74 2.40 1.73 14.23
205504_at BTK 1,372 0.29 0.47 0.64 1.13 0.58 0.75 0.81
202295_s_at CTSH 3,755 1.76 2.37 2.09 0.56 0.63 1.57 0.31
209312_x_at HLA-DRB1 12,737 1.02 0.57 1.34 1.11 1.12 1.11 1.00
209619_at CD74 8,540 1.49 0.86 2.12 0.73 1.33 1.34 1.11
210042_s_at CTSZ 369 0.76 1.13 17.00 1.66 2.13 2.17 1.83
201560_at CLIC4 2,828 0.87 0.88 1.00 0.12 0.10 0.28 0.22
217388_s_at KYNU 3,429 1.50 1.95 0.90 0.94 0.30 0.65 0.63
217118_s_at C22orf9 1,617 3.33 3.46 2.77 1.43 1.85 1.79 1.04
203927_at NFKBIE 173 3.30 9.96 3.13 1.45 1.39 2.60 1.25
220998_s_at UNC93B1 847 0.60 1.31 0.97 1.31 0.99 1.06 2.27
Non-DC signature genes
219243_at GIMAP4 4,384 0.15 0.11 0.19 0.27 - - -
221704_s_at VPS37B 559 0.26 0.90 0.47 0.80 - - -
204891_s_at LCK 96 1.48 0.52 0.52 0.59 - - -
214582_at PDE3B 144 2.82 2.99 2.43 0.76 - 0.51 -
*
Average expression across replicates. Genes for which expression between monocyte-derived DCs and blood DCs or blood cDCs varies more
than two-fold are shown in bold. mo-DC, monocyte-derived GM-CSF DC; mo-MΦ, monocyte-derived M-CSF macrophages; mono, monocyte;
PBMC-MΦ, human peripheral blood mononuclear cell-derived M-CSF macrophages.
Table 10 (Continued)
Comparison of the transcriptome of human GM-CSF monocyte-derived DCs to that of blood DCs
Genome Biology 2008, Volume 9, Issue 1, Article R17 Robbins et al. R17.19
Genome Biology 2008, 9:R17
Table 11
Comparison of the transcriptome of mouse GM-CSF BM-derived DCs to that of spleen DCs
Ratio to monocytes
Probe set ID Name Mono Mono(2) MΦ BM-MΦ BM-DC pDC CD8 DC CD11b DC
Myeloid signature genes
1420804_s_at Clec4d 4,934 0.65 0.49 0.75 0.41 -
1420330_at Clec4e 5,511 0.11 0.22 0.23 0.11 -
1450808_at Fpr1 119 1.91 - 5.55 2.41 -
1452001_at Nfe2 139 1.44 - - 3.31 -
1450919_at Mpp1 1,888 0.15 2.05 1.75 0.52 0.23 0.09 0.07
1419609_at Ccr1 403 1.27 4.04 0.53 3.98 0.2 - -
1417061_at Slc40a1 2,588 0.68 - 0.56 0.07 0.01 0.01 0.02
1448756_at S100a9 8,664 1.2 - 0.01 0.99 00 -
1417268_at Cd14 6,745 0.1 0.3 0.6 0.19 0.02 0.01 0.01
1418163_at Tlr4 464 0.1 0.36 0.93 0.66 - 0.07 0.06
1448620_at Fcgr3 1,471 2.02 3.56 2.15 2.46 - 0.02 0.07
1422953_at Fpr-rs2 839 2.04 0.12 0.85 1.58 - - 0.05
1419132_at Tlr2 1,763 0.11 0.42 0.24 0.48 0.04 0.1 0.14
1417566_at Abhd5 170 0.19 0.72 0.86 2.2 0.18 0.45 0.25
1415814_at Atp6v1b2 1,556 0.22 2.75 1.57 1.43 0.18 0.27 0.24
1427327_at Pilra 434 1.53 0.16 0.47 2.29 0.1 - 0.21
1418888_a_at Sepx1 4,416 0.48 0.34 0.31 0.56 0.03 0.04 0.05
1438928_x_at Ninj1 5,574 0.03 1.3 0.46 0.36 0.03 0.02 0.02
1448881_at Hp 400 3.19 0.14 0.06 3.09 -
1449453_at Bst1 340 1.08 4.97 0.58 1.61 0.21 0.51 -
1419394_s_at S100a8 10,190 1.37 0.01 0.01 0.66 -0 -
1437200_at Fcho2 311 1.09 1.32 1.06 0.76 0.28 0.2 0.33
1418806_at Csf3r 2,598 0.2 0.14 0.19 0.11 - - 0.03
1439902_at C5ar1 317 8.21 0.19 1.63 0.37 -
1456046_at Cd93 1,559 0.1 0.49 1.18 0.33 0.02 - -
1418901_at Cebpb 3,797 0.14 0.7 0.22 0.42 0.02 0.01 0.02
1420699_at Clec7a 2,748 0.83 2.62 0.44 1.71 0.08 0.06 0.54
Pan-DC signature genes
1419538_at Flt3 51 0.74 - - 0.7 16.2 25.32 17.78
1427619_a_at Sh3tc1 - >1.1 >6.8 >2.8 >4.9 >5.2 >6.5 >4.6
1424489_a_at Trit1 54 7.28 0.44 0.76 1.23 9.03 11.53 8.63
1428744_s_at Bri3bp 161 0.84 0.6 1.44 3.28 6.09 7.24 5.98
1448923_at Prkra 72 1.28 0.77 2.89 2.57 4.45 7.88 3.63
1434880_at Etv6 140 5.39 1.52 0.74 1.75 5.79 6.02 7.78
1416108_a_at Tmed3 154 0.81 3.74 2.63 4.65 10.17 4.48 3
1436633_at Bahcc1 41 1.77 - 0.83 - 1.8 3.88 2.35
1437378_x_at Scarb1 97 5.02 1.25 2.61 3.17 7.41 8.27 4.05
cDC signature genes
1435108_at Arhgap22 63 - - 2.37 0.57 0.59 10.65 4.43
1429168_at Btbd4 129 0.19 0.27 - 0.47 0.81 3.89 3.8
1425294_at Slamf8 146 1.06 39.89 1.83 1.77 0.39 8.48 5.27
1453076_at 9130211I03Rik 36 1.61 2.85 1.03 13.11 0.62 30.94 25.64
1436907_at Nav1 102 1.59 0.74 2.63 1.96 1.21 6.08 13.14
1421210_at C2ta 125 0.17 1.79 0.19 0.93 1.46 5.94 5.43
Genome Biology 2008, 9:R17
Genome Biology 2008, Volume 9, Issue 1, Article R17 Robbins et al. R17.20
CD8α cDCs and human BDCA3 cDCs, and between mouse
CD11b cDCs and human BDCA1 cDCs. In contrast to the genes
selectively expressed in subsets of myeloid or lymphoid cells
in a conserved manner between mouse and human, most of
the genes specifically increased in all LN-DC subsets or in
individual LN-DC subsets are currently uncharacterized. As a
consequence, the functional annotations of the LN-DC
transcriptional signatures appear much less informative than
those for myeloid cells, lymphocytes or APCs. This highlights
how much has already been deciphered regarding the molec-
ular regulation of antigen presentation or lymphocyte biol-
ogy, as opposed to how little we know about the genetic
programs that determine the specific features of LN-DCs. We
believe that our study provides a unique database resource for
future investigation of the evolutionarily conserved molecular
pathways governing specific aspects of the ontogeny and
functions of leukocyte subsets, especially DCs.
It should be noted that many genes are found to be expressed
to very high levels in specific subsets of either mouse or man
while no orthologous gene has been identified in the other
species. This could be due to a true absence of orthologous
genes between these two vertebrate species, or to a lack of
identification of an existing orthology relationship. It is also
possible that some of the genes expressed only in mouse DCs
or only in human DCs, and not conserved between the two
species, might represent functional homologs, similar to what
is observed for human KIR and mouse Ly49 NK cell
receptors. This may be the case for the human LILRA4 (ILT7)
and the mouse SIGLECH molecules, as both of them signal
through immunoreceptor tyrosine-based activation motif
(ITAM)-bearing adaptors to downmodulate IFN-α/β produc-
tion by human and mouse pDCs, respectively, upon triggering
of TLRs [83,84]. Thus, understanding the role in LN-DCs of
genes identified here only in mouse or human might be
important. The transcriptional signatures identified for
mouse LN-DC subsets in this study have been confirmed by
analyses of independent data recently published by others on
mouse cDC subsets, B cells and T cells [11] or on cDCs and
pDCs [15]. Most of the data for the mouse 430 2.0 compen-
dium were generated in-house, with the exceptions being
CD4 T cells and myeloid cells. In humans, we generated the
1423122_at Avpi1 150 0.32 - 0.2 0.86 0.61 2.47 7.62
1416627_at Spint1 - >1.5 >1.1 - >22.9 >1.6 >25.7 >30.6
1450667_a_at Cs 396 2.47 0.9 1.19 3.54 2.83 4.64 4.5
APC signature genes
1419744_at H2-DMb2 451 0.12 0.1 0.08 1.47 0.45 0.48 1.69
1443687_x_at H2-DMb1 547 0.56 0.13 0.11 1.56 1.06 0.82 3.13
1434955_at March1 80 32.64 0.83 1.51 3.48 3.73 13.4 8.57
1448143_at Aldh2 867 0.47 2.14 2.07 1.32 0.95 0.65 0.45
1419406_a_at Bcl11a 60 1.47 0.34 - 0.71 20.41 7.63 9.19
1422755_at Btk 416 0.56 0.76 1.3 1.15 0.88 1.45 1.17
1418365_at Ctsh 1,393 0.81 3.9 2.19 2.15 3.69 1.24 2.16
1417025_at H2-Eb1 6,385 0.13 0.39 0.04 0.8 0.9 1.31 1.33
1425519_a_at Cd74 8,377 0.36 0.95 0.2 0.9 0.83 0.97 0.98
1417868_a_at Ctsz 7,061 0.05 1.16 0.95 0.85 0.5 0.3 0.49
1423393_at Clic4 2,807 0.07 2.04 0.84 0.57 0.69 0.72 0.67
1430570_at Kynu 31 1.23 - - 3.21 12.87 5.16 11.56
1435745_at 5031439G07Rik 356 0.95 0.73 2.76 2.51 3.23 3.14 4.28
1458299_s_at Nfkbie 767 0.4 0.62 0.1 0.44 1.25 0.65 1.27
1423768_at Unc93b1 663 0.1 2.27 2.69 1.46 1.2 0.93 0.91
Non-DC signature genes
1424375_s_at Gimap4 362 0.14 0.29 - 0.1 0.11 - 0.11
1424380_at Vps37b 313 0.44 0.46 0.45 0.26 0.28 0.28 0.27
1425396_a_at Lck 118 - 0.57 0.2 0.32 0.21 - 0.17
1433694_at Pde3b 352 0.69 0.15 0.16 0.42 - 0.65 0.35
*
Average expression across replicates. Genes for which expression between mouse bone-marrow derived GM-CSF DCs (BM-DCs) and spleen DCs
or spleen cDCs varies more than two-fold are shown in bold. BM-MΦ, mouse bone marrow-derived M-CSF macrophages; MΦ, peritoneal mouse
macrophages; mono, mouse spleen monocytes from the SB laboratory; mono(2), mouse spleen monocytes from the BP laboratory, as listed in Table
1.
Table 11 (Continued)
Comparison of the transcriptome of mouse GM-CSF BM-derived DCs to that of spleen DCs
Genome Biology 2008, Volume 9, Issue 1, Article R17 Robbins et al. R17.21
Genome Biology 2008, 9:R17
data for non-DC populations, whereas data for DC subsets
and CD16 cells were all generated by another group and
retrieved from a public database. It is well known that data-
sets for the same cell type can vary considerably between lab-
oratories. However, many of the genes identified as specific
for each mouse LN-DC subset using our own data were con-
firmed by the analysis of other data independently generated
by the groups of M Nussenzweig and R Steinman [11]. These
data are given in Additional data file 5.
Our clustering analyses and PCA also showed relatively little
dataset-dependent biases, and generally grouped related cell
populations together, even if they were from different origins
(see, for instance, the PCA clustering of in vitro derived GM-
CSF DC samples, which originated from two independent
datasets in Additional data file 6). In addition, we analyzed by
real-time PCR the expression profile of 27 genes across mouse
leukocyte subsets from biological samples independent of
those used in the gene chips analysis. All the results were
consistent with the gene chip data (Additional data file 7). We
also confirmed specific expression of PACSIN1 in human
pDCs at both the mRNA and protein levels (Additional data
file 8). Finally, we believe that our approach validates the
gene expression profile identified for leukocyte subsets in the
strongest way possible, by demonstrating the evolutionary
conservation between mouse and human. Indeed, the gene
signatures that we describe here are based on genes found
specifically expressed in putatively homologous subsets of
mouse and human leukocytes compared to several other
types of leukocytes. This approach does not rely solely on the
use of independent biological samples of similar origin and on
different techniques for measurement of the expression of
mRNA. It actually shows that orthologous genes share the
same specific expression pattern in putatively homologous
immune cell subsets from two different species, under condi-
tions where the markers used to purify the human and mouse
cell populations, and the probes used to check the expression
of the orthologous genes, differ considerably. Thus, we
believe that the analyses presented here are extremely robust
even though they were, in part, performed by creating com-
pendia regrouping data generated by different laboratories
for different cell type.
In addition to our discovery of transcriptional signatures spe-
cific to all LN-DCs or to LN-DC subsets, we demonstrate that,
once identified, the transcriptional signatures of multiple cell
types can be effectively used to help determine the nature of
newly identified cell types of ambiguous phenotype or func-
tions. In our attempt to appropriately place IKDCs and CD16
cells within the leukocyte family, we used the microarray data
from the original reports aimed at characterizing these cells
and compared them to the data from several other leukocyte
populations. The conclusions of this analysis are in sharp con-
trast to those originally reported [15,31]. We believe that
these opposing conclusions arise from the difference in the
contextual framework within which our data and that of the
previously mentioned studies were analyzed. Thus, the
results of our analysis of the transcriptional signature of both
IKDCs and CD16 cells emphasize the need to study the tran-
scriptional signatures of individual cell populations in the
context of multiple cell types of various phenotypes and
functions. Finally, this approach also allowed us to confirm a
very recent report that demonstrated that in vitro derived
GM-CSF mouse DCs likely correspond to inflammatory DCs
and greatly differ from LN-DCs, based on ontogenic and func-
tional studies [75]. Thus, extrapolation to LN-DCs of the
results of the cell biology and functional studies performed
with in vitro derived GM-CSF DCs should only be made with
extreme caution.
Conclusion
This study comparing whole genome expression profiling of
human and mouse leukocytes has identified for the first time
conserved genetic programs common to all LN-DCs or spe-
cific to the plasmacytoid versus conventional subsets. In
depth studies of these genetic signatures should provide novel
insights on the developmental program and the specific func-
tions of LN-DC subsets. The study in the mouse of the novel,
cDC-specific genes identified here should accelerate the
understanding of the mysteries of the biology of these cells in
both mouse and human. This should help to more effectively
translate fundamental immunological discoveries in the
mouse to applied immunology research aimed at improving
human health in multiple disease settings.
Materials and methods
Sorting of cell subsets
Duplicates of pDCs (Lin
-
CD11c
+
120G8
high
), CD8α cDCs (Lin
-
CD11c
high
CD8α
+
120G8
-/low
), CD11b cDCs (Lin
-
CD11c
high
CD11b
+
120G8
-/low
) and NK cells (NK1.1
+
TCRβ
-
)
were sorted during two independent experiments from
pooled spleens of untreated C57BL/6 mice. Splenic CD19
+
B
lymphocytes, CD4 T cells and CD8 T cells were sorted in other
independent experiments. Purity of sorted cell populations
was over 98% as checked by flow cytometry (not shown).
Processing of cell samples for the Affymetrix GeneChip
assays
RNA was extracted from between 7.5 × 10
5
and 1.5 × 10
6
cells
for each leukocyte subset with the Qiagen (Courtaboeuf,
France) micro RNAeasy kit, yielding between 200 and 700 ng
of total RNA for each sample. Quality and absence of genomic
DNA contamination were assessed with a Bioanalyser (Agi-
lent, Massy, France). RNA (100 ng) from each sample was
used to synthesize probes, using two successive rounds of
cRNA amplification with appropriate quality control to
ensure full length synthesis according to standard Affymetrix
protocols, and hybridized to mouse 430 2.0 chips (Affyme-
trix, Santa Clara, CA, USA). Raw data were transformed with
the Mas5 algorithm, which yields a normalized expression
Genome Biology 2008, 9:R17
Genome Biology 2008, Volume 9, Issue 1, Article R17 Robbins et al. R17.22
value, and 'absent' and 'present' calls. Target intensity was set
to 100 for all chips.
Individual analysis of the mouse 430 2.0 or human U133
Plus 2.0 compendia
For each compendium, all datasets were normalized with the
invariant rank method and only one representative dataset
was kept for redundant ProbeSets targeting the same gene.
The datasets were further filtered to eliminate genes with
similar expression in all samples, by selecting only the genes
expressed above 50 (respectively 100) in all the replicates of
at least one population for the mouse (respectively human)
datasets and whose expression across all samples harbored a
coefficient of variation above the median of the coefficient of
variation of all ProbeSets. The final dataset consisted of 7,298
(respectively 11,507) ProbeSets for the mouse 430 2.0 com-
pendium (respectively human U133 Plus 2.0), representing
individual genes with differential expression between ex vivo
isolated cell subsets. The final dataset consisted of 12,857
(respectively 6,724) ProbeSets for the mouse 430 2.0 com-
pendium (respectively human U133 Plus 2.0), representing
individual genes with differential expression between LN-
DCs, monocytes/macrophages and in vitro derived GM-CSF
DCs. These datasets for ex vivo isolated cells are accessible as
Excel workbooks in Additional data files 1 and 2. The software
Cluster and Treeview were used to classify cell subsets
according to the proximity of their gene expression pattern as
assessed by hierarchical clustering with complete linkage.
We implemented a function in the Matlab software to per-
form PCA. This function computes the eigenvalues and eigen-
vectors of the dataset using the correlation matrix. The
eigenvalues were then ordered from highest to lowest, indi-
cating their relative contribution to the structure of the data.
For both mouse and human datasets, the first principal com-
ponent accounted for most of the information (54% and 68%
for mouse and human, respectively) and was associated with
a similar coordinate for all samples. This component thus
reflected the common gene expression among the samples.
Second and third components together represented 24% and
21%, respectively, of the information for mouse and human
datasets, and thus accounted for a large part of the variability.
The projection of each sample on the planes defined by these
components was represented as a dot plot to generate the
PCA figures.
Partitional clustering was performed using the FCM algo-
rithm, which links each gene to all clusters via a vector of
membership indexes, each comprised between 0 and 1 [34].
For both mouse and human datasets, we heuristically set the
number of clusters to 30, and the fuzziness parameter m was
taken as 1.2 (see [34] for the determination of m). Ten inde-
pendent runs of the algorithm were performed, and the one
minimizing the inertia criterion was selected [34]. A thresh-
old value of 0.9 was taken to select probe sets most closely
associated with a given cluster. This selection retained 4,062
and 4,751 probe sets from mouse and human datasets, respec-
tively. Probe set clusters were then manually ordered to pro-
vide coherent pictures, which were visualized with Treeview.
Meta-analysis of aggregated mouse and human
datasets
We identified 2,227 orthologous genes that showed signifi-
cant variation of expression in both the mouse 430 2.0 and
U133 Plus 2.0 human datasets. This dataset is accessible as an
Excel workbook in Additional data file 3. In order to compare
the expression patterns of these genes between human and
mouse, the log signal values for each of these genes were first
normalized to a mean equal to zero and a variance equal to 1,
independently in the mouse and human datasets, as previ-
ously described for comparing the gene expression program
of human and mouse tumors [22,27]. The two normalized
datasets were then pooled and a hierarchical clustering with
complete linkage was performed. A similar analysis was per-
formed for the comparison of human and mouse LN-DCs,
monocytes, macrophages and in vitro derived GM-CSF DCs.
Meta-analysis of mouse 430 2.0 and U74Av2 datasets
In order to classify the IKDCs based on the optimal gene sig-
natures of the different cell subsets examined, with only min-
imal impact of differences in the experimental protocols used
to prepare the cells and to perform the gene chips assays, the
clustering of the cell populations was performed as a meta-
analysis of our own mouse 430 2.0 dataset together with the
published U74Av2 datasets. The Array Comparison support
information of the NetAffyx™ analysis center (Affymetrix)
was used to identify matched ProbSets between the two types
of microarrays. Only one representative dataset was kept for
redundant ProbeSets targeting the same gene. This yielded a
set of 2,251 genes whose expression could be compared
between the two datasets, using the same normalization
method as described above. This dataset is accessible as Excel
workbooks in Additional data file 4. As expected, this meta-
analysis led to co-clustering of all the samples derived from
identical cell types whether their gene expression had been
Clustering of in vitro GM-CSF derived DCs with monocytes, macrophages and LN-resident DCsFigure 5 (see following page)
Clustering of in vitro GM-CSF derived DCs with monocytes, macrophages and LN-resident DCs. Hierarchical clustering with complete linkage was
performed on the indicated cell populations isolated from: (a) mouse, (b) human, and (c) both. The heat maps used for illustration were selected as the
two clusters of genes encompassing either Flt3 or Mafb, with a correlation cut-off for similarity of gene expression within each cluster at 0.8.
Genome Biology 2008, Volume 9, Issue 1, Article R17 Robbins et al. R17.23
Genome Biology 2008, 9:R17
Figure 5 (see legend on previous page)
pDC
CD8 DC
mono
mono
MΦ
BM-MΦ
BM-MΦ
BM-DC
BM-DC
mo-DC
PBMC-MΦ
mo-MΦ
CD16
mono
BDCA3 DC
BDCA1 DC
pDCs
mo-DCs = human monocyte-derived GM-CSF DCs
mo-MΦ = human monocyte-derived M-CSF macrophages
PBMC-MΦ = human peripheral blood mononuclear cell-derived
M-CSF macrophages
mono = human blood monocytes or mouse spleen monocytes
BM-MΦ = mouse bone marrow-derived M-CSF macrophages
MΦ = mouse peritoneal macrophages
BM-DC = mouse bone marrow-derived GM-CSF DCs
h. BDCA1
h. BDCA3
m. CD8
m. CD11b
h. pDC
m. pDC
h. mono
m. mono(2)
h. CD16
m. mono(1)
h. PBMC-MΦ
h. mo-M
Φ
m. BM-MΦ
m. BM-MΦ
m. perit MΦ
h. mo-DC
m. BM-DC
m. BM-DC
CD11b DC
(a) (b)
(c)
+3-3 0
+3-3 0
Color scale
Color scale
ZNF532
MAGEF1
CIITA
NFATC2
ITGB7
RASGEF1A
CCNB1IP1
FLT3
SH3BP4
TMEM120A
RRAS
LRRC25
PAPSS2
MAFB
MTSS1
CHST7
FCGR3A
PIK3IP1
GPR109B
PYGB
m Bxdc1; h BXDC1
m Nsmaf; h NSMAF
m Flt3; h FLT3
m Itgb7; h ITGB7
m Ptk2; h PTK2
m Cd14; h CD14
m Mpp1; h MPP1
m Sdcbp; h SDCBP
m Mafb; h MAFB
m Dok3; h DOK3
m Tlr4; h TLR4
Ddx10
Ofd1
A030009H04Rik
6330509M05Rik
Tmem161b
Nsmaf
Zfp566
Flt3
E230012J19Rik
Tmem170
Zdhhc23
Per1
Hspa8
Crtc2
Armcx2
Dffb
Rnf215
Mmaa
Rab11fip2
Wdr92
Setd6
Apbb3
Ermp1
Slc4a1ap
Surf6
LOC677143
Fkbp3
0610010K14Rik
Clec4d
Mast1
Soat1k
Mafb
Tlk1
Tmem65
Mitf
Gp49a
Plk2
LOC100042986
Rp137
Genome Biology 2008, 9:R17
Genome Biology 2008, Volume 9, Issue 1, Article R17 Robbins et al. R17.24
measured by us on 430 2.0 microarrays or by others on
U74Av2 microarrays, with the exception of the cDC popula-
tion from [15], which segregated with pDCs rather than with
the cDC subsets from the other datasets.
Data mining
Gene lists were analyzed using the DAVID 'functional annota-
tion chart' tool accessible on the NIAID website [52,53]. Dif-
ferent databases were used for these annotations: gene
ontology (Amigo), knowledge pathways (KEGG), interactions
(BIND), interprotein domains (INTERPRO), and disease
(OMIM/OMIA). The annotations shown in Tables 5 and 7
were selected as the most highly significant terms retrieved by
performing an over-representation study. To this end, a
modified Fisher exact P value called the 'EASE score' was cal-
culated to measure the enrichment in gene-annotation terms
between the gene signature specific to the leukocyte
subpopulation examined ('List') and the complete set of all
the genes selected for the compendium analyzed ('Back-
ground'). The significance threshold was set at an EASE score
below 0.05 in most instances, or below 0.1 for DC signatures
that did not yield many highly significant terms as discussed
in Results. Individual significant annotations encompassing
many common genes or similar biological processes were
regrouped using the 'Functional annotation clustering' tool of
the DAVID software. More information on this type of analy-
sis is available on the DAVID website [85].
Public access to the raw data for the datasets analyzed
in the paper
Our datasets for mouse DC subsets, NK cells, CD8 T cells, and
B lymphocytes have been deposited in the Gene Expression
Omnibus (GEO) database under reference number GSE9810.
The references for download of the public data used from the
original websites where they were first made available are
given in Table 1. In addition, all raw transcriptomic data ana-
lyzed here have been regrouped on our website [86] and are
available for public download.
Abbreviations
APC, antigen-presenting cell; BM, bone marrow; cDC, con-
ventional dendritic cell; CDP, common dendritic progenitor;
DC, dendritic cell; FCM, fuzzy c-means; GEO, Gene Expres-
sion Omnibus; GM-CSF, granulocyte-macrophage colony
stimulating factor; IFN, interferon; IKDC, interferon-produc-
ing killer dendritic cell; ITAM, immunoreceptor tyrosine-
based activation motif; LN-DC, lymph node-resident DC; M-
CSF, macrophage colony-stimulating factor; MDP, macro-
phage and dendritic cell progenitor; MHC, major histocom-
patibility; NK, natural killer; PCA, principal component
analysis; pDC, plasmacytoid dendritic cell; TLR, toll-like
receptor.
Authors' contributions
SHR, TW, SC, PK, and MD designed the research; SHR, TW,
CT, HX, MS, GB, AD and MD performed the research; EV and
PP contributed new reagents/analytical tools; SHR, TW, CT,
HX, DD, MS, FRS, SC, PK, and MD analyzed data; and SHR,
TW, and MD wrote the paper.
Note added in proof
During the review process of this paper, two reports were
published in Nature Immunology that identified a common
progenitor characterized as FLT3
+
M-CSF
+
for mouse LN-DCs
(pDCs, CD8α cDCs and CD11b cDCs), devoid of any capability
to generate lymphoid cells or monocytes/macrophages, and
named common dendritic progenitor (CDP) [87,88]. This
observation is thus consistent with our gene profiling analysis
of human and mouse leukocytes. The question whether this
pathway for LN-DCs is the major one, or just one possibility
among others, including differentiation from monocytes, has
been raised [89]. Our gene profiling data would suggest that
most mouse LN-DCs derive from the recently identified CDP
or MDP in vivo, without a monocytic intermediate, consistent
with a recent report [81]. It also implies that a similar path-
way must exist in humans. The relationship between the CDP
and the MDP still remains to be established. Three reports
have been published very recently in the Journal of Experi-
mental Medicine that showed that IKDCs are a specific subset
of NK cells, based on functional and ontogenic approaches
comparing these cells to DCs and NK cells [90-92]. This is
consistent with the results of our clustering analysis of IKDCs
with other leukocyte subsets. Finally, two recent reports have
identified a new transduction pathway in human pDCs
involving a B cell receptor-like ITAM-signaling pathway
[93,94]. This pathway involves the BLNK transduction
molecule, which we have identified here as expressed to very
high levels in mouse and human pDCs compared to the other
LN-DCs (Table 6) and many other leukocytes. We believe that
the conserved transcriptional signatures identified here for
mouse and human LN-DC subsets will lead to many more dis-
coveries for the understanding of the specialized functions of
these cells.
Additional data files
The following additional data are available. Additional data
file 1 is a Microsoft Excel workbook with raw data for the
mouse gene chip compendium. Additional data file 2 is a
Microsoft Excel workbook with raw data for the human gene
chip compendium. Additional data file 3 is a Microsoft Excel
workbook with raw data for the human/mouse gene chip
compendium. Additional data file 4 is a Microsoft Excel work-
book with raw data for the IKDC gene chip compendium.
Additional data file 5 is a Microsoft Excel workbook giving the
mouse DC subset gene signatures according to our datasets
with confirmation from two other independent datasets (one
for pDCs and one for cDC subsets). Additional data file 6 is a
Genome Biology 2008, Volume 9, Issue 1, Article R17 Robbins et al. R17.25
Genome Biology 2008, 9:R17
figure showing the results of PCA for investigation of the rela-
tionships between in vitro derived GM-CSF DCs and LN-DCs
in mouse and human. Additional data file 7 is a table giving
real-time PCR data for the pattern of expression of 27 genes
across mouse leukocyte subsets. Additional data file 8 is a fig-
ure illustrating PACSIN1 expression in human pDCs versus
PBMCs by RT-PCR and western blotting.
Additional file 1Raw data for the mouse gene chip compendiumRaw data for the mouse gene chip compendium.Click here for fileAdditional file 2Raw data for the human gene chip compendiumRaw data for the human gene chip compendium.Click here for fileAdditional file 3Raw data for the human/mouse gene chip compendiumRaw data for the human/mouse gene chip compendium.Click here for fileAdditional file 4Raw data for the IKDC gene chip compendiumRaw data for the IKDC gene chip compendium.Click here for fileAdditional file 5Mouse DC subset gene signaturesMouse DC subset gene signatures according to our datasets with confirmation from two other independent datasets (one for pDCs and one for cDC subsets).Click here for fileAdditional file 6Results of PCA for investigation of the relationships between in vitro derived GM-CSF DCs and LN-DCs in mouse and humanResults of PCA for investigation of the relationships between in vitro derived GM-CSF DCs and LN-DCs in mouse and human.Click here for fileAdditional file 7Real-time PCR data for the pattern of expression of 27 genes across mouse leukocyte subsetsReal-time PCR data for the pattern of expression of 27 genes across mouse leukocyte subsets.Click here for fileAdditional file 8PACSIN1 expression in human pDCs versus PBMCsPACSIN1 expression in human pDCs versus PBMCs by RT-PCR and western blotting.Click here for file
Acknowledgements
The authors are indebted to Bertrand Nadel and Jean-Marc Navarro for
help with the real-time PCR experiments and to Markus Plomann for the
generous gift of the anti-PACSIN1 antibody. The authors also thank the
staff of the animal care facilities and the flow cytometry core facility of the
CIML for excellent assistance. This work was supported by an ATIP grant
from the CNRS, a grant from the Association pour la Recherche sur le Can-
cer (ARC) and a grant from the Réseau National des Génopoles (RNG) to
MD. SHR was supported by the CNRS, the Fondation pour la Recherche
Médicale, and the Philippe Foundation. The CIML is supported by institu-
tional grants from the INSERM, the CNRS, and the Université de la
Méditerranée. We thank the IPSOGEN company for their advice on the
analysis of the data. The authors declare no conflict of interest.
References
1. Mellman I, Steinman RM: Dendritic cells: specialized and
regulated antigen processing machines. Cell 2001,
106:255-258.
2. Iwasaki A, Medzhitov R: Toll-like receptor control of the adap-
tive immune responses. Nat Immunol 2004, 5:987-995.
3. Liu YJ: IPC: professional type 1 interferon-producing cells and
plasmacytoid dendritic cell precursors. Annu Rev Immunol 2005,
23:275-306.
4. Serbina NV, Salazar-Mather TP, Biron CA, Kuziel WA, Pamer EG:
TNF/iNOS-Producing Dendritic Cells Mediate Innate
Immune Defense against Bacterial Infection. Immunity 2003,
19:59-70.
5. Walzer T, Dalod M, Robbins SH, Zitvogel L, Vivier E: Natural-killer
cells and dendritic cells: "l'union fait la force". Blood 2005,
106:2252-2258.
6. Shortman K, Liu YJ: Mouse and human dendritic cell subtypes.
Nature Rev Immunol 2002, 2:151-161.
7. Narbutt J, Lesiak A, Zak-Prelich M, Wozniacka A, Sysa-Jedrzejowska
A, Tybura M, Robak T, Smolewski P: The distribution of periph-
eral blood dendritic cells assayed by a new panel of anti-
BDCA monoclonal antibodies in healthy representatives of
the Polish population. Cell Mol Biol Lett 2004, 9:497-509.
8. Heath WR, Belz GT, Behrens GM, Smith CM, Forehan SP, Parish IA,
Davey GM, Wilson NS, Carbone FR, Villadangos JA: Cross-presen-
tation, dendritic cell subsets, and the generation of immu-
nity to cellular antigens. Immunol Rev 2004, 199:9-26.
9. Kronin V, Fitzmaurice CJ, Caminschi I, Shortman K, Jackson DC,
Brown LE: Differential effect of CD8(+) and CD8(-) dendritic
cells in the stimulation of secondary CD4(+) T cells. Int
Immunol 2001, 13:465-473.
10. Pooley JL, Heath WR, Shortman K: Cutting edge: intravenous
soluble antigen is presented to CD4 T cells by CD8- dendritic
cells, but cross-presented to CD8 T cells by CD8+ dendritic
cells. J Immunol 2001, 166:5327-5330.
11. Dudziak D, Kamphorst AO, Heidkamp GF, Buchholz VR, Trumpfhel-
ler C, Yamazaki S, Cheong C, Liu K, Lee HW, Park CG, Steinman RM,
Nussenzweig MC: Differential antigen processing by dendritic
cell subsets in vivo. Science 2007, 315:107-111.
12. Shigematsu H, Reizis B, Iwasaki H, Mizuno S, Hu D, Traver D, Leder
P, Sakaguchi N, Akashi K: Plasmacytoid dendritic cells activate
lymphoid-specific genetic programs irrespective of their cel-
lular origin. Immunity 2004, 21:43-53.
13. Ito T, Kanzler H, Duramad O, Cao W, Liu YJ: Specialization, kinet-
ics, and repertoire of type 1 interferon responses by human
plasmacytoid predendritic cells. Blood 2006, 107:2423-2431.
14. Dalod M, Salazar-Mather TP, Malmgaard L, Lewis C, Asselin-Paturel
C, Briere F, Trinchieri G, Biron CA: Interferon alpha/beta and
interleukin 12 responses to viral infections: pathways regu-
lating dendritic cell cytokine expression in vivo. J Exp Med
2002, 195:517-528.
15. Chan CW, Crafton E, Fan HN, Flook J, Yoshimura K, Skarica M,
Brockstedt D, Dubensky TW, Stins MF, Lanier LL, Pardoll DM, Hous-
seau F: Interferon-producing killer dendritic cells provide a
link between innate and adaptive immunity. Nat Med 2006,
12:207-213.
16. Taieb J, Chaput N, Menard C, Apetoh L, Ullrich E, Bonmort M,
Pequignot M, Casares N, Terme M, Flament C, Opolon P, Lecluse Y,
Metivier D, Tomasello E, Vivier E, Ghiringhelli F, Martin F, Klatzmann
D, Poynard T, Tursz T, Raposo G, Yagita H, Ryffel B, Kroemer G,
Zitvogel L: A novel dendritic cell subset involved in tumor
immunosurveillance. Nat Med 2006, 12:214-219.
17. Hyatt G, Melamed R, Park R, Seguritan R, Laplace C, Poirot L, Zuc-
chelli S, Obst R, Matos M, Venanzi E, Goldrath A, Nguyen L, Luckey
J, Yamagata T, Herman A, Jacobs J, Mathis D, Benoist C: Gene
expression microarrays: glimpses of the immunological
genome. Nat Immunol 2006, 7:686-691.
18. Yamagata T, Benoist C, Mathis D: A shared gene-expression sig-
nature in innate-like lymphocytes. Immunol Rev 2006,
210:52-66.
19. Benoist C, Germain RN, Mathis D: A plaidoyer for 'systems
immunology'. Immunol Rev 2006, 210:229-234.
20. Shaffer AL, Rosenwald A, Hurt EM, Giltnane JM, Lam LT, Pickeral OK,
Staudt LM: Signatures of the immune response. Immunity 2001,
15:375-385.
21. Hutton JJ, Jegga AG, Kong S, Gupta A, Ebert C, Williams S, Katz JD,
Aronow BJ: Microarray and comparative genomics-based
identification of genes and gene regulatory regions of the
mouse immune system. BMC Genomics 2004, 5:82.
22. Ellwood-Yen K, Graeber TG, Wongvipat J, Iruela-Arispe ML, Zhang J,
Matusik R, Thomas GV, Sawyers CL: Myc-driven murine prostate
cancer shares molecular features with human prostate
tumors. Cancer Cell 2003, 4:223-238.
23. Zeller KI, Jegga AG, Aronow BJ, O'Donnell KA, Dang CV: An inte-
grated database of genes responsive to the Myc oncogenic
transcription factor: identification of direct genomic targets.
Genome Biol 2003, 4:R69.
24. Reichling T, Goss KH, Carson DJ, Holdcraft RW, Ley-Ebert C, Witte
D, Aronow BJ, Groden J: Transcriptional profiles of intestinal
tumors in Apc(Min) mice are unique from those of embry-
onic intestine and identify novel gene targets dysregulated in
human colorectal tumors. Cancer Res 2005, 65:166-176.
25. Kaiser S, Park YK, Franklin JL, Halberg RB, Yu M, Jessen WJ, Freuden-
berg J, Chen X, Haigis K, Jegga AG, Kong S, Sakthivel B, Xu H, Reich-
ling T, Azhar M, Boivin GP, Roberts RB, Bissahoyo A, Gonzales F,
Bloom GL, Eschrich S, Carter SL, Aronow JE, Kleimeyer J, Kleimeyer
M, Ramaswamy V, Settle SH, Boone B, Levy S, Graff JM, et al.: Tran-
scriptional recapitulation and subversion of embryonic colon
development by mouse colon tumor models and human
colon cancer. Genome Biol 2007, 8:R131.
26. Graeber TG, Sawyers CL: Cross-species comparisons of cancer
signaling. Nat Genet 2005, 37:7-8.
27. Lee JS, Chu IS, Mikaelyan A, Calvisi DF, Heo J, Reddy JK, Thorgeirsson
SS: Application of comparative functional genomics to iden-
tify best-fit mouse models to study human cancer. Nat Genet
2004, 36:1306-1311.
28. Fontenot JD, Rasmussen JP, Williams LM, Dooley JL, Farr AG, Ruden-
sky AY: Regulatory T cell lineage specification by the fork-
head transcription factor foxp3. Immunity 2005, 22:329-341.
29. Chelvarajan RL, Liu Y, Popa D, Getchell ML, Getchell TV, Stromberg
AJ, Bondada S:
Molecular basis of age-associated cytokine dys-
regulation in LPS-stimulated macrophages. J Leukoc Biol 2006,
79:1314-1327.
30. Du X, Tang Y, Xu H, Lit L, Walker W, Ashwood P, Gregg JP, Sharp
FR: Genomic profiles for human peripheral blood T cells, B
cells, natural killer cells, monocytes, and polymorphonuclear
cells: comparisons to ischemic stroke, migraine, and
Tourette syndrome. Genomics 2006, 87:693-703.
31. Lindstedt M, Lundberg K, Borrebaeck CA: Gene family clustering
identifies functionally associated subsets of human in vivo
blood and tonsillar dendritic cells. J Immunol 2005,
175:4839-4846.
32. Eisen MB, Spellman PT, Brown PO, Botstein D: Cluster analysis
and display of genome-wide expression patterns. Proc Natl
Acad Sci USA 1998, 95:14863-14868.
33. Alter O, Brown PO, Botstein D: Singular value decomposition
for genome-wide expression data processing and modeling.