Báo cáo y học: "Physical activity and body composition outcomes of the GreatFun2Run intervention at 20 month follow-up" pptx
Bạn đang xem bản rút gọn của tài liệu. Xem và tải ngay bản đầy đủ của tài liệu tại đây (286.98 KB, 11 trang )
RESEARC H Open Access
Physical activity and body composition outcomes
of the GreatFun2Run intervention at 20 month
follow-up
Trish Gorely
1*
, John G Morris
1
, Hayley Musson
1
, Susie Brown
1
, Alan Nevill
2
and Mary E Nevill
1
Abstract
Background: Physical inactivity is recognised as a public health concern within children and interventions to
increase physical activit y are needed. GreatFun2Run was a school-based healthy lifestyles intervent ion that showed
positive changes in physical activity levels and body composition immediately post-intervention. The purpose of
this paper was to examine whether these changes in physical activity and body composition were maintained 18-
20 months after the intervention ended.
Method: Participants (n = 589, aged 7-11 yrs) from 4 intervention and 4 control schools took part in the 10-month
intervention, of which 421 (71%) were present for follow-up. The intervention comprised a CD-rom learning and
teaching resource for teachers; an interactive website for pupils, teachers and parents; two highlight physical
activity events (1 mile school runs/walks); a local media campaign; and a summer activity wall planner and record.
Randomisation was not possible because of local media content. Outcome measures were objectively measured
physical activity (pedometers and accelerometers) and body composition variables (body mass index, waist
circumference, estimated percent body fat, and sum of skinfolds). Teacher interviews and participant focus groups
were conducted. Multi-level modelling was employed for the data analysis.
Results: Both control and intervention participants had increased their physical activity at follow-up but there
was no group by time interaction (control: 2726 steps per day i ncrease; intervention 3404 steps per day
increase, p > .05). There were sig nificant increases in estimated percent body fat, sum of skinfolds, waist
circumference and body mass index (BMI) w ith increasing age. In the control group, there was evidence for a
plateauing in the rate of change in all body composition variables with increasing age, except BMI. In contrast,
significant interaction terms suggest that the rate o f change in waist circumference, BMI and BMISDS continued
to increase with age in the intervention group. Teacher interviews suggested that because of time pressures,
competing resources, curriculum demands and staff changes the majority of teachers had not continued to use
the resources.
Conclusions: While the intervention initially produced positive changes in physical activity levels and body
composition, these changes were not sustained once the intervention ended. Facilitating long-term health
behaviour change in children remains a challenge.
Keywords: Physical activity, intervention, children, long term follow-up
* Correspondence:
1
Institute of Youth Sport, School of Sport and Exercise Sciences,
Loughborough University, Loughborough, LE11 3TU, UK
Full list of author information is available at the end of the article
Gorely et al. International Journal of Behavioral Nutrition and Physical Activity 2011, 8:74
/>© 2011 Gorely et al; licensee BioMed Central Ltd. This is an Open Access article distributed under the terms of the Creative Commons
Attribution License ( which perm its unrestricted use, distribution, and reproduction in
any medium , provided the original work is properly cited.
Background
The importance of regular physical activity for healthy
growth and development in children has been widely
recognised [1,2]. However, a significant number of
young people fail to meet current physical activity
guidelines of 60 minutes of physical activity on most
days of the week [2]. As a consequence there is a need
for effective interventions to encou rage long-term parti-
cipation in healthy lifestyles in young people [3].
Two extended scho ol-based interventions have
demonstrated that it is possible to facilitate long-term
health behaviour change in primary school aged children
[4,5]. Manios et al reported on a primary school-based
intervention involving changes to the physical education
curriculum plus annual workbooks covering dietary
issues, physical activity and fitness and oth er health
behaviours. At the end of the 6 year intervention
changes in physical activity and dietary change s signifi-
cantly favoured the intervention group [6]. Four years
after the intervention ended physical activity levels had
declined in both intervention and control participants,
but remained significantly higher in intervention males
but not females [4]. Likewise, the school and family
based CATCH programme, conducted over 3 school
years when participants were in grades 3 through 5
(ages ~8-10 years), showed significant post -interv ention
effects for vigorous physical activity and daily intakes of
energy from total fat and saturated fat. At three year fol-
low-up, when participants were in grade 8 (age ~13
years), significant differences favouring the intervention
part icipants remained for both diet and physical activity
variables, although the size of the differences had atte-
nuated [5]. Both these studies took a similar interven-
tion approach, delivering non-competitive forms of
exercise during physical education classes, delivering
classroom based health lessons, and encouraging paren-
tal involvement. Although both these studies had posi-
tive short- and long-term intervention effects because of
cultural and educational differences between countries
questions have been raised about the appropriateness of
taking interventions from one country and implement-
ing them in another [7,8].
Within the UK itself there is limited evidence from
primary school based interventions, with only two ran-
domised controlled trials identified [9-11], both of
which only report on post-intervention results. The lack
of long-term follow-up results is reflective of a limita-
tion in the wider field. For example, a recent series of
reviews for the National Institute for Health and Clinical
Excell ence UK [12], showed that while there are a nu m-
ber of interventions aimed at increasing physic al activity
in young people, few of these (20%) had follow-up peri-
ods greater than 6 months, and the majority had no
follow-up period (67%). Other reviews have also high-
lighted the need for longer follow-up periods [7,13-15],
as without sustained follow-up periods (in the order o f
1-2 years) the maintenance of any intervention effects
cannot be assessed [13,14].
GreatFun2Run was a 10-month primary school-based
intervention designed for use with 7-11 year old chil-
dren. The post-intervention results of GreatFun2Run
[16] showed a significant effect on physical activity. Spe-
cifically relative to children in control schools, those in
intervention schools significantly increased their daily
steps (3059 steps per day increase vs. 1527 steps per day
increase), total time in moderate-to-vigorous physical
activity (MVPA) (by 9 minutes/day vs. a decrease of 10
minutes/day), and their time in MVPA bouts lasting at
least one minute (10 minutes/day increase vs. no
change). Additionally, older participants in intervention
schools showed a significant slowing in the rate of
increase in estimated percent body fat (intervention
0.9% vs. control 1.8% per year of age), BMI (intervention
0.4 vs. control 0.9 BMI units per ye ar of age), BMI- SDS
(intervention 05 vs. control 0.12 per year of age), and
waist circumference (intervention 1.8 cm vs. control 2.8
cmperyearofage).However,therewerenodifferences
between groups in fruit and vegetable consumption,
aerobic fitness, knowledge of healthy lifestyles, perceived
competence, enjoyment of physical activity, or intrinsic
motivation. Extrinsic motivation decreased significantly
more in the intervention group. The purpose of this
paper was to examine whether the significant changes in
physical activity and body composition post intervention
were maintained approximately 18-20 months after the
intervention ended.
Method
Participants
Four primary s chools in the north-east of England who
had already agreed to take part in the “GreatFun2Run”
programme were recruited for this study (540 schools in
total participated in the programme). These schools
were matched with 4 schools in the East Midlands of
England on the basis of size, ethnicity and socioeco-
nomic status, as reflected in the Index of Multiple
Depr ivation (IMD) for the school postcode. The IMD is
a measure of compound social and material deprivation,
calculated from a variety of data including income,
employment, health, education, and housing. All partici-
pating primary schools were government-funded
schools.
In total 58 9 children ( 310 interventi on, 279 con trol;
287 boys, 302 girls) took part in the evaluation, of which
421 (71%) were present for follow-up. The mean age of
children at baseline was 8.8 years in the intervention
Gorely et al. International Journal of Behavioral Nutrition and Physical Activity 2011, 8:74
/>Page 2 of 11
schools and 8.9 years in the control schools. The majority
of participants were of white British ethnicity (interven-
tion 94.8%, control 96.5%). Despite matching schools as
closely as possible on the IMD associated with the school
postcode (as a broad reflection of the school catchment
area) there were differences in socioeconomic status at
the individual level between the two groups, with the
intervention group being of lower socio-economic status
than the control group when measured by the IMD for
the postcode defined ward in which each participant
resided. These diff erences were paralleled in household
income with income in intervention schools being signifi-
cantly lower (it i s worth noting though that over 50% of
parents chose not to supply this information).
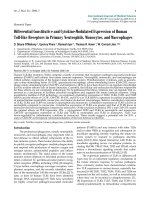
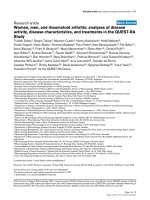
The flow of schools and participants through the pro-
ject is depicted in Fi gure 1. Approximately a third of
participants (34.8%) had finished primary school and
moved on to secondary schools at follow-up. One sec-
ondary school attended by intervention school pupils
declined access to their pupils accounting for 30 of
those not available for follow-up. This refusal was
reflected in a greater than expected absence at follow-up
of pupils from intervention schools relative to control
schools (Chi
2
(1) = 8.11, p <.05), and given the lower
SES of participants from intervention schools at base-
line, a greater number of those absent at follow-up were
of lower SES (Chi
2
(2) = 12.2, p <.05). However, there
was no difference (p > .05) at baseline in age, body com-
position, steps/day, or minutes of MVPA between those
present at follow-up and those absent. In addition, there
were no differ ences in the proportions of boys and girls
present at follow-up compared to baseline (p > .05).
The study was approved by the Ethical Advisory Com-
mittee of Loughborough University and the head tea-
chers of participating schools. Parental consent was
obtained prior to each round of data collection and par-
ents also completed a health screening questionnair e on
behalf of their child. On the day of testing all partici-
pants indicated their assent to participate and were
asked to indicate that they were free of illness. A small
number of children were excluded from the Multi-stage
Shuttle Running Test for medical reasons (e.g., uncon-
trolled asthma, family history of early coronary death).
Intervention
The intervention has been described in detail in Gorely
et al [16] and only a brief overview is provided here.
The GreatFun2Run intervention was designed and
implemented by Great Run (a sports marketing and
event management company). The programme aimed to
increase children’s activity levels through PE lessons that
taught the skills of running (via a number of sports and
activities), through highlight running/walking events
which gave a goal to work towards, and through a range
of classroom activities that reinforced children’s learning
and encouraged them to reflect on their activity levels
and to do more voluntarily. Healthy food choices were
explained and encourag ed in a holistic approach to chil-
dren’s health education. The programme was multifa-
ceted and comprised:
i. a CD-rom learning and teaching resource for tea-
chers with physical education lesson plans and home-
work exercises plus suggestions for including health and
activity related issues across the curriculum in literacy,
numeracy, history, design, science, and geography les-
sons. The CD-ro m was themed around space travel and
contained 8 planets (units of work) the teachers could
visit and work through, covering topics including
healthy eating, self-evaluation of physical levels, and
how our bodies work. The CD-rom also introduced the
“10 Star Rules” for good nutrition and physical activity
which underpinned the programme;
ii. two highlight events (1 mile run/walks) to give the
children a goal for increasing their physical activity.
These events were mass participation events with the
emphasis on participation not competition;
iii. an interactive website for pupils, teachers and par-
ents to raise awareness of the need for physical activity
and healthy eating. This website supported and
expanded on the key health and fitness messages from
the CD-rom;
iv. a local media campaign employing regional radio
and print media to maintain interest and create
excitement;
v. a summer activity wall planner and record.
The programme was designed to be as flexib le as pos-
sible and teachers could decide when and how they
used the material provided. No specific training was
provided for the teachers and all instructions were con-
tained within the pack. Parents were engaged through
homework tasks, information and publicity relating to
runs, the activity planner, and by access to the web site.
The control schools continued with their usual physical
education and health curriculum.
Measures
Physical activity
Daily physical activity was assessed objectively in 2 ways.
All participants wore a Digiwalker SW200 pedometer
for one week during waking hours. Children recorded
the total number of steps taken in the previous 24
hours at the start of each school day. The steps
recorded on Monday morning related to the previous 3
days and participants indicated whether they had worn
the pedometer for most of Saturday and Sunday. In
addition to the pedometer approximately 50% of chil-
dren also wore an ActiGraph GT1M accelerometer dur-
ing waking hours for this week. The sampling epoch
Gorely et al. International Journal of Behavioral Nutrition and Physical Activity 2011, 8:74
/>Page 3 of 11
was 5 seconds. During data processing 20 minutes of
consecutive zero’ s was considered indicative of non-
wearing and these data w ere deleted, minimum day
length was set at 9 hours and time spent in moderate to
vigorous physical activity ( MVPA) was calculated using
the Freedson e t al [17] age specific cutpoints. Acceler-
ometer data is reported in two ways: (i) total time in
MVPA regardless of bout length (MVPA
total
)and(ii)
total time in MVPA when only bouts of at least 1
minute duration were included (MVPA
bout
). When
defining a bout an interruption of no more than 10% of
epochs was allowed (i.e. within any given bout indivi-
duals could drop below the MVPA cut-off for no more
than 10% of the time). For both pedometers and acceler-
ometers the first day of recording was dropped to
account for likely rea ctivity and a minimum of 3 week-
days and 1 weekend day was required for inclusion of a
participant’s data in the study results.
Consented and present for
baseline measures
N = 279 (4/4 schools)
Mid-intervention data collection
(~6 months from baseline)
N = 247/310 (80%) 4/4 schools
Consented and present for
baseline measures
N = 310 (4/4 schools)
Post-intervention follow-up
(~18 months post-intervention or
~28 months from baseline)
N = 215/279 (77%) 4/4 original
primary schools + 4/4
‡
senior
schools**
Post-intervention follow-up
(~20 months post-intervention or
~30 months from baseline)
N = 206/310 (66%) 4/4 original
primary schools + 4/5
‡§
senior
schools
End-intervention data collection
(~10 months from baseline)
N = 264/310 (85%) 4/4 schools
End-intervention data collection
(~10 months from baseline)
N = 243/279 (87%) 4/4 schools
Mid-intervention data collection
(~4 months from baseline)*
N = 244/279 (88%) 4/4 schools
4 control schools matched by
size, ethnicity & SES
4 intervention schools invited to
participate
Figure 1 Flow of schools and participants through study. * difference in time to follow-up 1 between control and intervention schools was
the result of the scheduling of the Christmas school holidays which meant the first data collection could not occur. These time differences are
accounted for with the analysis procedures undertaken. ‡ pupils in year 5 at baseline had moved on to senior schools at post-intervention
follow-up. § one senior school would not allow access (n = 30).
Gorely et al. International Journal of Behavioral Nutrition and Physical Activity 2011, 8:74
/>Page 4 of 11
Anthropometric measures
Height was measured (to the nearest 0.1 cm) using a
stadiometer (Leicester Height Measure, seca ltd., Eng-
land). Body mass was measured (to the nearest 0.01 kg)
using portable digital scales (seca 770, seca ltd, Birming-
ham, UK). This was used to calculate body mass index
(BMI) which was subsequently converted to age and
gender specific standardised scores using the 1990
growth curves from Cole et al., [18]. Subscapular and
triceps skinfold thickness was assessed using callipers
(Harpenden, Baty International, England) and were
taken by two trained research assistants following stan-
dardised Level 1 International Society for the Advance-
ment of Kinanthropometry protocols. Body fat
percentage was then estimated using generalised equa-
tions for prepubescent boys and girls [19]. Sum of skin-
fol ds was calculated by adding together the subscapular
and triceps skinfolds scores. Waist circumference was
measured (to the nearest 0.1 cm) at the widest part of
the torso between the xiphoid process of the sternum
and the iliac.
Procedures
A field team of 10 researchers visited each school for a
day 4 times during the evaluation period (baseline, mid-
way (4-6 months post-baseline), end of intervention
(~10 months post-baseline), and follow-up (28-30
months post-baseline). All measures were completed at
all testing points. Participants attended two sessions of
90 minutes each on each testing day in groups of 15-30.
In one session they completed the anthropometric
assessments and the multi-stage shuttle test. In the
other session they completed the psychological mea-
sures, the knowledge test, and the food recall interview.
They were also given pedometers and, in 50% of the
sample, accelerometers. Participants were also instructed
on how and when to we ar these devices during this se s-
sion. Due to the differences in geographical location it
was not possible to blind the measurement team to the
intervention and control group allocation. A w eek after
the testing a researcher returned to the school to co llect
the pedometers and accelerometers. This paper reports
on only physical activity and body composition results.
At the final data co llection a sub-sample o f pupils
from each class were invited to take part in a focus
group to explore their recollection and experience of
GF2R. Eleven focus groups (n = 72, 34 boys, group size
4-8 participants) were conducted and followed a semi-
structured interview schedule. Each focus group lasted
between 15 and 20 minutes. In addition, eight teachers
who had been involved in the GF2R programme were
interviewed using a semi-structured sched ule examining
recall of GF2R, opinions of the programme and its
impact, and why they had or had not continued to use
the resources. The focus groups and interviews were
recorded using an audio voice recorder and were then
transcribed verbatim.
Analysis of data
We applied a multilevel statistical model using ML-win
[20] to assess changes in physi cal activity and body com-
position. Multilevel modelling is an extension of ordin ary
multiple regression, where the data have a hierarchical or
clustered structure. A hierarchy consists of units or mea-
surements grouped at different levels. Initially a 3 level
hierarchy was explored, based on the idea that individuals
within a class are more like each other t han individuals
between classes, and individuals within a school are more
like each other than individuals between schools. However,
the variances associated with both school and class were
not significant and we could not justify their inclusion as
levels within the model. A two level repeated measures
model, with individuals at level 2 and the participants’
repeated measurements at level 1 produced models with
the best fit statistics. Time in study was measured in
months, so that the differe nces in time peri ods betw een
testing for different participants could be accounted for.
The regression coefficients for time in intervention there-
fore reflect a change per month. The change across the
whole intervention period can be estimated by multiplying
this value by total months in the study (in examples, 29
months has been used as this is the average follow-up per-
iod). To account for potential school effects dummy vari-
ables were created for each school and included as a fixed
factor within the model. Backward elimination was
employed to remove non-significant schools, and only
schools that improved the fit of the model were included.
The potential confounders of age, gender and socio-eco-
nomic status were entered into all models, but in the
interests of parsimony were only retained if their inclusion
resulted in a significant improvement in fit statistics.
Partici pants were included in the analysis reg ardless of
how many testing sessions they actually attended. All
analyses were conducted on an intention-to-treat basis.
Figure 1 shows the number of participants tested at each
session.Asthepurposeofthispaperwastoevaluatethe
long-term effects of the intervention only data from the
baseline and follow-up data collections are included in
the current analysis. The results i mmediately post-inter-
vention using the mid-intervention and post-intervention
data points are published in Gorely et al [16].
Within the results tables the b coefficients represent
thedifferenceinthedependentvariablebytheunitsof
the fixed parameter. The reference category for gender
is boys and the control group is the reference category
for group. For example, for the steps outcome the b
coefficient for gender represents the difference in steps
for girls relative to boys, the b coefficient for time in
study represents the average change in steps for each
month of the study, and the b coefficient for the time
Gorely et al. International Journal of Behavioral Nutrition and Physical Activity 2011, 8:74
/>Page 5 of 11
by group interaction repre sents the difference in change
in steps for the intervention group relative to the con-
trol group. 95% confidence intervals were used to indi-
cate whether a difference is significant or not. If the
confidence interval contains zero then the associated
parameter estimate is not significant.
Transcripts of the teacher interviews and pupil focus
groups were analysed by question area to identify key
themes.
Results
Table 1 presents the absolute values at baseline and fol-
low-up for physical activity and body composition
variables.
Physical Activity
Table 2 shows the results of the multi-level regression ana-
lysis for steps per day, MVPA
total
,andMVPA
bout
.From
baseline to follow-up all participants significantly increased
their daily steps (controls: ~94 steps per study month;
intervention by ~117 per st udy month), equating to
around 2726 steps per day more in controls and 3404
steps more per day in the intervention group. This group
by time difference was not significant. A similar pattern
was observed for MVPA
bout
with all participants
increasing their time in sustained bouts of MVPA (con-
trols: ~ 0.3 minutes for every study month; intervention: ~
0.4 minutes for every study month) equating to around 9
minutes more per in the control group and 12 minutes in
the interv ention gro up. But again this group by time dif-
ference was not significant. At follow-up there was small,
but not significant, change in control p articipants daily
time in MVPA
total
(~0.2 minutes for every study m onth,
equating to around 6 minutes more per day at follow-up).
Intervention participants showed a slightly larger increase
in MVPA
total
(~0.6 minutes for every study month, equat-
ing to around 17 minutes more per day at foll ow-up).
However, this group by time difference was not significant.
For all physical activity measures the within pupils
between time variance was larger than the between pu pil
variances.
Body Composition
Table 3 shows the results of the multi-level regression
analysis for estimated body fat percentage, sum of skin-
folds, waist circumference, BMI, and BMI-SDS. There
were significant increases in estimated per cent body fat,
sum of skinfolds, waist circumference and BMI with
increasing age. In the control group, significant negative
coefficients for the age
2
term provide evidence for a
Table 1 Absolute values (mean, (SD)) at baseline and follow-up for physical activity and body composition variables
Variable Intervention Control
Boys Girls Overall Boys Girls Overall
Steps per day
Baseline 9789.3 (2929.1) 9397.8 (2559.4) 9579.4 (2735.6) 11178.0 (3662.5) 9452.4 (2654.7) 10278.5 (3284.3)
Follow-up 15007.7 (4250.7) 13393.3 (3573.0) 14213.3 (3998.9) 14663.5 (4182.6) 12978.8 (3507.6) 13775.0 (3919.8)
MVPA total
Baseline 138.9 (26.4) 113.9 (21.5) 124.7 (26.7) 125.4 (26.1) 116.6 (21.1) 120.3 (23.7)
Follow-up 141.3 (36.0) 119.0 (33.1) 128.3 (35.7) 125.5 (29.1) 104.6 (30.0)) 114.1 (31.1)
MVPA bouts
Baseline 52.3 (18.7) 30.7 (12.4) 40.1 (18.7) 44.7 (18.4) 30.4 (11.5) 36.5 (16.4)
Follow-up 65.2 (27.0) 45.3 (27.6) 53.7 (28.8) 57.4 (21.9) 36.7 (20.0) 46.1 (23.2)
Estimated body fat percentage
Baseline 18.5 (6.4) 26.7 (5.6) 22.6 (7.2) 17.6 (6.6) 25.8 (5.6) 21.7 (7.4)
Follow-up 21.4 (9.4) 28.0 (6.7) 24.7 (8.8) 20.2 (8.3) 26.7 (6.0) 23.6 (7.8)
Sum of skinfolds
Baseline 20.0 (8.5) 25.9 (11.2) 23.0 (10.3) 19.1 (8.9) 23.8 (10.3) 21.5 (9.9)
Follow-up 23.9 (13.1) 28.3 (13.3) 26.1 (13.3) 22.5 (11.5) 26.1 (11.9) 24.4 (11.8)
Waist circumference
Baseline 60.5 (6.9) 60.1 (8.9) 60.3 (7.9) 60.8 (7.5) 58.5 (6.7) 59.6 (7.2)
Follow-up 65.7 (7.7) 65.0 (9.8) 65.4 (8.8) 66.0 (7.4) 63.7 (7.3) 64.8 (7.4)
BMI
Baseline 17.7 (2.7) 18.1 (3.1) 17.9 (2.9) 17.2 (2.4) 17.5 (2.6) 17.3 (2.5)
Follow-up 18.9 (3.3) 19.6 (3.8) 19.3 (3.6) 18.8 (3.0) 18.8 (2.9) 18.8 (2.9)
BMI-SDS
Baseline 0.6 (1.1) 0.6 (1.1) 0.6 (1.1) 0.4 (1.1) 0.4 (1.0) 0.4 (1.1)
Follow-up 0.6 (1.2) 0.5 (1.2) 0.6 (1.2) 0.5 (1.2) 0.3 (1.0) 0.4 (1.1)
Gorely et al. International Journal of Behavioral Nutrition and Physical Activity 2011, 8:74
/>Page 6 of 11
plateauing in the rate of change in all body composition
variables, except BMI, with increasing age. The group by
age
2
interactions were significant for waist circumfer-
ence, BMI and BMISDS and suggest that the rate of
change in these variables continues to increase with age
in the intervention group.
Feedback from teachers
The majority of teachers interviewed recalled the Great-
Fun2Run programme and that the resources had been
useful for generating additional ideas for activities, but
only 2 of the 8 teachers said they were currently using
any of the resources. Both of these teachers commented
Table 2 Multilevel regression analysis for steps/day, and minutes of MVPA
Steps/day
±
MVPA
total
(mins/day)
±
MVPA
bout
(mins/day)
±
b CI* b CI b CI
Constant 11281.5
†
10641.3, 11921.6 126.2
†
119.2, 133.2 44.9
†
40.0, 49.8
Gender
¥
-1260.6
†
-1824.2, -696.9 -18.0
†
-24.5, -11.5 -18.0
†
-22.5, -13.6
Group** -1434.6
†
-2223.6, -645.6 3.3 -4.1, 10.7 5.4 -0.1, 11.0
Time in study (months) 93.8
†
59.3, 128.4 .23 -0.2, 0.6 0.3
†
0.1, 0.5
Group × time in study (month) 23.6 -8.5, 55.7 .35 -0.1,0.7 0.1 -0.1, 0.4
Age 377.5
†
52.6, 702.4 -5.6
†
-9.2, -1.9 n/a
School 1 1172.9
†
1093.5, 1252.2 n/a n/a
School 2 1996.4
†
1014.8, 2977.9 n/a n/a
School 6 n/a n/a 7.181
†
1.3, 13.1
Random parts variance CI variance CI variance CI
Level 2 (Between individuals) 3486392.8
†
1942487, 5030299 282.7
†
139.2, 426.3 89.9
†
15.3, 164.4
Level 1 (Within individuals) 7545611.0
†
6077926, 9013296 395.8
†
273.1, 518.6 247.7
†
172.8, 322.5
Notes:
±
The inclusion of SES did not improve the fit of the model and it was therefore not included.
*CI = 95% confidence interval; with level 2 variation (Between individuals) and with level 1 variation (within individuals or repeated measures).
†
= significant at p < 0.05;
¥
Reference category = boys; ** reference category = control.
Table 3 Multilevel regression analysis for body composition variables
Estimated % body fat
±
Sum of skinfolds
±
Waist circumference
±
b CI* b CI b CI
Constant 19.1
†
18.1, 20.1 20.8
†
19.2, 22.3 62.6
†
61.5,63.7
Sex
¥
7.5
†
6.4, 8.5 5.0
†
3.3, 6.6 -1.2
†
-2.4,-0.03
Group** 1.3
†
0.1, 2.5 0.4 -1.5, 2.3 0.9 -0.5, 2.2
Age 0.8
†
0.7, 1.0 1.4
†
1.2, 1.7 2.3
†
2.1, 2.4
Age
2
-0.2
†
-0.3, -0.03 -0.3
†
-0.6, -0.1 -0.2
†
-0.3, 01
Group × Age
2
0.2 -0.03, 0.4 0.3 0.0, 0.7 0.4
†
0.1, 0.6
School1 -1.8
†
-3.4, -0.1 n/a -2.0
†
-3.8, -0.1
School4 3.5
†
0.8, 6.3 n/a
Random parts variance CI variance CI variance CI
Level 2 (Between individuals) 34.5
†
2.5, 29.6 89.0
†
6.4, 76.5 44.6
†
3.1, 38.5
Level 1 (Within individuals) 10.0
†
0.7, 8.6 25.5
†
1.8, 21.9 11.2
†
0.8, 9.7
BMI
±
BMI-SDS
±
b CI b CI
Constant 17.8
†
17.3, 18.2 0.5
†
0.3, 0.6
Sex
¥
0.4 -0.05, 0.9 -0.1 -0.2, 0.1
Group** 0.4 -0.03, 0.9 0.1 -0.04, 0.3
Age 0.6
†
0.6, 0.7 0.02 0.0, 0.04
Age
2
-0.04 -0.1, 0.01 -0.03
†
-0.05, -0.01
Group × Age
2
0.1
†
.05, 0.2 0.04
†
0.02, 0.1
Random parts variance CI variance CI
Level 2 (Between individuals) 7.5
†
0.5, 6.6 1.1
†
0.1, 1.0
Level 1 (Within individuals) 1.0
†
0.1, 0.9 0.1
†
0.01, 0.1
Notes:
±
The inclusion of SES did not improve the fit of the model and it was therefore not included.
*CI = 95% confidence interval; with level 2 variation (Between individuals) and with level 1 variation (within individuals or repeated measures).
†
= significant at p < 0.05;
¥
Reference category = boys; ** reference category = control.
Gorely et al. International Journal of Behavioral Nutrition and Physical Activity 2011, 8:74
/>Page 7 of 11
particularly on the cross-curricula links. For example,
one teacher said:
I have (used the resources), not all of the resources
but I certainly have used the numeracy, they had
graphs and that kind of thing, so I used the numer-
acy and there was some literacy material as well,
talking about various things. And we used the
science ones, in revision as the children approached
their SATs [Standardised Assessment Tests].Itook
them out of the pack and used them in my planning
file and the children enjoyed them.
Reasons given for not continuing to use the resources
varied but reflected time issues, competing resources,
curriculum demands, and not teaching PE, as specialists
were now coming into the school. For example one tea-
cher comment ed, “ to be honest we didn’ tusethe
resource pack for the planning base, we’ ve got lots of
diff erent reso urce s, but we went mainly from the objec-
tives in the QCA [Qualification and Curriculum Author-
ity] units” . Similarly, another teacher explained: “We
have used it, I have used it minima lly I must admit,
you’v e got to make time, and we did use bits and pieces
that fitted in with the way that the curriculum is run in
this school.”
Factors perceived to influence the continued use and
impact of the programme included staffing changes,
school leadership, and continuing professional develop-
ment (CPD) support. For example, a number of teachers
felt that the impact of the programme was restricted
due to a limited ability to follow through the interven-
tion with the same pupils. As one teacher stated:
I think part of the problem has been obviously with
people changing roles and that staff turnover has
been high so there’ s been different people doing dif-
ferent jobs. I think as well if the same class teacher s
had been in the same year groups and followed
those children through, then they’ dhaveknown
what background had already been done and to
build on it from there. I think that is a little bit of
an issue. But yes, I think it’ s been positive for the
children involved and its just, as I said, given them a
fair insight into a healthy lifestyle for the future.
Teachers again stated the importance of strong leader-
ship from the head teac her in sustaining the programme.
They also felt that follow-up supp ort would have been
beneficial and would help the long-term sustainabilit y of
the programme. As explained by one teacher:
Whole school training, CPD, they’ve got to come in
and do that, you get these resources, you hand them
out but its having the time to actually, I mean I’ve
spoken to all the members of staff about it, given
them the resources, but the people who actually cre-
ate it, if they came in and talked to the teach ers that
would really help.
The final factor influencing the impact of the pro-
gramme that was raised by teachers was the importance
of support from the family. As one teacher stated “I
think a lot of it is home life, if the parents don’tpush
them towards sporting activities then you’re fighting a
battle straight away in school”.
Feedback from pupils
Pupils recalled various elements of the programme (e.g.,
the run/walks, the testing, the wall planner and the web-
site) and although not always recognising them as from
the “10 star rules”, they could recall many of the key
messages (e.g., 5 fruit and vegetables a day, eat breakfast,
drink water, 60 minutes PA a day etc). Most felt that
the different components of the programme had helped
them do more activity at the time and that the pro-
gramme had encouraged them to try new activities. The
vacation wall planner appeared to have been popular
and had encouraged them to do activities during the
holidays so that they could fill in the chart. As one child
said, “By using the planner, people, like I did, you carry
on doing it because you know that the planners there
and you want to use it. Then like when its over you just
continued doing it and its just to keep you fit really.” A
few children reported continued use of some of the
resources (e.g., a couple had continued to occasionally
use recipes they had got from the Space Cafe planet)
and a small number reported participating in other
mass participation events (e.g., a 5 km run/walk for
charity). It was not clear why more had not continued
to use resources or participate in other activities. The
overall feeling that emerged from the focus groups was
that when there were events organi sed for them to par-
ticipate in or resource s were pro vided they were willing
and happy to work towards the event or use the
resource, but this had not led to continued change
when the event was over or the resource removed. Parti-
cipants who had taken part in further events/activities
hadforthemostpartdonethiswiththeirparentsor
siblings.Inadditionwhenaskedaboutwhoorwhat
helped them have healthy lifestyles family members (and
most often parents) were generally mentioned first, fol-
lowed by teachers and friends. The main ways parents
helped included; doing sport with them, taking them to
sporting activities, paying for the sporting activities, buy-
ing them sporting equipment, going on sporting holi-
days, encouraging them to ‘go out and play’ rather than
watch television, and giving them healthy foods.
Gorely et al. International Journal of Behavioral Nutrition and Physical Activity 2011, 8:74
/>Page 8 of 11
Grandparents were also menti oned as being involved
with transporting their grandchildren to sporting activ-
ities and teaching them to play different sports such as
golf. However, some children also described how these
people could at times hinder participation in healthy
lifestyles by, for example, limiting time outside or pro-
viding unhealthy snack foods. For example one partici-
pant said: “Most of the time we’re not allowed out to be
able to run around and things because my Mum wants
to keep us safe”.
Discussion
This follow-up evaluation of the GF2R programme
showed that the positive changes in physical activity and
body composition observed at the end of the interven-
tion [16] were not sustained, and almost 2 years after
the intervention there were no significant differences
between the two groups for physical activity (bot h
groups had increased physical activity) and some evi-
dence for poorer outcomes in body composition within
the intervention group. The general increase in physical
activity across both groups may reflect seasonal differ-
ences in physical activity as the baseline measures were
conducted in autumn/winter and the follow-up mea-
sures were conducted in spring/summer.
At post interventio n both groups had increased their
physical activity but the increase was significantly
greater in the intervention group (e.g., 1532 steps/day
greater increase in the intervention group [16]). At fol-
low-up the difference in increase was smaller and n on-
significant (e.g., 678 steps/day greater increase in the
intervention group). Given that the difference between
groups is much lower at follow-up the non-significant
result is more likely to be a true reflection of no differ-
ence between the groups rather than a result of loss of
power due to diminishing sample size. There are a num-
ber of possible explanations for the lack of sustained
behaviour change observed.
The intervention itself lasted for only 10 months,
which may have been insufficient. Additionally the inter-
vention may not have been intensive enough. Two pri-
mary school interventions that have demonstrated
sustained intervention effects over 3 [5] and 4 [4] year
follow-ups were longer interventions in the first place (3
school years [5] and 6 school years [4]) and also
involved a much more intensive programme of interven-
tion. In the current study teachers were free to use their
professional judgement to choose which parts of the
intervent ion would best wor k for them and their pupils,
this may have resulted in low levels of exposure to dif-
ferent components of the intervention. Additionally, by
conducting the intervention over a longer period of time
participants would have been repeatedly expo sed to key
messag es and intervention activities potentially resulting
in a longer lasting effect. Even in the two studies [4,5]
which continued to show a significant intervention effect
for physical activity, the differences between intervention
and control groups were narrowing in magnitude over
time [5] suggesting that more research is needed to
investigate the best way to create sustained change as
children progress through to adolescence and adulthood.
Long-term interventions may be particularly important
in children as the type and purpose of physical activity
undertaken varies with age. At young ages basic move-
ment patterns are developed which form the foundation
for activity at later stages [21]. With growth, maturation,
and experience, these basic movements are coordinated
into more complex movement patterns that characterise
the free play, games and sports of older children [21].
Malina [22] suggested that until approximately 8 - 10
years the main emphasis is on greater physical activity
and particularly motor skills. After 8 - 10 years, the
emphasis becomes increasingly focused on prescriptive
physical activity, with an emphasis on health, fitness and
behavioural outcomes. These changes, alongside other
physical, social and cognitive changes occurring through
childhood and adolescence perhaps suggest that long-
term interventions that adapt to the changing needs of
the young person are required to support sustained
engagement with physical activity, and that it is perhaps
unrealistic to expect long-term impact of a one year
intervention within such a dynamic system. It is likely
that the nature and content of the interventions will
need to vary as children develop, and there is evidence
of programme evolution in both Manios [6] and Nader
[5]. van Sluijs et al. [15] suggested that traditional cogni-
tive approaches, potentially combined with environmen-
tal approaches, may increase activity among adolescents
and older children (> = 10 years), but more structural
environmental or policy changes might be needed to
change younger children’s physical activity.
The variance e stimates for the physical a ctivity mea-
sures reported in Table 2 demonstrate that over time
the variance within an individual is greater that the var-
iance between individuals. This is most likely to be a
reflection of the developmental changes discussed pre-
viously. This suggests that behaviour changes as children
develop, and for example gain greater autonomy and
independence, are greater within an individual than the
heterogeneity between subjects at any one point in time.
As with other studies [14] the focus groups in this
study highlighted the importance of parents in promot-
ing physical activity in children. The role of parents may
be particularly important in maintaining change through
the provision of ongoing enco uragement and tangible
support for participation. Greater emphasis on engaging
and supporting parents within school-based interven-
tions may be required to facilitate long-term change.
Gorely et al. International Journal of Behavioral Nutrition and Physical Activity 2011, 8:74
/>Page 9 of 11
By far the majority of teachers in this study had not
continued to use the resources provided during the
intervention period. While the teachers provided many
potential explanations for this, an important explanation
may lie in the philosophy of the intervention itself. The
intervention did not mandate the use of any resource
and teachers were free to choose what to use. In an
environment where teachers constantly seek to meet
changing curriculum demands and emphasis from regu-
latory authorities (see comments in focus groups) it may
be that teachers do not have the time to embed success-
ful intervention strategies long-term because they have
been pulled off in a different direction. Continued sup-
port to teachers and emphasis on the outcomes of stra-
tegies may be needed to make sure that successful
strategies are not overlo oked in the future, or a strategy
of phased support may be required. For example, Hae-
rens et al [23,24] reported on a 2-year long school-based
intervention in which the support offered to teachers
reduced over time. In the first year the teachers were
provided with guidanc e and support from the research
team to help get the intervention started, but in the sec-
ond year this external support was decreased with the
intention of increasing the autonomy of schools. It was
hypothesised that the second year would not lead to
additional positive changes but it was hoped that the
original changes would be sustained. Results showed sig-
nificant positive intervention effects for physical activity
at year 1 [23] which were sustained during year 2 [24].
While the long-term effects of this intervention have
not yet been evaluated, the strategy of phased support
may provide one avenue to ongoing intervention suc-
cess. This would support the comments from the tea-
chers in the current study who suggested that continued
input from the intervention team would have been help-
ful and welcomed.
Teachers and pupils alike recognised the importance
of the h ighlight events within the interv ention but
opportunities like this were not subsequently provided
by the schools. This is not surprising given the many
time demands and responsibilities of teachers. Ways to
continue to provide highlight events without increasing
the demands of teachers need to be explored. Likewise,
pupils liked the holiday materials and other resources
provided and reported that they thought they were use-
ful, however, very few children had taken the idea of
planning forward and continued to use some sort of
action planner. Further understanding of how best to
facilitate long-term use of such approaches is required.
The body composition results at follow-up are difficult
to explain from the data available, particularly in light of
the general increase in physical activity in both groups.
Nader et al [5] also reported no significant intervention
effect for body composition variables at 3-year follow-up
in the CATCH trial. Singh et al [25] reported on the
results of an 8-month multi-component health promo-
tion intervention aimed at preventing excessive weight
gain in young adolescents (12-14 years at baseline).
Intervention effects at the end of the program and at 4-
month and 12-month follow-up were presented. At the
12 month follow-up intervention effects remained for
sum of skinfolds in girls. However, no intervention
effects were observed in sum of skinfolds at any time
point in boys, and no intervention effects were observed
for BMI at any time point in both boys and girls. It is
obvious that challenges remain in identifying effective
strategies that result in long-term p ositive changes in
body composition among youth. The possibility of nega-
tive rebounds when interventions are removed needs
further investigation and may have important implica-
tions for the maintenance of a healthy body
composition.
Although this study has se veral strengths (e.g., objec-
tive measures of phys ical activity, multiple measures of
body composition) several methodological limitations
should be acknowledged. Although 70% of participants
were still present at follow-up the loss to foll ow-up was
greater in the intervention schools. Overall, there was
no difference (p > .05) at baseline in age, body composi-
tion, steps/day, or minutes of MVPA between those pre-
sent at follow-up and those absent. Due to the local
media content it was not possible to conduct a rando-
mised control trial. However, schools were matched on
key variables and there is debate as to the a ppropriate-
ness of randomised control trials for evaluating health
promotion interventions [26,27]. The group level match-
ing was not reflected at the individual level resulting in
the intervention group being of lower socioeconomic
status than the control group. However, including socio-
economic status in the analytical model s did not
improve the fit of the models suggesting that these dif-
ferences did not influence the outcomes.
The initial evaluation of the GF2R programme showed
that the strategies employed within the intervention
were effective in producing short-term changes in physi-
cal activity and body composition; however, this follow-
up evaluation shows that the changes were not sus-
tained. Thus questions remain as to how to effect long-
term favourable changes in health behaviours in young
people. Longer term interventions, with greater links
with families are most likely required but the exact nat-
ure a nd contribution of this involvement remains
unclear [28]. Further support to schools and teachers is
also likely to be required but the best way to provide
this within an already busy curriculum needs further
attention.
Gorely et al. International Journal of Behavioral Nutrition and Physical Activity 2011, 8:74
/>Page 10 of 11
Acknowledgements
The authors acknowledge the input of Great Run to the implementation of
the intervention. The authors also acknowledge the financial support of The
Coca-Cola Company. The funder was not involved in the collection, analysis
or interpretation of the data, or the preparation of the manuscript for
publication.
Author details
1
Institute of Youth Sport, School of Sport and Exercise Sciences,
Loughborough University, Loughborough, LE11 3TU, UK.
2
University of
Wolverhampton, School of Sport, Performing Arts and Leisure, Walsall
Campus, Gorway Road, Walsall, WS1 3BD, UK.
Authors’ contributions
TG, participated in the design of the study, managed the data collection
process, conducted the analysis and drafted the manuscript. JG, HM, SB, and
MN participated in the design of the study, the data collection process and
helped to draft the manuscript. AN supervised the statistical analyses. All
authors read and approved the final manuscript.
Competing interests
The authors declare that the y have no competing interests.
Received: 18 September 2010 Accepted: 18 July 2011
Published: 18 July 2011
References
1. Biddle S, Gorely T, Stensel D: Health-enhancing physical activity and
sedentary behaviour in children and adolescents. J Sports Sci 2004,
22:679-701.
2. Department of Health: At least five a week: Evidence of the impact of physical
activity and its relationship to health A report from the Chief Medical Officer
London: HM Government Stationary Office; 2004.
3. Biddle S, Mutrie N: Psychology of physical activity London: Routledge; 2008.
4. Manios Y, Kafatos I, Kafatos A: Ten-year follow-up of the Cretan Health
and Nutrition Education Program on children’s physical activity levels.
Prev Med 2006, 43:442-446.
5. Nader P, Stone E, Lytle LA, Perry C, Osganian S, Kelder S, Webber LS,
Elder JP, Montgomery D, Feldman HA, Wu M, Johnson C, Parcel G,
Luepker RV: Three-year maintenance of improved diet and physical
activity: The CATCH cohort. Arch Pediatr Adolesc Med 1999, 153:695-704.
6. Manios Y, Kafatos A: Health and Nutrition Education in elementary
school: changes in health knowledge, nutrient intakes and physical
activity over a 6 year period. Pub Health Nutr 1999, 2:445-448.
7. Timperio A, Salmon J, Ball K: Evidence-based strategies to promote
physical activity among children, adolescents and young adults: review
and update. J Sci Med Sport 2004, 7(suppl):20-29.
8. Verstraete S, Cardon G, De Clercq DLR, De Bourdeaudhuij IMM: A
comprehensive physical activity promotion programme at elementary
school: the effects on physical activity, physical fitness and psychosocial
correlates of physical activity. Pub Health Nutr 2007, 10:477-484.
9. Sahota P, Rudolf M, Dixey R, Hill A, Barth J, Cade J: Randomised controlled
trial of primary school based intervention to reduce risk factors for
obesity. BMJ 2001, 323:1029-1032.
10. Sahota P, Rudolf M, Dixey R, Hill A, Barth J, Cade J: Evaluation of
implementation and effect of primary school based intervention to
reduce risk factors for obesity. BMJ 2001, 323:1027-1029.
11. Warren J, Henry C, Lightowler H, Bradshaw S, Perwalz S: Evaluation of a
pilot school programme aimed at the prevention of obesity in children.
Health Prom Int 2003, 18:287-296.
12. National Institute for Health and Clinical Excellence: Promoting physical
activity for children and young people 2008 [ />13. Salmon J, Booth ML, Phongsavan P, Murphy N, Timperio A: Promoting
physical activity participation among children and adolescents. Epidem
Rev 2007, 29:144-59.
14. Dobbins M, DeCorby K, Robeson P, Husson H, Tirilis D: School-based
physical activity programs for promoting physical activity and fitness in
children and adolescents aged 6-18. Cochrane Database of Systematic
Reviews 2009.
15. van Sluijs EM, McMinn AM, Griffin SJ: Effectiveness of interventions to
promote physical activity in children and adolescents: systematic review
of controlled trials. BMJ 2007, 335:703.
16. Gorely T, Nevill M, Morris J, Stensel D, Nevill A: Effect of a school-based
intervention to promote healthy lifestyles in 7-11 year old children.
Int J
Behav Nutr Physical Activity 2009, 6:5.
17. Freedson PS, Sirard J, Debold E, et al: Calibration of the Computer Science
and Applications, Inc. (CSA) accelerometer. Med Sci Sports Exer 1997,
29(suppl):S45.
18. Cole T, Freeman J, Preece M: Body mass index reference curves for the
UK, 1990. Arch Dis Child 1995, 73:25-29.
19. Lohman T: Advances in body composition assessment Champaign, IL: Human
Kinetics; 1992.
20. Goldstein H: Multilevel Statistical Models London: Edward Arnold; 2003.
21. Strong W, Malina R, Blimkie C, Daniels S, Dishman R, Gutin B,
Hergenroeder A, Must A, Nixon P, Pivarnik J, Rowland T, Trost S, Trudeau F:
Evidence based physical activity for school-age youth. J Pediat 2005,
146:732-737.
22. Malina R: Fitness and performance: adult health and the culture of
youth, new paradigms? In New possibilities, new paradigms? (American
Academy of Physical Education Papers No 24). Edited by: Park R.,Eckert M.
Champaign, IL: Human Kinetics; 1991:30-38.
23. Haerens L, De Bourdeaudhuij I, Maes L, Cardon G, Deforche B: School-
based randomized controlled trial of a physical activity intervention
among adolescents. J Adolesc Health 2007, 40:258-65.
24. Haerens L, Deforche B, Maes L, Cardon G, Stevens V, De Bourdeaudhuij I:
Evaluation of a 2-year physical activity and healthy eating intervention
in middle school children. Health Educ Res 2006, 21:911-21.
25. Singh AS, Chin A Paw M, Brug J, Van Mechelen W: Dutch Obesity
Intervention in Teenagers: Effectiveness of a school-based program on
body composition and behavior. Arch Pediatr Adolesc Med 2009,
163:309-317.
26. Council on Sports Medicine and Fitness, Council on School Health: Active
healthy living: prevention of childhood obesity through increased
physical activity. Am Academy Pediatr 2006, 117:1834-1842.
27. Green J, Jones K: Towards a secure evidence base for health promotion.
J Pub Health Med 1999, 21:133-139.
28. Doak C, Visscher T, Renders C, Seidell J: The prevention of overweight and
obesity in children and adolescents: a review of interventions and
programmes. Obes Rev 2006, 7:111-136.
doi:10.1186/1479-5868-8-74
Cite this article as: Gorely et al.: Physical activity and body composition
outcomes of the GreatFun2Run intervention at 20 month follow-up.
International Journal of Behavioral Nutrition and Physical Activity 2011 8:74.
Submit your next manuscript to BioMed Central
and take full advantage of:
• Convenient online submission
• Thorough peer review
• No space constraints or color figure charges
• Immediate publication on acceptance
• Inclusion in PubMed, CAS, Scopus and Google Scholar
• Research which is freely available for redistribution
Submit your manuscript at
www.biomedcentral.com/submit
Gorely et al. International Journal of Behavioral Nutrition and Physical Activity 2011, 8:74
/>Page 11 of 11