Báo cáo y học: " Performance of the international physical activity questionnaire (short form) in subgroups of the Hong Kong chinese population" doc
Bạn đang xem bản rút gọn của tài liệu. Xem và tải ngay bản đầy đủ của tài liệu tại đây (291.38 KB, 10 trang )
RESEARCH Open Access
Performance of the international physical activity
questionnaire (short form) in subgroups of the
Hong Kong chinese population
Paul H Lee
1
,YYYu
1
, Ian McDowell
2
, Gabriel M Leung
1
, TH Lam
1*
and Sunita M Stewart
3
Abstract
Background: The International Physical Activity Questionnaire (IPAQ-SF) has been validated and recommended as
an efficient method to assess physical activity, but its validity has not been investigated in different population
subgroups. We examined variations in IPAQ validity in the Hong Kong Chinese population by six factors: sex, age,
job status, educational level, body mass index (BMI), and visceral fat level (VFL).
Methods: A total of 1,270 adults (aged 42.9 ± SD 14.4 years, 46.1% male) completed the Chinese version of IPAQ
(IPAQ-C) and wore an accelerometer (ActiGraph) for four days afterward s. The IPAQ-C and the ActiGraph were
compared in terms of estimated Metab olic Equivalent Task minutes per week (MET-min/wk), minutes spent in
activity of moderate or vigorous intensity (MVPA), and agreement in the classification of physical activity.
Results: The overall Spearman correlation (r) of between the IPAQ-C and ActiGraph was low (0.11 ± 0.03; range in
subgroups 0.06-0.24) and was the highest among high VFL participants (0.24 ± 0.05). Difference between self-
reported and ActiGraph-derived MET-min/wk (overall 2966 ± 140) was the smallest among participants with tertiary
education (1804 ± 208). When physical activity was categorized into over or under 150 min/wk, overall agreement
between self-report and accelerometer was 81.3% (± 1.1%; subgroup range: 77.2%-91 .4%); agreement was the
highest among those who were employed full-time in physically demanding jobs (91.4% ± 2.7%).
Conclusions: Sex, age, job status, educational level, and obesity were found to influence the criterion validity of
IPAQ-C, yet none of the subgroups showed good validity (r = 0.06 to 0.24). IPAQ-SF validity is questionable in our
Chinese population.
Keywords: Accelerometry, Assessment, Exercise, MET, Validation
Introduction
Physical activit y gr eatly contrib utes to overall health and
mental well-being and is associated with reduced mortality
[1-3], but physical inactivity and sedenta ry lifestyles ha ve
reached epidemic proportions [4]. Much attention has
been paid to developing reliable and valid instruments to
estimate activity levels and to measure the impact of inter-
ventions to promote physical activity [5]. Objective meth-
ods for measuring physical activity include motion sensors
(e.g., pedometers or accelerometers) and measures of
physiological response to exercise, such as heart rate
monitors [6,7]. The accelerometer is often used as the
gold standard against which self-report questionnaires are
compared [8]. Though objective, accelerometers may not
always be feasible to use because of cost and inconveni-
ence. A simple and valid self-report measure of physical
activity would have the advan tages of conv enience, rapid
data collection and low cost.
Of the many published questionnaires, the International
Physical Activity Questionnaire (IPAQ) has been investi-
gated in several populations. The IPAQ was developed by
the World Health Organization in 1998 (q.
ki.se) for surveillance of physical activity and to facilitate
global comparisons. The 31-item long form and the 9-
item short form assess t ime spent on different activities.
* Correspondence:
1
FAMILY: A Jockey Club Initiative for a Harmonious Society, School of Public
Health, Li Ka Shing Faculty of Medicine, University of Hong Kong, 21
Sassoon Road, Pokfulam, Hong Kong
Full list of author information is available at the end of the article
Lee et al. International Journal of Behavioral Nutrition and Physical Activity 2011, 8:81
/>© 2011 Lee et al; licensee BioMed Central Ltd. This is an Open Access article distributed under the terms of the Creative Commons
Attribution License (http://creativec ommons.or g/licenses/by/2.0), which permits unrestri cted use, distri bution, and reproduction in
any medium, provided the original work is properly cited.
The short form records four types of physical activity: vig-
orous activity such as aerobics; moderate-intensity activity
such as leisure cycling; walking, and sitting. The short
form is preferred by many researchers because it has
equivalent psychometric properties to the long form
despite being one-third the length [5]. The two forms have
been validated against accelerometer measurements in 12
countries with small samples of 19 to 257 participants.
Spearman correlations between the two measurement
methods were moderate at best, ranging from -0.12 to
0.57, with a pooled correlation of 0.30 [5]. The IPAQ cor-
related more closely with an objective measurement of vig-
orous physical activity than for other activity levels [4].
Despite these variable validity results, a recommend ation
wasmadethatIPAQ(shortform,referringtoactivityin
the past seven days) be used for surveillance and compari-
son of national trends [4,5].
The modest c orrelation with objective measurements,
combined with the wide variation in reported coeffi-
cients, raise concern in universally recommending the
IPAQ. Four studies presented sufficient data to allow for
more extensive analysis of the agreement between IPAQ
and accelerometer readings [9-12]. Using data from
these studies, we have calculated that the IPAQ overesti-
mated physical activity compared to accelerometers, by
35% i n Switzerland [11], 85% in Vietnam [10], 100% in
US [9], and b y 170% in Hong Kong [ 12]. The discre-
pancy between the measurements, and the wide range
of discrepancies, reinforces our concern over the instru-
ment’s cross-cultural suitability.
The inconsistent overestimate suggest s a bias (albeit to
widely varying extents) , complicated by random errors in
both the IPAQ and acceleromete r measurements. One
possibility is that the accelerometer is not as reliable as we
have believed, although why an ostensibly objective instru-
ment should vary so widely in different settings is not easy
to explain. A more plausible explanation is that the IPAQ
may be more accurate among some respondent groups
than in others, due to differences in trans lation or group
characteristics such as attitudes toward exercise or level of
understanding. Given the advantages of IPAQ, including
its ease of administration and low cost, it seems worth-
while to investigate whether its validity indices can be
improved. A first step may be to test the hypothesis that
the instrument performs more adequately in some sub-
groups than in others. If true, this would imply restriction
of its use in groups where it gives valid results, and shed
light on how the IPAQ could be corrected or built upon.
In this study, we examined variations in IPAQ validity in a
sample of Hong Kong Chinese adults, analyzed by sub-
groups defined in terms of sex, age, job status, educational
level, body mass index (BMI), and visceral fat level (VFL).
The translated Chinese version (IPAQ-C) was pre-
viously validated in Hong Kong [12] and in Guangzhou
[13], with weak-to-moderate correlations with ped-
ometer and accelerometer measurements (ranging from
0.09 [12] to 0.33 [13]). The Guan gzhou sample was
older than the Hong Kong sample (mean ages 65.2 vs.
28.7) [12,13], so perhaps age may affect the accuracy of
IPAQ reporting. Previous studies had also identified sex
as a factor that may affect the accuracy of self-reported
physical activity [4,14]. Job status may be another factor,
since respondents with a regular job may have a routine
daily schedule that facilitates recall of their physical
activity. The physical demands of the job may also influ-
ence reporting accuracy. In addition, educational level
may be associated with accuracy of self-reported physi-
cal activity data, and it would be expected that there
would be a better correlation of IPAQ data with objec-
tive measurement a mong those with more education as
they may have a better comprehension of the questions
compared to others [5]. Lastly, as overweight people
have a different physical activity pattern from others
[15] and the ir self-report could be affected by a social
desirability response bias, BMI or visceral fat level (VFL)
may also modify the accuracy of self-report data. In this
study, we aimed to investigate IPAQ-C accura cy by
examining questionnaire-accelerometer correlations by
sex, age, job status, educational level, BMI, and VFL.
Methods
Participants
This study was part of the Hong Kong Jockey Club
FAMILY Project cohort study which includes Hong Kong
families recruited since March 2009. Sampling was based
on a random selection of residential addresses provided by
the Hong Kong Census and Statistics Department. A
family was eligible when all members aged 15 years or
older, who lived in the same address and could understand
Cantonese, agreed to participate. For the present analyses,
we used baseline data on the first 5,000 families inter-
viewed during March to October, 2009. All eligible mem-
bers were interviewed by trained interviewers who entered
thedataintotabletPCs.Other details of the interview
have been described elsewhere [16]. Having completed the
survey, participants were invited (all members from the
households were invited for half of the households, while
for the other half a randomly drawn member was invited)
to take part in a sub-study by wearing an accelerometer
for four consecutive days (including a weekend). Written
consent was obtained from respondents and this study
was approved by the Institutional Review Board of The
University of Hong Kong.
Measurements
Body composition
Height was measured with SECA 214 stadiometer
(), wit h a precision of 1 mm.
Lee et al. International Journal of Behavioral Nutrition and Physical Activity 2011, 8:81
/>Page 2 of 10
Weight and VFL was measured with Omron fat analyzer
scale HBF-356 ( ron-healthcare.com.sg).
Its precision is 0.1 kg for weight and 1 unit for visceral
fat level. All measurements were taken in-person by
trained interviewers with standard protocols. BMI was
calculated by dividing weight (kg) by the square of
height (m
2
).
IPAQ-C
The 9-item IPAQ-C records self-reported physical activ-
ity in the last seven days [12]. Responses were converted
to Metabolic Equivalent Task minutes per week (MET-
min/wk) [5] according to the IPAQ scoring protocol:
total minutes over last seven days spent on vigorous
activity, moderate-intensity activity, and walking were
multiplied by 8.0, 4.0, and 3.3, respectively, to create
MET scores for each activity level. MET scores across
the three sub-components were summed to indicate
overall physical activity [5].
Accelerometer
The ActiGraph is widely used as an objective measure-
ment of physical activity and reported to be reliable and
valid [17-19]. The ActiGrap h GT1M uni-axi al acceler-
ometer () was to be wo rn
around the waist for four consecutive days spanning a
weekend for all waking hours, removed only for bathing
or sleeping. The choice of the first day (from Thursday,
Friday, or Saturday) was up to the partici pants. Records
with less than 600 minutes of registered time in a day
were excluded as invalid [4,5].
Following the grouping standard [20], we used one-
minute reference period for raw ActiGraph count data.
Data (as movement recorded in a one-minute period)
were then converted into minutes spent in moderate-
intensity (3.00-5.99 METs, 1952-5724 counts per min-
ute) or vigorous activity (≥ 6.00 METs, ≥ 5725 counts
per minute) [21]. The MET score per minute (MET-
min) for a day was computed with the following for-
mula: 8 × minutes spent in vigorous activity + 4 × min-
utes spent in moderate-intensity activity. As the IPAQ
covered 7 days but the ActiGraph only covered 4 days
(including a weekend), we averaged the 4-day ActiGraph
data according to the day of the week, and obtained a
weekly MET-min score by 5 × average weekday MET-
min + 2 × average weekend MET-min.
Other measurements
In addition to the IPAQ, the interview obtained demo-
graphic information and questions related to psychoso-
cial functioning. Tertiary education refers to those with
a bachelor’s degree or further education.
Statistical Analysis
Outliers on ActiGraph scores (> median + 1.5 i nter-
quartile range) and missing IPAQ-C data were removed
from the analysis. Independ ent t-tests were used to
compare the differences in the amount of moderate-
intensity, vigorous, and total physical activity between
IPAQ-C and ActiGraph. Because the MET-min/wk mea-
surements of neither the IPAQ -C nor ActiGraph were
normally distributed, Spearman correlations were used
to determine the correlations between IPAQ-C and
ActiGraph records (minutes and count data) by activity
level [5]. The Fisher’s r to z-test was used to compare
the difference between pairs of correlations. Correlations
and differences are presented with standard error for
computation of confidence interval as appropriate. Acti-
Graph-min equals 2 × minutes spent in vigorous activity
+ minutes spent in moderate-intensity activity, and Acti-
Graph-count equals raw counts in hours with any move-
ment. The proport ions of respondents who met the
Centers for Disease Control - American College of Sports
Medicine (CDC-ACSM) guideline, i.e., moderate-inten-
sity min/wk + 2 × vigorous min/wk ≥ 150 [22], were
computed with both the IPAQ-C and ActiGraph data.
We assessed the agreement between the two proportions
by comparing the observed proportion with the same
classification to the percent agreement that could have
occurred by chance. To further examine the agreement
of CDC-ACSM classification between IPAQ-C and Acti-
Graph, we categorized respondents into equal-sized
groups according to IPAQ and ActiGraph records, and
reported the proportion classified in the same group by
both methods. The observed proporti ons were also com-
pared to chance agreement (for 2 groups: probability of
being classified in the same activity group by both meth-
ods; for 3 groups: 33.3%; for 4 groups: 25.0%). In addi-
tion, the ActiGraph-measured MET-min/wk was
compared across IPAQ categories with one-way
ANOVA. ANOVA results with significant P-val ues (<
0.05) were further analyzed with the Tukey’s method. All
statistical analysis was performed using Predictive Analy-
tics SoftWare (PASW 18.0, formerly known as SPSS).
Results
Out of 11,713 respondents from 5,000 families, 2,511
(21.5%) respondents wore the ActiGraph. The character-
istics of ActiGra ph wearers and non-wearers were com-
parable, except for age (wearers 42.9 years, vs 44.8 for
non-wearers, P < 0.001), job status (58.7% full-time
employment for wearers vs 49.4% for non-wearers, P <
0.001), and percentage of respondents passing the CDC-
ACSM guideline (passing rate = 92.5% for wearers vs
47.1% for non-wearers). Excluding ActiGraph invalid
data(eitherwearingforlessthanfourdaysornotfol-
lowing the 2 weekdays + 2 weekends format) (n =
1,151) and IPAQ missing data (n = 90), we kept 1,270
respondents in the present analysis: 10.8% of the whole
sample. There were no significant differences between
the characteristics of the valid and invalid samples.
Lee et al. International Journal of Behavioral Nutrition and Physical Activity 2011, 8:81
/>Page 3 of 10
Table 1 shows that 585 (46.1%) of the respondents
were male, 735 (58.3%) had a full-time job, 299 (24.3%)
attained tertiary education, and 399 (31.5%) were over-
weight based on BMI (≥ 25), or 347 (29.5%) overweight
based on VFL (≥ 10%). The mean age was 42.9 years
(range: 15 to 82 years, inter-quartile range = 20 years).
Table 2 shows that self-reported MET-min per week
exceeded the ActiGraph readings by 231% for tot al phy-
sical activity, by 236% for moderate-intensity, and by
1047% for vigorous-intensity physical activity (P <0.001
for all comparisons). Although physical activity time
reported in IPAQ-C was significantly greater than that
measured by ActiGraph, the two measurements were
positively correlated (Table 2). The correlation between
IPAQ-C and ActiGraph MET-min was significant but
weak for total physical activity, moderate-intensity activ-
ity, as well as for vigorous-intensity activity. The correla-
tions between ActiGraph count data and IPAQ-C
moderate min, IPAQ-C vigorous min, IPAQ-C MET-
min were significant but also weak. As reported in pre-
vious research [23], the IPAQ-ActiGraph correlation
was higher when results were expressed in counts than
in total MET-min (r = 0.16 vs 0.11, P < 0.05).
Table 3 further shows that, in general, the correlations
between IPAQ-reported MET and ActiGraph were
higher when ActiGraph raw count data were used. In
terms of IPAQ total MET by subgroup, IPAQ-Acti-
Graph correlations appeared to be higher for males,
older age groups, those wit h a full-time job of high ph y-
sical demand, those with lower education attainment,
and those who were overweight (by classification of
either BMI or VFL), yet none of these effects reached a
signi ficant level except VFL (P = 0.01). The highest cor-
relation between IPAQ total MET and ActiGraph was
found among those with higher VFL (ActiGraph count
data, r = 0.31). Furthermore, the IPAQ-ActiGraph cor-
relation was higher among those with higher VFL than
those with normal VFL, rega rdless of physical activity
groups or t he ActiGraph measurements used. In con-
trast, the lowest correlation between IPAQ total MET
and ActiGraph was found among those aged 29 years or
younger (ActiGraph count data, r = 0.04).
Table 3 also shows the IPAQ-ActiGraph correlations
for physical activity subgroups classified by both IPAQ
report and ActiGraph data (only in MET-min). Regard-
ing moderate-intensity activity, the correlation s had
Table 1 Demographic characteristics of the 1,270 respondents
n Age
mean
(S.D.)
Male
n (row %)
Full-time
worker
n (row %)
Tertiary
Education
n (row %)
Weight
(kg)
mean
(S.D.)
Height
(cm)
mean
(S.D.)
BMI
mean
(S.D.)
VFL
mean
(S.D.)
Total 1270 42.9 (14.4) 585 (46.1%) 745 (58.7%) 299 (24.3%) 61.6 (12.4) 161.8 (8.7) 23.5 (3.9) 7.5 (4.6)
Sex
Male 585 43.5 (15.3) N/A 376 (64.3%) 153 (26.9%) 64.9 (12.5) 165.5 (7.9) 23.6 (3.8) 8.7 (4.9)
Female 685 42.4 (13.5) N/A 369 (53.9%) 146 (22.0%) 58.8 (11.7) 158.5 (8.1) 23.4 (4.0) 6.5 (4.2)
Age, years
≤29 232 21.7 (4.3) 110 (47.4%) 98 (42.2%) 85 (38.0%) 58.9 (13.9) 164.2 (9.4) 21.7 (4.0) 4.4 (3.5)
30-49 629 40.3 (5.6) 273 (43.4%) 472 (75.0%) 172 (28.0%) 62.9 (12.6) 162.3 (8.8) 23.8 (3.9) 7.3 (4.4)
≥ 50 409 59.0 (7.7) 202 (49.4%) 175 (57.2%) 42 (10.7%) 61.2 (11.0) 159.5 (7.8) 24.0 (3.6) 9.2 (4.7)
Full-time worker
Yes - high
PD
105 44.5 (9.9) 61 (58.1%) N/A 7 (6.9%) 65.3 (12.5) 163.7 (8.4) 24.3 (3.7) 8.7 (5.0)
Yes - low PD 630 41.1 (10.3) 310 (49.2%) N/A 211 (34.5%) 62.5 (12.4) 163.1 (8.7) 23.4 (3.7) 7.3 (4.5)
Not full-time 525 54.1 (8.8) 303 (46.0%) 350 (53.1%) 87 (13.6%) 62.4 (11.5) 160.2 (8.3) 24.2 (3.7) 8.9 (4.7)
Tertiary education
Yes 299 37.2 (12.0) 153 (51.2%) 224 (74.9%) N/A 62.2 (12.8) 163.8 (9.0) 23.1 (3.7) 6.8 (4.7)
No 933 44.7 (14.5) 416 (44.6%) 499 (53.5%) N/A 61.4 (12.1) 160.9 (8.7) 23.7 (3.9) 7.7 (4.6)
BMI
Overweight
(≥ 25)
399 46.1 (12.4) 201 (50.4%) 317 (60.7%) 84 (21.8%) 73.9 (10.7) 162.4 (9.1) 28.0 (2.7) 12.3 (3.9)
Normal(< 25) 868 41.2 (15.0) 382 (44.0%) 501 (57.7%) 214 (25.4%) 55.9 (8.4) 161.5 (8.5) 21.4 (2.3) 5.2 (2.9)
VFL, %
Overweight
(≥ 10)
347 49.9 (12.1) 219 (63.1%) 211 (60.8%) 75 (22.4%) 74.0 (10.5) 164.0 (8.8) 27.5 (3.1) 13.4 (3.2)
Normal(< 10) 830 41.4 (12.9) 316 (38.1%) 515 (62.1%) 214 (26.6%) 56.7 (9.1) 160.6 (8.5) 22.0 (2.8) 5.0 (2.4)
PD: physical demand, BMI: body mass index, VFL: visceral fat level.
Lee et al. International Journal of Behavioral Nutrition and Physical Activity 2011, 8:81
/>Page 4 of 10
similar patterns as those found with total MET. How-
ever, for the vigorous activity level, the patterns of the
correlations were inconsistent by age or employment
group.
Table 4 compares total time spent on physical activity
reported in the IPAQ-C to ActiGraph readings, by sub-
group. On every comparison, the self-report question-
naire produced much higher estimates of time spent on
physical activity than the objective device (by 151% to
5670%). However, the overestimates were not consistent
across groups. For time spent on moderate-intensity
activity, men overestimated slightly less than women did
(differences in min/day = 92.4 vs 111.3, P <0.05),buton
vigorous activity men overestimated more (min/day =
16.1 vs 8.5, P < 0.01). The comparisons across groupings
by body mass (lack of statistical significance) or visceral
fat (P < 0.05) had a similar reverse pattern regarding time
spent on different levels of physical activity. Those with
Table 2 Comparisons of IPAQ-C and ActiGraph for three categories of physical activity
Moderate activity
Minutes per day
Vigorous activity
Minutes per day
Total MET
Per week
IPAQ-C, mean(SD) 146.2 (164.8) 13.2 (46.1) 4250.6 (5053.9)
ActiGraph, mean(SD) 43.6 (23.9) 1.2 (3.1) 1284.3 (728.1)
IPAQ-C vs ActiGraph, difference (SE) 102.6*** (4.6) 12.0*** (1.3) 2966.3*** (140.1)
IPAQ-C vs ActiGraph -min, Spearman r correlation (SE) 0.09** (0.03) 0.16*** (0.03) 0.11*** (0.03)
IPAQ-C vs ActiGraph-count, Spearman r correlation (SE) 0.14*** (0.03) 0.06* (0.03) 0.16*** (0.03)
MET: metabolic equivalent task per week (ActiGraph: 8*vigorous min + 4*moderate min, IPAQ: 8*vigorous min + 4*moderate min + 3.3*walking min).
* P < 0.05.
** P < 0.01.
*** P < 0.001.
Table 3 Spearman correlations of IPAQ-C and ActiGraph-measured physical activity by subgroup using ActiGraph time
and count data
ActiGraph activity levels and measurements
ActiGraph-min (moderate min) ActiGraph-min (vigorous min) ActiGraph-min ActiGraph-count
Respondent characteristics\IPAQ activity
level
Moderate Vigorous Total MET Total MET
Sex
Male 0.10* 0.23*** 0.14*** 0.18***
Female 0.09* 0.09* 0.09* 0.15***
Age, years
≤29 0.05 0.21*** 0.06 0.04
30-49 0.09* 0.12** 0.12** 0.19***
≥ 50 0.12* 0.14** 0.15** 0.25***
Full-time worker
Yes - high PD 0.19* 0.25** 0.18* 0.16
Yes - low PD 0.10* 0.10** 0.12** 0.20***
Not full-time 0.06 0.21*** 0.07 0.08
Tertiary education
Yes 0.03 0.17** 0.09 0.08
No 0.11*** 0.17*** 0.12*** 0.18***
BMI
Overweight (≥ 25) 0.10 0.22*** 0.14** 0.21***
Normal (< 25) 0.09** 0.14*** 0.10** 0.14***
VFL, %
Overweight (≥ 10) 0.18*** 0.23*** 0.24*** 0.31***
Normal (< 10) 0.08* 0.10** 0.09* 0.14***
ActiGraph-min: time spent in moderate-to-vigorous physical activity (2 × minutes spent in vigorous activity + minutes spent in moderate-intensity activity,
ActiGraph-count: raw counts in hours with any movement recorded, MET: metabolic equivalent task per week (8*vigorous min + 4*moderate min + 3.3*walking
min), PD: physical demand.
* P < 0.05.
** P < 0.01.
*** P < 0.001.
Lee et al. International Journal of Behavioral Nutrition and Physical Activity 2011, 8:81
/>Page 5 of 10
physically demanding full-time jobs overestimated their
physical activity time to a greater extent compared to
others, appro ximately two times mo re on moderate-
intensity activity and seven times more on vigorous activ-
ity (P < 0.001). Those with tertiary education overesti-
mated their exercise time to a lesser extent than
respondents without (P < 0.001). There was no observa-
ble pattern of overestimation by age group, although
younger people seemed to have overestimated to a
greater extent compared to those aged 30 or over.
We assessed the agreement of the two measurements
in classifying respondents in terms of meeting the CDC-
ACSM physical activity guideline (details can be found
in Additional file 1). We found that the overall IPAQ-
ActiGraph agreement was only slightly better than
chance agreement ( 81.3% vs 79.6%, P < 0.001). The
agreement in the classification was better among
respondents who had a physically demanding full-time
job than those with physically non-demanding full-time
jobs and those without full-ti me jobs (91.4%, 82.5%, and
Table 4 Average time (in minutes per day) spent on physical activity measured by the IPAQ-C and ActiGraph, and
differences between the two measurements, by level of activity and respondent characteristics
Moderate intensity activity per day Vigorous intensity activity per
day
Metabolic equivalent task per week✩
IPAQ-C# ActiGraph# Difference† IPAQ-
C#
ActiGraph# Difference† IPAQ-C# ActiGraph# Difference†
Sex
Male 137.7
(147.5)
45.2
(23.9)
92.4***
(6.1)
17.4
(51.5)
1.3
(3.4)
16.1***
(2.1)
4290.5
(5124.8)
1339.6
(736.7)
2950.9***
(209.9)
Female 153.4
(178.0)
42.1
(23.9)
111.3***
(6.7)
9.6
(40.7)
1.0
(2.8)
8.5***
(1.6)
4216.6
(4996.1)
1237.1
(717.8)
2979.5***
(188.2)
Age, years
≤29 150.0
(157.0)
39.1
(20.8)
110.9***
(10.3)
17.7
(39.9)
1.4
(3.2)
16.3***
(2.6)
4556.9
(4674.1)
1171.2
(635.7)
3385.8***
(305.8)
30-49 143.6
(173.5)
43.8
(22.3)
99.8***
(6.9)
11.8
(45.0)
1.00
(2.7)
10.8***
(1.8)
4118.9
(5139.1)
1282.2
(679.5)
2836.7***
(203.0)
≥ 50 147.9
(155.4)
45.7
(27.4)
102.2***
(7.5)
12.8
(50.9)
1.3
(3.6)
11.5***
(2.5)
4279.5
(5132.5)
1351.8
(835.2)
2927.7***
(248.6)
Full-time
worker
Yes - high
PD
253.9
(233.2)
57.7
(33.2)
196.2***
(22.1)
57.7
(33.2)
1.0
(2.6)
56.3***
(10.6)
9384.4
(8721.6)
1671.8
(966.3)
7712.6***
(835.3)
Yes - low PD 142.5
(174.2)
44.3
(21.7)
98.2***
(6.9)
8.7
(32.9)
1.0
(2.8)
7.7***
(1.3)
3904.9
(4834.3)
1297.4
(664.7)
2607.6***
(191.1)
Not full-time 130.2
(125.6)
40.1
(23.2)
90.1***
(5.6)
10.0
(32.9)
1.3
(3.5)
8.6***
(1.4)
3679.3
(3580.6)
1196.2
(723.3)
2483.2***
(158.6)
Tertiary education
Yes 107.0
(126.0)
42.7
(20.0)
64.2***
(7.4)
9.0
(22.6)
1.1
(2.9)
7.9***
(1.3)
3062.4
(3595.4)
1258.6
(599.1)
1803.9***
(208.4)
No 157.8
(173.8)
43.7
(25.1)
114.1***
(5.6)
14.4
(51.5)
1.2
(3.2)
13.2***
(1.7)
4601.9
(5386.8)
1290.3
(766.8)
3311.7***
(174.0)
BMI
Overweight
(≥ 25)
152.9
(174.1)
44.5
(24.6)
108.4***
(8.6)
13.0
(42.2)
1.2
(3.4)
11.8***
(2.1)
4411.7
(5339.2)
1315.0
(771.6)
3096.7***
(263.5)
Normal
(<
25)
143.4
(160.5)
43.1
(23.6)
100.3***
(5.4)
13.3
(47.9)
1.1
(2.9)
12.2***
(1.6)
4187.3
(4923.9)
1270.5
(706.4)
2916.8***
(165.4)
VFL,
%
Overweight
(≥ 10)
134.9
(150.4)
47.9
(25.9)
87.1***
(7.9)
14.6
(51.2)
1.4
(3.7)
13.2***
(2.8)
4063.8
(5231.5)
1416.8
(811.1)
2647.0***
(274.5)
Normal (<
10)
150.2
(170.2)
42.6
(23.2)
107.6***
(5.8)
11.8
(44.7)
1.0
(2.7)
10.8***
(1.6)
4271.6
(5044.0)
1251.4
(693.5)
3020.2***
(172.9)
PD: physical demand.
✩ 8*vigorous min + 4*moderate min, IPAQ: 8*vigorous min + 4*moderate min + 3.3*walking min.
# Data are presented as mean (standard deviation).
† Data are presented as mean (standard error).
* P < 0.05.
** P < 0.01.
*** P < 0.001.
Lee et al. International Journal of Behavioral Nutrition and Physical Activity 2011, 8:81
/>Page 6 of 10
77.9%, respectively, P < 0.05). Males had higher agree-
ment between the two classifications than did females
(83.9% vs 79.0%, P < 0.05).
We also assessed the IPAQ-ActiGraph agreement in
classifying respondents into tertile and quartile of activ-
ity level, against classification based on chance (33% for
tertile and 25% for quartile). The observed agreement
was significantly better than chance except for the
group aged ≤29 years and those with tertiary education.
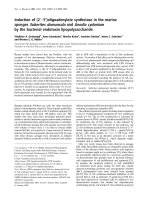
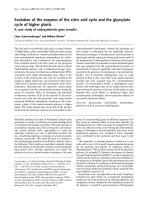
Lastly, we compared the mean MET min/wk mea-
sured by ActiGraph across equal-sized groups based on
IPAQ scores (Figure 1). Overall, the ActiGraph readings
were higher for groups classified by IPAQ as being
more activ e than for less active groups. The mean Acti-
Graph-measured time was significantly different by
IPAQ grouping in all three groupings (P < 0.001). In the
3-group comparison, the ActiGraph MET min/wk in the
highest IPAQ group was significantly more than the
other two groups (1186 vs 1402, P < 0.001; 1259 vs
1402, P < 0.05, respectively), but the difference in MET
min/wk between the other two groups was not signifi-
cant (1186 vs 1259, P = 0.31). In the 4-grou p compari-
son, the ActiGraph MET min/wk in the highest IPAQ
group (group 4) was significantly more than groups 1
and 3 (1152 vs 1419, P < 0 .001; 1266 vs 1419, P <0.05,
respectively), but the differences among the other three
groups were not significant (1152 vs 1296 vs 1266, P =
0.06, P for trend = 0.28).
Discussion
Although the IPAQ has been recommended as a surveil-
lance instrument, we argue that the validation studies of
IPAQ do not generally provide strong em pirical support
for its validity compared against objective measures of
physical activity [4,5,12,13,23,24]. The correlations of
0.30 [5] are far lower than the agreement between self-
report and objective measurements of other health vari-
ables, such as smoking [25], body weight [26] or hyper-
tension [27]. To rule out Simpson’ s paradox [28] (i.e.,
signs of correlation are positive in all groups, but the
correlation becomes negative when groups are pooled
together), we studied correlations of the IPAQ with an
objective measurement in different subgroups. This
would also indicate whether the questionnaire instru-
ment works better for certain subgroups. To our knowl-
edge, this was the first study to examine how
demographic factors and obesity affect the correlation,
difference, and agreement between IPAQ and ActiGraph
measure ments. However, none of the subgroups showed
an acceptable IPAQ-ActiGraph correlation, although the
correlations did seem to be higher in certain groups (e.
g. males and those with high V FL). The Spearman cor-
relationsforallgroupsinthisstudywerepositive,but
lay at the lower end of the range of previously reported
figures (-0.12 t o 0.57) [5,2 9]. Based on our findings, we
question the validity of IPAQ-SF when administered to
Hong Kong Chinese respondents.
Contrary to our expectation, differences in age, work-
related physical activity level, education, and BMI did
not appear to influence the correlation between IPAQ
and ActiGraph. Regarding the slightly higher correlation
among those with higher VFL, we postulated that per-
haps they were more conscious of their physical activ-
ities. In support of this, we found that respondents with
higher VFL had higher variation in ActiGraph-measured
total physical activity (sd = 811.1 vs 693.5 for lower VFL
group, P < 0.001), which may mean they had a more
distinctive physical activity patte rn, hence easier to
recall. The strength of the IPAQ-ActiGraph correla tion
was weak among those did not have tertiary education
and weaker for those did (Table 3). However, there was
no statistical significance when the two correlations
were compared (P >0.05).Ontheotherhand,incon-
sidering absolute differences between the two methods
of measurement (Table 4), over-reporting by respon-
dents without tertiary education nearly doubled that of
those with tertiary education (differences in MET-min/
wk: 3317.7 vs 1803.9, P < 0.001). The performance of
the IPAQ is better among those with higher education.
Although over-reporting with activity quest ionnaires is
ubiquitous and has been linked to social desirability bias
[30], there were several possible explanations why the
correlations in our study were lower than those pre-
viously reported. First, we asked the respondents to
wear the activity monitor after they had completed the
IPAQ, while in other studies respondents were often
asked to wear the device before they took the IPAQ.
Figure 1 ActiGraph-measured time on physical activity (MET
min/wk) by equal groups of IPAQ-C. + Q1: time spent in
moderate-to-vigorous physical activity < 150 minutes per week; Q2:
time spent in moderate-to-vigorous physical activity ≥ 150 minutes
per week. # Q1, Q2, and Q3 are the first, second, and third tertile,
respectively. ✩ Q1, Q2, Q3, and Q4 are the first, second, third, and
fourth quartile, respectively.
Lee et al. International Journal of Behavioral Nutrition and Physical Activity 2011, 8:81
/>Page 7 of 10
The latter approach could have yielded higher IPAQ-
ActiGraph agreement, as the self-report responses may
have been modified because of the increased awareness
arising from wearing the activity monitor. Also, in our
study the IPAQ recall period preceded the time when
the ActiGr aph was worn by one to two weeks. This dif-
ferent time-period could have contributed to the lower
correlation (0.16) compared to studies that used the
same time-period (0.30) [5]. However, given the stability
of IPAQ (3- to 7-day test-retest reliability: 0.81 [5]), we
do not believe that having the same recall periods would
have substantially altered the results.
Second, the IPAQ has been found to overestimate
physical activity to a greater extent than other physical
activity questionnaires, such as the Active Australia Sur-
vey and the U.S. Behavioral Risk Factor Surveillance Sys-
tem [24]. In this study, the IPAQ overestimated physical
activity measured by the ActiGraph from 149% to 461%
(mean 231%), which was similar to the finding pre-
viously reported in Hong Kong (173%) [12].
Third, how the ActiGraph was applied in different stu-
dies may have led to the differences in results. In this
study, the respondents were instructed to remove the
ActiGraph during aquatic activities because it is not
waterproof. Therefore, movement during activities such
as swimming would not have been captured. Second,
respondents were instructed to wear the ActiGraph on
the hip, as suggested in Trost et al.[31].Thus,theActi-
Graph may not have accurately measured physical activ-
ity during which movement of the hip was limited, such
as cycling. It has been reported that Hong Kong young
adults swim and ride bicycles more often than older
adults [32]. Because accelerometers underestimate these
activities, this could be an explanation for our finding of
weak IPAQ-ActiGraph correlation in young adults.
Furthermore, In a Hong Kong survey, swimming and
cycling was the favorite sports activity for 11% and 6%,
respectively, of the respondents [33]. Thus, the underesti-
mation of ActiGraph-measured physical activity may not
have been negligible in this study. In sum, these three
sources together may probably have had an effect on
reducing the IPAQ-ActiGraph correlation in this study.
In practice, physical activity measurements may be
most relevant in grouping participants into different
intensity levels of physical activity (e.g., into two or
three groups). The convent ional classification scheme is
≥ 150 minutes per week of physical activity of at least
moderate intensity [5,22,24]. Based on this guideline,
classification of activity by IPAQ and ActiGraph agreed
closely (81.3%), although barely better than what could
have been achieved by chance (79.6%). Furthermore,
regardless of how the respondents were grouped, the
IPAQ-ActiGraph agreements were only slightly better
than by-chance agreement.
The IPAQ-ActiGraph agreement in classification was
slightly better than a chance agreement, but the two
measure ments did seem to correlate better among those
who were more physically active. There was a linear
trend in ActiGraph-measured time when we grouped
the respondents into three equal-sized groups by IPAQ.
However, when the respondents were divided into four
IPAQ groups, the intermediate groups were not clearly
different in terms of their objectively-measured activity
levels. T his agrees with a previous finding in Japan [34]
that showed IPAQ could only roughly classify mildly
and moderately active respondents.
Our results provided some insights for possible modi-
fications of IPAQ-C. First, job-related physical activity
level seemed to have had an effect on the difference
between IPAQ and ActiGraph measurements. Those
who performed in highly physically demanding condi-
tions had the largest difference between their self-report
and the ActiGraph-mea sured physical activity. In parti-
cular, they reported an average of 57.7 minutes of vigor-
ous physical activity per day, which was over six times
that of the self-reported vigorous physical activity by the
other respondents. However, according to the ActiGraph
on average they only did 1.0 minute of vigorous physical
activity per day, no more than the vigorous physical
activity performed by other respondents. Conceivably,
however, the Actigraph under-estimated lifting activities.
This raises the possibility that the accuracy of the
IPAQ-C may be improved by separating physical activity
into occupational and leisure types (as in the Global
Physical Activity Questionnaire) [35]. Because respon-
dents overestimated occu pational physical activity more
than other types of activity, reducing the weight of occu-
pational activity may improve the accuracy of IPAQ
total MET score. Furthermore, separating physical activ-
ity into occupational and leisure types could allow
researchers to analyze the benefits of physical activity, at
work and at leisure, in relation to health [36].
Second, more detailed instructions [37] may be
needed. For those with lower education, more concrete
examples of different levels of physical activity intensity
may be necessary, as our results indicated that this
group had exaggerated their total physical activity more
than the others.
The study had several limitations. First, those who
agreed to wear the accelerometer might have been
healthy volunteers, with different physical activity pat-
terns from those who were less active, as the percentage
of respondents who passed the CDC-ACSM guideline
was double that of non-respondents. Also, those who
were extremely active might have found it too much of
a burden to wear the accelerometer and declined to par-
ticipate. Nevertheless, the results indicated that, demo-
graphically, those who wore the accelerometer were not
Lee et al. International Journal of Behavioral Nutrition and Physical Activity 2011, 8:81
/>Page 8 of 10
different from the rest of the sample except for being
slightly younger and less likely to have full-time employ-
ment. Second, although the accelerometer has been
used as go ld standard for questionnaire validation
[17-19], we did not have evidence for its validity or
reliability in this study. Lastly, similar to other IPAQ
validation studies, we adopted the cut-off points for
intensity level suggested by Freedson et al. [21], which
have not been validated in Chinese populations [12].
However, given our consistent results with the different
classification schemes, we do not expect that different
cut-off values would yield significantly different findings.
Conclusions
Although the IPAQ has been recommended and widely
used, it has not been found to correlate highly with
objective measurements of physical activity, and tends
to overestimate MET scores. We investigated the criter-
ion validity of the IPAQ in a Hong Kong Chinese popu-
lation, grouping our sample by several different
variables. We found that it performed poorly in most
subgroups when compared to accelero meter data, but
slightly better for the highly active respondents.
Despite such low correlations of the IPAQ with Acti-
Graph in the Chinese population, it is one of the easiest
of physical activity questionnaires to administer with
less than 10 questions [38]. A correlation of 0.3 - 0.4 is
perhaps as close as can be expected for criterion validity
of a physical activity questionnaire with 10 questions,
against a mechanical device that detects body move-
ment. Further research to improve IPAQ is urgently
needed.
Additional material
Additional file 1: Agreement between IPAQ-C and ActiGraph
classification by CDC-ACSM physical activity guideline
Acknowledgements
We sincerely thank Wilson W. S. Tam, Ben K. K. Li, and Paul T. K. Wong
(School of Public Health, The University of Hong Kong) for their role in the
development of the survey instrument and for the preparatory work for this
research.
Author details
1
FAMILY: A Jockey Club Initiative for a Harmonious Society, School of Public
Health, Li Ka Shing Faculty of Medicine, University of Hong Kong, 21
Sassoon Road, Pokfulam, Hong Kong.
2
Department of Epidemiology and
Community Medicine, University of Ottawa, 451 Smyth Road, Ottawa,
Canada.
3
Department of Psychiatry, University of Texas Southwestern
Medical Center at Dallas, 5323 Harry Hines Boulevard, Dallas, Texas, 75390,
USA.
Authors’ contributions
All authors contributed substantially to the design, implementation, analysis
and writing of the present paper. The project was designed by GML and
THL, the data collection was performed by PHL and YYY, the analysis of the
data and interpretation was conducted by PHL, YYY, IM, THL, and SMS the
paper was drafted by PHL with significant revision by YYY, IM, GML, THL,
and SMS. All authors read and approved the final manuscript.
Competing interests
The authors declare that they have no competing interests.
Received: 10 March 2011 Accepted: 1 August 2011
Published: 1 August 2011
References
1. Paffenbarger RS Jr, Hyde RT, Wing AL, Hsieh CC: Physical activity, all-cause
mortality, and longevity of college alumni. New England Journal of
Medicine 1986, 314:605-613.
2. Paffenbarger RS Jr, Hyde RT, Wing AL, Lee IM, Jung DL, Kampert JB: The
association of changes in physical-activity level and other lifestyle
characteristics with mortality among men. New England Journal of
Medicine 1993, 328:538-545.
3. Schooling CM, Lam TH, Li ZH, Ho SY, Chan WM, Ho KS, Tham MK,
Cowling BJ, Leung GM: Obesity, physical activity and mortality in a
prospective Chinese elderly cohort. Archives of Internal Medicine 2006,
166:1498-1504.
4. Boon RM, Hamlin MJ, Steel GD, Ross JJ: Validation of the New Zealand
physical activity questionnaire (NZPAQ-LF) and the international physical
activity questionnaire (IPAQ-LF) with accelerometry. British Journal of
Sports Medicine 2010, 44:741-746.
5. Craig CL, Marshall AL, Sjöström M, Bauman AE, Booth ML, Ainsworth BE,
Pratt M, Ekelund U, Yngve A, Sallis JF, Oja P: International physical activity
questionnaire: 12-Country reliability and validity. Medicine and Science in
Sports and Exercise 2003, 35:1381-1395.
6. Peters TM, Moore SC, Xiang YB, Yang G, Shu XO, Ekelund U, Ji BT, Tan YT,
Liu DK, Schatzkin A, et al: Accelerometer-measured physical activity in
Chinese adults. American Journal of Preventive Medicine 2010, 38:583-591.
7. Sallis JF, Strikmiller PK, Harsha DW, Feldman HA, Ehlinger S, Stone EJ,
Williston J, Woods S: Validation of interviewer- and self-administratered
physical activity checklists for fifth grade students. Medicine and Science
in Sports and Exercise 1996, 28:840-851.
8. Hagströmer M, Trost SG, Sjöström M, Berrigan D: Levels and patterns of
objectively assessed physical activity - a comparison between Sweden
and the United States. American Journal of Epidemiology 2010,
171:1055-1064.
9. Dinger MK, Behrens TK, Han JL: Validity and reliability of the International
Physical Activity Questionnaire in college students. American Journal of
Health Education 2006, 37:337-343.
10. Lachat CK, Roosmarijn V, Le Nguyen BK, Hagströmer M, Nguyen CK,
Nguyen DAV, Nguyen QD, Kolsteren PW: Validity of two physical activity
questionnaires (IPAQ and PAQA) for Vietnamese adolescents in rural
and urban areas. International Journal of Behavioral Nutrition and Physical
Activity 2008, 5.
11. Mader U, Martin BW, Schutz Y, Marti B: Validity of four short physical
activity questionnaire in middle-aged persons. Medicine and Science in
Sports and Exercise 2006, 38:1255-1266.
12. Macfarlane DJ, Lee CC, Ho EY, Chan KL, Chan DT: Reliability and validity of
the Chinese varsion of IPAQ (short, last 7 days). Journal of Science and
Medicine in Sport 2007, 10:45-51.
13. Deng H, Macfarlane D, Thomas G, Lao XQ, Jiang CQ, Cheng KK, Lam TH:
Reliability
and validity of the IPAQ-Chinese: The Guangzhou Biobank
cohort study. Medicine and Science in Sports and Exercise 2008, 40:303-307.
14. McMurray RG, Ring KB, Treuth MS, Welk GJ, Pate RR, Schmitz KH, Pickrel JL,
Gonzalez V, Almedia MJCA, Young DR, Sallis J: Comparison of two
approaches to structured physical activity surveys for adolescents.
Medicine and Science in Sports and Exercise 2004, 36:2135-2143.
15. Norman A, Bellocco R, Vaida F, Wolk A: Total physical activity in relation
to age, body mass, health and other factors in a cohort of swedish men.
International Journal of Obesity 2002, 26:670-675.
16. Yu XN, Tam WWS, Wong PTK, Lam TH, Stewart SM: The Patient Health
Questionnaire-9 for measuring depressive symptoms among the general
population in Hong Kong. Comprehensive Psychiatry 2011, Article.
17. Reilly JJ, Penpraze V, Hislop J, Davies G, Grant S, Paton JY: Objective
measurement of physical activity and sedentary behaviour: review with
new data. Archives of Disease in Childhood 2008, 93:614-619.
Lee et al. International Journal of Behavioral Nutrition and Physical Activity 2011, 8:81
/>Page 9 of 10
18. Rothney MP, Apker GA, Song Y, Chen KY: Comparing the performance of
three generations of ActiGraph accelerometers. Journal of Applied
Physiology 2008, 105:1091-1097.
19. de Vries SI, Bakker I, Hopman-Rock R, Hirasing RA, van Mechelen W:
Clinimetric review of motion sensors in children and adolescents. Journal
of Clinical Epidemiology 2006, 59:670-680.
20. Ward DS, Evenson KR, Vaughn A, Rogers AB, Troiano RP: Accelerometer
use in physical activity: Best practices and research recommendations.
Medicine and Science in Sports and Exercise 2005, 37:S582-S588.
21. Freedson P, Melanson E, Sirard J: Calibration of the computer science and
applications, inc. accelerometer. Medicine and Science in Sports and
Exercise 1998, 30:777-781.
22. Pate RR, Pratt M, Blair SN, Haskell WL, Macera CA, Bouchard C, Buchner D,
Ettinger W, Heath GW, King AC, et al: Physical activity and public health.
Journal of the American Medical Association 1995, 273:402-407.
23. Hagströmer M, Pekka O, Sjöström M: The International Physical Activity
Questionnaire (IPAQ): A study of concurrent and construct validity. Public
Health Nutrition 2006, 9:755-762.
24. Timperio A, Salmon J, Rosenberg M, Bull FC: Do logbooks influence recall
of physical activity in validation studies? Medicine and Science in Sports
and Exercise 2004, 36:1181-1186.
25. Vartiainen E, Seppälä T, Lillsunde P, Puska P: Validation of self-reported
smoking by serum cotinine measurement in a community-based study.
Journal of Epidemiology and Community Health 2002, 56:167-170.
26. Spencer EA, Appleby PN, Davey GK, Key TJ: Validity of self-reported height
and weight in 4808 EPIC-Oxford participants. Public Health Nutrition 2002,
5:561-565.
27. Vargas CM, Burt VL, Gillum RG, Pamuk ER: Validity of self-reported
hypertension in the National Health and Nutrition Examination Survey
III, 1988-1991. Preventive Medicine 1997, 26:678-685.
28. Simpson EH: The interpretation of interaction in contingency tables.
Journal of the Royal Statistical Society (Series B) 1951, 13:238-241.
29. Sallis J, Saelens BE: Assessment of physical activity by self-report: Status,
limitations, and future directions. Research Quarterly for Exercise and Sport
2000, 71:1-14.
30. Adams SA, Matthews CE, Ebbeling CB, Moore CG, Cunningham JE, Fulton J,
Hebert JR: The effect of social desirability and social approval on self-
reports of physical activity. American Journal of Epidemiology 2005,
161:389-398.
31. Trost SG, Mciver KL, Pate RR: Conducting accelerometer-based activity
assessments in field-based research. Medicine and Science in Sports and
Exercise 2005,
37:S531-S543.
32. Report on Population Health Survey 2003/2004. [ />files/pdf/
full_report_on_population_health_survey_2003_2004_en_20051024.pdf].
33. Fu FH: The development of sport culture in the Hong Kong Chinese Hong
Kong: Faculty of Social Sciences, Hong Kong Baptist University; 1993.
34. Ishikawa-Takata K, Tabata I, Sasaki S, Rafamantananatsoa HH, Okazaki H,
Okibo H, Tanaka S, Yamamoto S, Shirota T, Uchida K, Murata M: Physical
activity level in healthy free-living Japanese estimated by doubly
labelled water method and International Physical Activity Questionnaire.
European Journal of Clinical Nutrition 2008, 62:885-891.
35. Armstrong T, Bull F: Development of the World Health Organization
Global Physical Activity Questionnaire (GPAQ). Journal of Public Health
2006, 14:66-70.
36. Abu-Omar K, Rutten A: Relation of leisure time, occupational, domestic,
and commuting physical activity to health indicators in Europe.
Preventive Medicine 2008, 47:319-323.
37. Rzewnicki R, Auweele YV, De Bourdeaudhuij I: Addressing overreporting
on the International Physical Activity Questionnaire (IPAQ) telephone
survey with a population sample. Public Health Nutrition 2003, 6:299-305.
38. van Poppel MNM, Chinapaw MJM, Mokkink LB, van Mechelen W,
Terwee CB: Physical activity questionnaires for adults: A systematic
review of measurement properties. Sports Medicine 2010, 40:565-600.
doi:10.1186/1479-5868-8-81
Cite this article as: Lee et al.: Performance of the international physical
activity questionnaire (short form) in subgroups of the Hong Kong
chinese population. International Journal of Behavioral Nutrition and
Physical Activity 2011 8:81.
Submit your next manuscript to BioMed Central
and take full advantage of:
• Convenient online submission
• Thorough peer review
• No space constraints or color figure charges
• Immediate publication on acceptance
• Inclusion in PubMed, CAS, Scopus and Google Scholar
• Research which is freely available for redistribution
Submit your manuscript at
www.biomedcentral.com/submit
Lee et al. International Journal of Behavioral Nutrition and Physical Activity 2011, 8:81
/>Page 10 of 10