Báo cáo y học: "Changes in 10-12 year old’s fruit and vegetable intake in Norway from 2001 to 2008 in relation to gender and socioeconomic status - a comparison of two cross-sectional groups" pptx
Bạn đang xem bản rút gọn của tài liệu. Xem và tải ngay bản đầy đủ của tài liệu tại đây (297.87 KB, 8 trang )
RESEARCH Open Access
Changes in 10-12 year old’s fruit and vegetable
intake in Norway from 2001 to 2008 in relation to
gender and socioeconomic status - a comparison
of two cross-sectional groups
Marit Hilsen
1,2*
, Maartje M van Stralen
3
, Knut-Inge Klepp
2
and Elling Bere
1
Abstract
Background: Norwegian children and adolescents eat less than half of the recommended 5 portions of fruit and
vegetables (FV) per day. Gender and socioeconomic disparities in FV consumption shows that boys and children of
lower socioeconomic status (SES) eat less FV than girls and high SES children. We also know that accessibility and
preferences has been identified as two important determinants of FV intake. The objectives of this study were to
compare FV intake among Norwegian 6
th
and 7
th
graders in 2001 and 2008, to explor e potential mediated effects
of accessibility and preferences on changes in FV over time, to explore whether these changes in FV intake was
moderated by gender and/or SES and whether a moderated effect in FV intake was mediated by accessibility and
preferences of FV.
Methods: The baselin e survey of the Fruits and Vegetables Make the Marks project was conducted in 2001 at 38
randomly chosen schools in two Norwegian counties. A second survey was conducted at the same schools in
2008. A total of 27 schools participated in both surveys (2001 n = 1488, 2008 n = 1339). FV intake was measured
by four food frequency questions (times/week) in a questionnaire which the pupils completed at school. SES was
based on parents’ reports of their own educational level in a separate questionnaire. The main analyses were
multilevel linear regression analyses.
Results: A significant year*parental educational level interaction was observed (p = 0.01). FV intake decreased
among pupils of parents with lower educational level (13.9 vs. 12.6 times/week in 2001 and 2008, respectively), but
increased among pupils of parents with higher education (14.8 vs. 15.0 times/week, respectively). This increasing
SES disparity in FV intake was partly mediated by an increasing SES disparity in accessibility and preferences over
time, wherein children with higher educated parents had a steeper increase in accessibility and preferences over
time than children with lower educated parents. The year*sex interaction was not significant (p = 0.54).
Conclusions: This stud y shows an increase in SES disparities in 6
th
and 7
th
graders FV intake from 2001 to 2008,
partly mediated by an increasing SES disparity in accessibility and preferences of FV.
Keywords: Fruit and vegetable intake, time trends, gender, socioeconomic status, children
Background
Research shows that a diet high in fruits and vegetables
(FV) reduces the r isk of developing several chronic dis-
eases [1] and that food habits and preferences estab-
lished during childhood and adolescents track well into
adulthood [2,3]. Childhood is therefore a crucial time
point to initiate lifelong healthy eating habits and
thereby achieve a maximum preventive effect against
diet rela ted chronic diseases. However, data shows that
less than 50% of Norwegian 8
th
graders consume the
recommended intake of FV per day. Only 11% of the 8
th
graders consumed more than 500 grams FV per day and
* Correspondence:
1
Faculty of Health and Sport, University of Agder, Norway
Full list of author information is available at the end of the article
Hilsen et al. International Journal of Behavioral Nutrition and Physical Activity 2011, 8:108
/>© 2011 Hilsen et al; licensee BioMed Central Ltd. This is an Open Access article distributed under the terms of the Creative Commons
Attribution License (http:// creativecommons.org/licenses/by/2.0), which permits unrestricted use, distribution, and reproduction in
any medium, provid ed the original work is properly cited.
the mean FV intake among 8
th
graders was 255 grams
per day [4,5].
Norway is a welfare state with a high gross domestic
product (GDP) per capita. However, social disparities,
including health behaviour and outcome, is evident i n
Norway [6]. E.g. food choices have been reported to fol-
low a socioeconomic gradient indicating that groups of
higher socioeconomic status (SES) consume healthy
food items more frequently than individuals of lower
SES [7]. These gradients have also been observed among
children and adolescents [4,8,9]. In addition to social
disparities in food choices, gender differences have also
been observed indicating that girls report to eat more
FV than boys [9].
Beyond socioeconomic and gender differences the
aetiology o f food behaviour may be further understood
by studying determinants of FV intake. Modifiable
determi nan ts such as accessibility and preferences have,
in addition to being correlated (r = 0.43 and r = 0.45,
respect ively) to FV intake [10], also been reported to be
among the strongest predictors to explain future FV
intake among schoolchildren [11]. Previous longitudinal
analysis within the Fruits and Vegetables Make the
Marks (FVMM) cohort project showed that perceived
accessibility alone explained 90% (age 12.5) and 50%
(age 15.5) of parental educational disparities [8], and
preferenc es alone explained 81 % of the gender dispari-
ties [12] observed in FV intake among adolescents.
The Norwegian government has aimed at reducing the
social disparities in health behaviour and outcome by
several initiatives [13] including nutritional guidelines
[14,15]. Due to these governmental efforts it is of great
interest to study the most recent develo pmen t in health
related trends. Data on the development of gender and
socioeconomic disparities in eating habits over the last
years is scarce and the need for such results are there-
fore called for in order to tailor effective interventions
in the future.
The objectives of this study were to compare FV
intake among Norwegian 6
th
and 7
th
graders in 2001
and 2008 , to explore potential mediated effects of acces-
sibility and preferences on changes in FV over time, to
explore whether these changes in FV intake was moder-
ated by ge nder and /or S ES and whether this moderating
effect on changes in FV intake over time was mediated
by accessibility and preferences of FV.
Methods
Design and study sample
In 2001, 48 schools from Hedmark and Telemark coun-
ties (24 schools in each county) were randomly selected
and invited to participate in the FVMM research project
(cohort I), and 19 schools from each county agreed to
participate. All 6
th
and 7
th
graders (age 10-12) in these
38 schools were invited to take part in a questionnaire
survey (which was the baseline survey for the FVMM
intervention project) [16-18]. These 38 schools were re-
contacted in 2008 and invited to once more participate
in a similar survey among 6
th
and 7
th
graders (cohort
II). At that time 27 schools agreed to participate, and all
6
th
and 7
th
graders in these 27 schools we re invited to
take part in the survey. The study sample of these two
repeated cross-sectional studies includes 6
th
and 7
th
gra-
ders from both 2001 and 2008 at these 27 schools. Both
studies were conducted in the September month. During
this period there has been some changes in FV availabil-
ity at some of the schools. A subscription program was
implemented nation-wide in 2003, and all elementary
schools are eligible to participate. This subscription pro-
gram offers subscribing pupils one fruit or vegetable per
day at schools taking part in the program. The cost of
the subscription, covered by the parents, was 2.50 NOK
per day (approximately €0.30). From autumn 2007, an
official free school fruit program (without parental pay-
ment) was implemented in all secondary elementary
schools (grades 8-10) and all combined schools (grades
1-10). Theref ore, in 2001 none of the schools included
in this study had any organized FV program, but in
2008,only5schoolshadafreeFVprogram,10schools
had a FV subscription program and 12 schools had no
FV program. These nation-wide school fruit scheme has
recently been evaluated within the FVMM project [19].
Research clearance was obtained from The Norwegian
Social Science Data Services.
Instrument
A questionnaire was completed by the pupils in the class-
room in the presence of a trained project worker. One
school-lesson (45 minutes) was used to complete the
questionnaire. The FV intake among the pupils was
assessed by the following four frequency questions; how
often do you eat 1) vegetables for dinner, 2) other vegeta-
bles (e.g., carrot for school lunch), 3) apples, oranges,
pears or bananas, 4) other fruits or ber ries. The response
categories for all four questions had 10 alternatives ran-
ging from ‘never’ =0to‘several times a day’ = 10, giving
a scale ranging from 0 to 40 times per week. In a sample
of 114 6
th
grade pupils, the test-retest correlation of this
scale was 0.75 [20]. The correlation between the scale
and a validation method (7 day food diary) was 0.32 in a
separate validation study of 85 6
th
grade pupils, a correla-
tion which is similar to what have been found in other
studies among the same age group [20].
The potential determinants, accessibility and prefer-
ences, were assessed by respectively five and four state-
ments in the questionnaire w ith response a lternatives
ranging from ‘I fully disagree’ (value = -2) to ‘I fully agree’
(value = 2). The scores of t hese questions were summed.
Hilsen et al. International Journal of Behavioral Nutrition and Physical Activity 2011, 8:108
/>Page 2 of 8
Preference had a possible range from -8 to 8 and was
assessed by the following statements: ‘Fruits and vegetables
make my meals taste better’, ‘Ireallylikerawvegetables’,
‘Fruits are among the best (foods) I know’ and ‘Fruits and
vegetables are very suitable as snacks’. Perceived accessibil-
ity at home had a possible range from -10 to 10 and was
assessed by: ‘At home we usually have fruits and vegeta-
bles in the refrigirator’, ‘At home I am allowed to eat fruits
and vegetables whenever I want’, ‘Mother or father do
sometimes cut fruits and vegetables for me as a snack’, “At
home we usually have vegetables for dinner every day” and
‘At home we usually have fruits available in a (fruit-) bowl’.
These scales have been analysed for reliability, with test-
retest correlations of 0.66 (accessi bility) and 0.74 (prefer-
ence) [21].
The pupils rep orted their own gender. After complet-
ing the questionnaire the pupils received a parent ques-
tionnaire to bring home to their parents for one of the
parents to complete. The parents educational level was
assessed individually by the parent answering the ques-
tion: “What level of educ ation do you have?”. The ques-
tion had four response a lternatives: ‘elementary school’,
‘high school’, ‘college or uni versity (3 years or less)’, and
‘co llege or university (more than 3 ye ars)’. This variable
was dichotomized (lower: having no college or university
education/higher: having attended college or university).
The majority of those who completed the parental ques-
tionnaire were mothers (81.9%).
Statistical analyses
Descriptive analyses were conducted by using one-w ay
ANOVA in SPSS 14 (Table 1 and 2). The main analyses
conducted were multilevel linear regression analyses
using MLWin (version 2.02). We defined two levels in
our multilevel analyses (1) student and (2) school. All
models included time (2001 vs. 2008), gender, parental
education and also whether the school participated in
any school f ruit program, as independent variables or
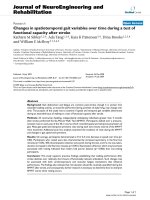
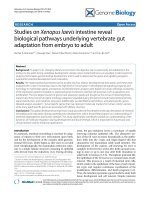
covariates. First we calculated the total effect of time on
FV intake (c-coefficient) (Figure 1). Second, the
mediated effect of accessibility and preferences of the
changes in FV intake over time were examined by using
the products of coefficient method [22]. In this method,
first the effect of time on the theoretical mediators
accessibility and preferences is calculated (a-coefficient),
followed by the calculation of the association of the the-
oretical mediators (i.e. accessibility and preferences) on
FV intake after c ontrolling for time (b-coefficient). The
mediated effect is the product of the a- and b coefficient
(a*b) and provides an estimate of the relative strength of
the mediation effect. The Sobel test was used to assess
the statistical significance of a mediating effect by divid-
ing the products-of coefficients (a*b) by its standard
error SE
ab
= √((a
2
*SE
b
2
)+(b
2
*SE
a
2
)). Third, in o rder to
examine whether the trend in FV intake wasdifferent
for different SES or gender groups (see Figure 1), we
tested the moderated effect of parental education and
gender on the changes in FV intake over time, by
including two interaction terms ((1) time* parental_edu-
cation and (2) time*gender)) into the first regression
analyses (c
mod
-coefficient). A significant interaction term
would indicate different changes in FV intake over time
for the different subgroups. Fourth, in order to investi-
gate the underlying reason for a possible interaction
Table 1 Characteristics of the study population, FV intake and determinants of FV intake in the 2001 and 2008 survey
2001 2008
n Mean (95% CI) n Mean (95% CI)
Schools 27 27
Pupils 1488 1339
Gender
Boys 748 (50.3%) 630 (47.9%)
Girls 738 (49.7%) 684 (52.1%)
Grade
6th 782 (52.6%) 686 (51.3%)
7th 706 (47.4%) 652 (48.7%)
Parents 1230 996
Parental educational level
EDU high 511 (42.2%) 527 (53.6%)
EDU low 699 (57.8%) 457 (46.4%)
Intake and determinants
FV intake 1442 14.2 (13.8 - 14.6) 1263 13.9 (13.5 - 14.2)
Accessibility 1487 4.0 (3.8 - 4.2) 1333 5.1 (4.9 - 5.3)
Preferences 1480 2.7 (2.5 - 2.9) 1320 3.1 (2.9 - 3.2)
CI, confidence interval. FV intake, fruit and vegetable intake. EDU high, higher parental education. EDU low, lower parental education
Hilsen et al. International Journal of Behavioral Nutrition and Physical Activity 2011, 8:108
/>Page 3 of 8
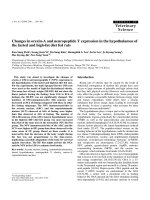
with SES or gender, a test of mediation of a moderating
effect was conducted where it is assumed that the inter-
action p redicts a mediator which predicts the outcome
[23]. In other words, we exa mined whether a possible
SESorgenderdisparityinchangesinFVintakeover
time could be explained by a SES or gender disparity in
changes in the potential mediators over time (see Figure
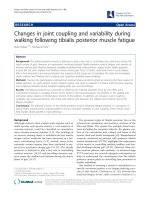
2 and 3). First we calculated the effect of the interaction
terms (i.e. time*education_parents and time*gender) on
the theoretical mediators (i.e. accessibility and prefer-
ences) (a
mod
-coeffient). Second, we calculated the effect
of the theoretical mediators on FV intake when adjusted
for the interaction terms between the moderator and
independent variable (i. e. time*education_parents and
time*gender) and the interaction terms between the
moderator a nd the mediator variable (i.e. accesibility*-
parental_educatio n and accessibility*gender or preferen-
ce*parental_education and preference*gender) (b
mod
-
coefficient). The mediation of a moderation effect can
be estimated by the product-of-coefficient test (a
mod
*b-
mod
) and its significance can be estimated by dividing it
by its standard error (SEa
mod
b
mod
= √((a
mod
2
*SEb
mod
2
)
+(b
mod
2
*SEa
mod
2
)). An examination of the residuals did
not reveal unacceptable departures from normality.
Since interaction terms have less power, p values, as an
indicator of the significance, of interaction terms are
recommended to be set at 0.10 [24]. All analyses in the
current paper have been adjusted fo r whether th e pupils
were in schools participating in the fruit program or
not. Attrition analys is were condu cted, comparing the
pupils at the 27 schools included in the study sample
with the pupils at the 11 schools participating in 2001
but not in 2008, regarding gender, parental education,
FV intake, accessibility and preferences. For the analysis
t-tests were used for continous variables and c
2
statistics
were used (categorical data ). No significant differences
between the study sample and pupils at schools that did
not participate in 2008 were found.
Results
A total of 1488 pupils (out of 1727 eligible; 86%) in
2001 and 1339 pupils (out of 1712 eligible; 78%) in 2008
completed the questionnaire and brought home a parent
questionnaire t o be completed by one of their parents.
For respectively 1230 and 996 pupils, one of their par-
ents completed the parent questionnaire. Descriptions of
the samples in 2001 and 2008 are presented in Table 1.
Changes in FV intake, accessibility and preferences over
time
Table 1 shows the changes in FV intake, acce sibility and
preferences of FV over time. A decrease in FV intake
from 14.2 to 13.9 times/w eek among 6
th
and 7
th
graders
Table 2 Comparisons of the 2001 and 2008 cohorts on the four separate FFQ items
Question n Mean Standard Deviation p-value*
How often do you eat vegetables for dinner?
2001 1476 3.8 2.2
2008 1321 3.9 2.1 0.439
How often do you eat other vegetables?
2001 1462 2.8 2.5
2008 1292 2.5 2.3 0.003
How often do you eat apples, oranges, pears or bananas?
2001 1470 4.6 2.7
2008 1317 4.9 2.5 0.009
How often do you eat other fruits and berries?
2001 1466 3.0 2.5
2008 1294 2.7 2.2 < 0.001
* One-Way ANOVA
Independent variable:
Time
Potential mediators:
Accessibility
Preferences
Potential moderators:
Parental education
Gender
c
a
b
c
mod
Outcome variable:
Fruit and vegetable
intake
Figure 1 Model of mediation and moderation of changes in FV
intake over time.
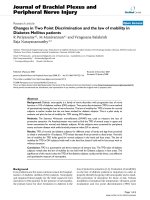
Time
Parental education
Time* parental
education
Accessibility
Fruit and vegetable
intake
c
mod
=1.36, SE= 0.57
c’
mod
= 0.72, SE= 0.53
a= 0.55,
SE= 0.
2
9
b= 0.84,
SE= 0.08
Figure 2 Model of mediation of accessibility on moderated
effect of SES on changes in FV intake.
Hilsen et al. International Journal of Behavioral Nutrition and Physical Activity 2011, 8:108
/>Page 4 of 8
at the 27 schools was observed from 2001 to 200 8 (c =
-0.55,SE=0.29,p=0.06).Atthesametimemean
scores in both accessibility and preferences significantly
increased from 4.0 to 5.1 (a = 1.08, SE = 0.15, p <
0.001) and from 2.7 to 3.1 (a = 0.31, SE = 0.15, p <
0.05), respectively. Analyzing the four items in the FV
scale separately, the consu mpti on of ‘vegetables for din-
ner’ (3.8 vs. 3.9 times/week, p = 0.44) and ‘apples,
oranges, pears and banana s’ (4.6 vs. 4.9, p = 0.009)
increased, while the intake of ‘other vegetables’ (2.8 vs.
2.5, p = 0.003) and ‘other fruits and berries’ (3.0 vs. 2.7,
p < 0.001) decreased from 2001 to 2008 (Table 2).
Mediated effect of accessibility and preferences on
changes in FV intake over time
Mediation analyses showed that both changes in
accessibility (ab = 0.89, SE = 0.13, p < 0.001) and
changes in preferences (ab = 0.25, SE = 0.12, p < 0.05)
suppressed the changes in FV intake over time (Table
3). Suppressor effects, also called inconsistent
mediated effects, are mediated effects with a different
sign than the direct effect in a model. This inconsis-
tent mediator suppresses the total effect. In other
words,thedecreaseinFVintakeovertimewould
have been higher if the accessibility and preference of
FV had not increased.
Moderated effect of parental education and gender on
changes in FV intake over time
During this time period the proportion of parents with
higher education increased from 42.2% to 53.6% (Table
1). The multilevel linear regression analysis on FV intake
showed a significant interaction between parental educa-
tion level and time (c
mod
= 1.36, SE = 0.57, p = 0.01)
(Figure 2 and 3). Subgroup analyses showed that FV
intake decreased among pupils of parents with a low
educationfrom13.9times/weekin2001to12.6times/
week in 2008 (c = -2.72, SE = 0.73 , p < 0.001), and
slightly increased among pupils of parents with higher
educationfrom14.8times/weekin2001to15.0times/
week in 2008 (c = 1.08, SE = 0.77, p = 0.16). These
results indicate that SES disparity of FV intake increased
over time in which lower SES children had a higher
decrease in FV intake over time compare to a more
stable intake among higher SES children . No significant
interaction between time and gender was found (c
mod
=
0.31, SE = 0.57, p = 0.59).
Mediation of a moderated effect of parental education
and gender on changes in FV intake
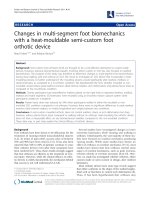
Parental education moderated the ch anges in accessibil-
ity (a
mod
= 0.55, SE = 0.29, p = 0.06) (Figure 2) and pre-
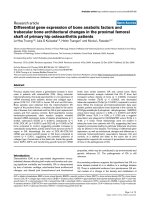
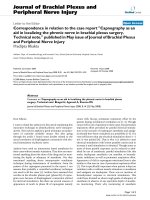
ferences (a
mod
= 0.46, SE = 0.29, p = 0.11) (Figure 3)
over time (Table 4). Subgroup analyses showed that
children with high educated parents had a steeper
increase in accessibility (a
mod
= 1.17, SE = 0.38, p <
0.00) and preferences (a
mod
= 0.1 4, SE = 0.38, p = 0.70)
than children with low educated parents (a
mod
= 0.82,
SE = 0.40, p < 0.05; a
mod
= 0.05, SE = 0.39, p = 0.90).
These results indicate that SES disparity in FV accessi-
bility and preferences increased over time in which
higher SES children had a higher increase in accessibility
and preferences than lower SES children. Both accessi-
bility (b
mod
= 0.84, SE = 0.08, p < 0.001) and preferences
(b
mod
= 0.89, SE = 0.08, p < 0.001) were significantly
independent associated with FV intake when adjusted
for the independent variables and interaction term
between time and parental education. A mediating effect
of accessibility (ab
mod
= 0.46, SE
mod
= 0.24, p = 0.05)
and p references (ab
mod
= 0.41, SE
mod
= 0.26, p = 0.11)
on the moderating effect of SES on FV intake was found
(Table 4). This indicates that the increasing SES dispar-
ity in changes in FV intake over time could partly be
explained by an increasing SES disparity in accessibility
and pre ferences of FV over time. No significant media-
tion of accessibility (ab
mod
= 0.05, SE = 0.25, p = 0.84)
and preferences (ab
mod
= 0.22, SE = 0.26, p = 0.39) was
found on the moderating effect of gen der on changes in
FV intake over time.
Time
Parental education
Time* parental
education
Preferences
Fruit and vegetable
intake
c
mod
=1.36, SE= 0.57
c’
mod
= 0.78,
SE= 0.52
a= 0.46,
SE= 0.
2
9
b= 0.89,
SE= 0.08
Figure 3 Model of mediation of preferences on moderated
effect of SES on changes in FV intake.
Table 3 Trend in FV intake and the mediated effect of preferences and accessibility on this trend
c (SE) c’ (SE) a(SE) b (SE) ab (SE)
FV intake -0.55 (0.29)‡
Accessibility 1.42 (0.26)*** 1.08 (0.15)*** 0.82 (0.04)*** 0.89 (0.13)***
Preferences 0.83 (0.26)** 0.31 (0.15)* 0.83 (0.04)*** 0.25 (0.12)*
c = total change in FV intake over time; c’ = change in FV intake over time when adjusted for changes in the mediator; a = change in mediator over time; b =
association between mediator and FV intake when adjusted for changes over time; ab = mediated effect using the product of coefficient test. SE, standard error.
All analyses are adjusted for clustering effects and time, gender, parental education and treatment condition. ‡ p < 0.10; * p < 0.05; **p < 0.01; ***p < 0.001
Hilsen et al. International Journal of Behavioral Nutrition and Physical Activity 2011, 8:108
/>Page 5 of 8
Discussion
The present study shows an increase in SES disparity in
FV intake among 10-12 year olds from 2001 to 2008,
wherein low SES children h ad a steeper decline in FV
intake than high SES children. This increase in SES dis-
parity was partly mediated by a n increasing S ES dispar-
ity in a ccessibility and preferences, wherein high SES
children had a steeper increase in accessibility and pre-
ferences than low SES children. Moreover, increases in
accessibility and pref erences over time were found to
suppress the decrease in FV intake over time. This in di-
cates that the decrease in FV intake would have been
higher if accessibility and preferences had not increased
over time. This points out that accessibility and prefer-
ences are relevant determinants of FV intake which con-
firms the findings of previous research [11]. The gender
disparity regardin g FV intake did not change from 2001
to 2008.
Studies on how the socioeconomic disparities in eating
behaviors have developed over time are limited. Previous
observational studies on dietary behavior reveal that
healthy eating h abits decreases as the adolescents get
older, and that the SES disparities increased [2]. In a
recent review, adolescents’ of lower SES had poo rer
diets compared to adolescents of higher SES in 14 out
of 16 studies [25]. The authors concluded that the
observed associations between SES and eating habits
among adolescents seemed less robust than the associa-
tion between SES and eating habits among adults.
Within the FVMM study previous longitudinal analysis
has shown an increased socioeconomic disparity in FV
intake among adolescents as they aged from 12.5 (year
2002) to 15.5 years (year 2005). The difference in the
socioeconomic disparities in FV intake among these
adolescents increased from 1.3 times/week in 2002 (age
12.5, p = 0.03) to 2.4 times/week in 2005 (age 15.5, p <
0.001) [8]. The present study shows that the SES dispa-
rities in FV intake within the same age group (10-12
year olds) i ncreased from 0.9 in 2001 to 2.4 times/week
in 2008 (d ata not shown). A study on similar trends in
SES differences in FV intake among Dutch schoolchil-
dren recently reported that girls of mothers with lower
educational level reported lower fruit intake in 2009
compared to 2003 (unpublished work by Fischer C,
Brug J, Tak N and Te Velde S). This shows that there
probably is a trend in the society tow ards greater SES
disparities with regard to FV intake in two highly devel-
oped countries, Norway and the Netherlands. This trend
might also explain at least parts of the age-trend
reported above. Whether it is t he increasing age or
development in t ime which contributes most to these
increased socioeconomic disparities needs further
investigation.
Bere and colleagues [8] have previously reported that
SES disparities regarding perceived accessibility and pre-
ferences for FV explains most of the SES d ifferences
observed in FV intake. The present study adds to this
by showing that changes in accessibility and preferences
also mediate parts of the increasing SES disparit ies
regarding changes in FV intake within the same age
group from 2001 to 2008, wherein high SES children
had a higher increase in accessibility and preferences
than low SES children.
This increasing disparities regarding SES differences in
adolescents FV intake, accessibility a nd preferences of
FV is the opposite trend of what the Norwegian govern-
ment has been aiming for [14]. One effort of the Norwe-
gian government in trying to reduce social dispari ties in
health is a free school fruit scheme implemented at all
secondary schools (grades 8-10) and all combined
schools (1-10) from fall 2007. It is now legally estab-
lished that all pupils in secondary schools receive a free
fruit at school every school day [26]. This nation-wide
free school fruit scheme has recently been evaluated
within the FVMM project [19], using the same data set
as the present study. A greater increase in fruit intake
within the schools participating in the program (i.e.
schools with grades 1-10, 5 out of the 27 schools) com-
pared to the other schools was observed. In addition, it
was indicated that the free fruit scheme was effective in
increasing fruit intake in all groups at these schools
(including boys and pupils of lower SES) as th e interac-
tions between intervention effect and gender and SES
were not significant. However, this effect was probably
Table 4 Mediated effect of accessibility and preferences on moderated effect of SES on FV intake trend
c
mod
(SE) c’
mod
(SE) a
mod
(SE) b
mod
(SE) ab
mod
(SE)
FV intake 1.36 (0.57)
Accessibility 0.72 (0.53) 0.55 (0.29) ‡ 0.84 (0.08)*** 0.46 (0.24)‡
Preferences 0.78 (0.52) 0.46 (0.29) 0.89 (0.08)*** 0.41 (0.26)
the interaction term (time*parental education) is the independent variable.
c
mod
= effect of parental education on the changes in FV intake over time; c’
mod
= effect of parental education on the changes in FV intake over time adjusted
for changes in the mediator; a
mod
= effect of parental education on the changes in the mediators over time; b
mod
= association between mediators and FV
intake when adjus ted for the moderator; ab
mod
= medi ated effect of mediators on the effect of parental education on the change in FV intake over time. SE,
standard error. All analyses are adjusted for clustering effects and time, gender, parental education and treatment condition. ‡ p < 0.10; *p < 0.05; **p < 0.01;
***p < 0.001
Hilsen et al. International Journal of Behavioral Nutrition and Physical Activity 2011, 8:108
/>Page 6 of 8
not sufficient in order to limit the increasing socioeco-
nomic disparities in the pupils’ frequen cy of FV con-
sumption, as presented in the present paper, during the
same period. This might be because only a limited num-
ber of schools (5 out of 27) received free fruit. The
results of Bere et al. [19] also showed that in schools
not participating in any FV program the percentage of
pupils eating FV at school 4-5 days per week increased
by 12 percentage points among the pupils of high SES
whereas there were no changes in the low SES group
from 2001 to 2008, adding support to our findings in
the present study.
The contradicting results on the time trend in FV
intakefoundinthecurrentstudy,comparedtoBereet
al. [19] may be explained by the methods used to
assess FV intake. In the study referred to above, a 24-h
recall was used to assess FV intake in order to assess
the effect of the school fruit programs, while the cur-
rent study used FFQ’stoassessFVintaketobeableto
relate FV intake to accessibility a nd preferences. In the
current study however, we observed an increase in
intake of apples, oranges, pears and bananas from 2001
to 2008 (Table 2). This may reflect an increased intak e
of fruits at school, as the school fruit scheme mostly
serves these kinds of fruits. The decline reported in
consumption of other vegetables and other fruits and
berries assessed by the FFQ’s(Table2)mightbedue
to these questions being somehow vague. However,
during the last decade there has been considerable
publicity by the No rwegiangovernmentonpromoting
FV intake, also among children and adolescents. This
might have contributed that the pupils of 2008 were
more aware and able to report their FV intake com-
pared to the 2001 pupils. A hypothesis might be that
pupils of 2008 report to eat more FV on tho se occa-
sions where they know they are served FV (school and
dinner) and being less likely to over report on vague
items such as ‘other vegetables/fruits’.
A strength of the present study is that it includes
pupils at two time points (2001 and 2008) from the
same 27 randomly selected schools. There are some lim-
itations to this study. First, the schools included were
from only 2 out of 19 Norwegian counties. However,
since the attrition analy sis showed no s ignificant differ-
ences between study sample and the 11 schools not par-
ticipating in 2008 and since Norway is a rather
homogenous country the results from this study can
probably be generalized to all Norwegian counties. Sec-
ond, the 2008 sample had a higher proportion of high
SES pupils compared to the 2001 sample (i.e. in 2008
more of the parents reported a higher education level).
A higher proportio n of high SES pupils in the study
sample for 2008 probably reflect the increasing educa-
tional level in the population [27]. However, it may also
be that the proportionally l ess pupils in 2008 compared
to 2001 had parental reported SES data and that
research suggests that parents of high SES groups are
more likely to respond to research requests. Thi rd, most
of the parents who filled out the questionnaires, and
who’s educational level was used to assess SES, were
mothers (81.9%). This might not reflect the all over
family SES completely.
Our findings i ndicate the need for further research
and enhanced efforts to reduce the socioeconomic dis-
parities in adolescent FV intake. A next question would
be to ask: How can we improve the accessibility at
home and preferences among children and adolescents
of low SES groups? There is clearly a need for interven-
tion studies on increasing the children and a dolescents
accessibility and preferences, especially among those of
the lower SES groups.
Conclusions
The results show an increase in social disparities f rom
2001 to 2008 in FV intake, accessibility and prefe rences
of FV among adolescents aged 10-12 years. Accessibilit y
and preferences mediated parts of the increase in SES
disparity in FV intake.
Funding
The project was funded by the Norwegian Research
Council (Grant number 185817/V50). The contribution
of MMS was funded by Netherlands Organization for
Health Research and Development (Grant number
121520002).
Abbreviations
FV: fruits and vegetables; GDP: gross domestic product; SES: socioeconomic
status; FVMM: Fruits and Vegetables Make the Marks; ANOVA: Analysis of
variance between groups; SPSS: Statistical Package for the Social Sciences;
SE: standard error; CI: confidence interval.
Author details
1
Faculty of Health and Sport, University of Agder, Norway.
2
Department of
Nutrition, Faculty of Medicine, University of Oslo, Norway.
3
Department of
Public and Occupational Health, the EMGO Institute for Health and Care
Research, VU Universi ty Medical Center, the Netherlands.
Authors’ contributions
KIK conceived the study in 2001. EB conceived the study in 2008. EB and
MH designed the current study. MH and MMS analyzed the data and all
authors contributed to interpretation. MH drafted the manuscript and MMS,
EB and KIK critically revised it. All authors approved of the final manuscript.
Competing interests
The authors declare that they have no competing interests.
Received: 26 January 2011 Accepted: 3 October 2011
Published: 3 October 2011
References
1. World Health Organization: Diet, Nutrition and the Prevention of Chronic
Diseases. Joint WHO/FAO Expert Consultation. Geneva: WHO; 2003, WHO
Technical Report Series no. 916.
Hilsen et al. International Journal of Behavioral Nutrition and Physical Activity 2011, 8:108
/>Page 7 of 8
2. Lien N, Lytle LA, Klepp KI: Stability in consumption of fruit, vegetables,
and sugary foods in a cohort from age 14 to age 21. Prev Med 2001,
33:217-226.
3. Kelder SH, Perry CL, Klepp KI, Lytle LL: Longitudinal tracking of adolescent
smoking, physical activity, and food choice behaviors. Am J Public Health
1994, 84:1121-1126.
4. Andersen LF, Overby N, Lillegaard IT: Intake of fruit and vegetables
among Norwegian children and adolescents. Tidsskr Nor Laegeforen 2004,
124:1396-1398.
5. Yngve A, Wolf A, Poortvliet E, Elmadfa I, Brug J, Ehrenblad B, et al: Fruit and
vegetable intake in a sample of 11-year-old children in 9 European
countries: The Pro Children Cross-sectional Survey. Ann Nutr Metab 2005,
49:236-245.
6. Sosial- og helsedirektoratet: Sosial- og helsedirektoratets handlingsplan
mot sosiale ulikheter i helse: Gradientutfordringen. Oslo; 2005.
7. Holmboe-Ottesen G, Wandel M, Mosdol A: Social inequality and diet.
Tidsskr Nor Laegeforen 2004, 124:1526-1528.
8. Bere E, van LF, Klepp KI, Brug J: Why do parents’ education level and
income affect the amount of fruits and vegetables adolescents eat? Eur
J Public Health 2008, 18:611-615.
9. Rasmussen M, Krolner R, Klepp KI, Lytle L, Brug J, Bere E, et al:
Determinants of fruit and vegetable consumption among children and
adolescents: a review of the literature. Part I: Quantitative studies. Int J
Behav Nutr Phys Act 2006, 3 :22.
10. Bere E, Klepp KI: Correlates of fruit and vegetable intake among
Norwegian schoolchildren: parental and self-reports. Public Health Nutr
2004, 7:991-998.
11. Bere E, Klepp KI: Changes in accessibility and preferences predict
children’s future fruit and vegetable intake. Int J Behav Nutr Phys Act
2005, 2:15.
12. Bere E, Brug J, Klepp KI: Why do boys eat less fruit and vegetables than
girls? Public Health Nutr 2008, 11:321-325.
13. Helse- og omsorgsdepartementet. St.meld. nr.20 (2006-2007): Nasjonal
strategi for å utjevne sosiale helseforskjeller. Oslo: Helse- og
omsorgsdepartementet; 2007.
14. Helse- og omsorgsdepartementet: Handlingsplan for et bedre kosthold i
befolkningen (2007-2011): Oppskrift for et sunnere kosthold. Oslo: Helse-
og omsorgsdepartementet; 2007.
15. Nasjonalt råd for ernæring: Et sunt kosthold for god helse: Strategisk plan
med forslag til tiltak for perioden 2005-2009 skrevet på oppdrag fra
Sosial- og helsedirektoratet. Oslo: Sosial- og helsedirektoratet; 2005.
16. Bere E, Veierod MB, Klepp KI: The Norwegian School Fruit Programme:
evaluating paid vs. no-cost subscriptions. Prev Med
2005, 41:463-470.
17. Bere E, Veierod MB, Bjelland M, Klepp KI: Free school fruit–sustained effect
1 year later. Health Educ Res 2006, 21:268-275.
18. Bere E, Veierod MB, Bjelland M, Klepp KI: Outcome and process evaluation
of a Norwegian school-randomized fruit and vegetable intervention:
Fruits and Vegetables Make the Marks (FVMM). Health Educ Res 2006,
21:258-267.
19. Bere E, Hilsen M, Klepp KI: Effect of the nationwide free school fruit
scheme in Norway. Br J Nutr 2010, 1-6.
20. Andersen LF, Bere E, Kolbjornsen N, Klepp KI: Validity and reproducibility
of self-reported intake of fruit and vegetable among 6th graders. Eur J
Clin Nutr 2004, 58:771-777.
21. Bere E, Klepp KI: Reliability of parental and self-reported determinants of
fruit and vegetable intake among 6th graders. Public Health Nutr 2004,
7:353-356.
22. MacKinnon DP: Introduction to Statistical Mediation Analysis New York:
Erlbaum; 2008.
23. Fairchild AJ, MacKinnon DP: A general model for testing mediation and
moderation effects. Prev Sci 2009, 10:87-99.
24. Twisk J: Applied Multilevel Analysis Cambridge University Press; 2006.
25. Hanson MD, Chen E: Socioeconomic status and health behaviors in
adolescence: a review of the literature. J Behav Med 2007, 30:263-285.
26. Det kongelige kunnskapsdepartement: Ot.prp. nr. 40 (2007-2008): Om lov
om endringar i opplæringslova og privatskolelova. Oslo: Det kongelige
kunnskapsdepartement; 2008.
27. Statistisk sentralbyrå: Fakta om utdanning 2010 - nøkkeltall fra 2008. Oslo;
2009.
doi:10.1186/1479-5868-8-108
Cite this article as: Hilsen et al.: Changes in 10-12 year old’s fruit and
vegetable intake in Norway from 2001 to 2008 in relation to gender
and socioeconomic status - a comparison of two cross-sectional groups.
International Journal of Behavioral Nutrition and Physical Activity 2011 8:108 .
Submit your next manuscript to BioMed Central
and take full advantage of:
• Convenient online submission
• Thorough peer review
• No space constraints or color figure charges
• Immediate publication on acceptance
• Inclusion in PubMed, CAS, Scopus and Google Scholar
• Research which is freely available for redistribution
Submit your manuscript at
www.biomedcentral.com/submit
Hilsen et al. International Journal of Behavioral Nutrition and Physical Activity 2011, 8:108
/>Page 8 of 8