Báo cáo y học: " Inhibition of casein kinase 1-epsilon induces cancer-cell-selective, PERIOD2-dependent growth arrest" pptx
Bạn đang xem bản rút gọn của tài liệu. Xem và tải ngay bản đầy đủ của tài liệu tại đây (1.37 MB, 13 trang )
Genome Biology 2008, 9:R92
Open Access
2008Yang and StockwellVolume 9, Issue 6, Article R92
Research
Inhibition of casein kinase 1-epsilon induces cancer-cell-selective,
PERIOD2-dependent growth arrest
Wan Seok Yang
*
and Brent R Stockwell
*†
Addresses:
*
Department of Biological Sciences, Columbia University, Fairchild Center, Amsterdam Avenue, New York, NY 10027, USA.
†
Department of Chemistry, Columbia University, New York, NY 10027, USA.
Correspondence: Brent R Stockwell. Email:
© 2008 Yang and Stockwell; licensee BioMed Central Ltd.
This is an open access article distributed under the terms of the Creative Commons Attribution License ( which
permits unrestricted use, distribution, and reproduction in any medium, provided the original work is properly cited.
Cancer-cell-selective drug development<p>Casein kinase 1 epsilon is identified as a potential target for developing selective anticancer reagents.</p>
Abstract
Background: Kinases are under extensive investigation as targets for drug development.
Discovering novel kinases whose inhibition induces cancer-cell-selective lethality would be of value.
Recent advances in RNA interference have enabled the realization of this goal.
Results: We screened 5,760 short hairpin RNA clones targeting the human kinome to detect
human kinases on which cancer cells are more dependent than normal cells. We employed a two-
step screening strategy using human sarcoma cell lines and human fibroblast-derived isogenic cell
lines, and found that short hairpin RNAs targeting CSNK1E, a clock gene that regulates circadian
rhythms, can induce selective growth inhibition in engineered tumor cells. Analysis of gene-
expression data revealed that CSNK1E is overexpressed in several cancer tissue samples examined
compared to non-tumorigenic normal tissue, suggesting a positive role of CSNK1E in neogenesis or
maintenance. Treatment with IC261, a kinase domain inhibitor of casein kinase 1-epsilon (CK1ε),
a protein product of CSNK1E, showed a similar degree of cancer-cell-selective growth inhibition.
In a search for substrates of CK1ε that mediate IC261-induced growth inhibition, we discovered
that knocking down PER2, another clock gene involved in circadian rhythm control, rescues IC261-
induced growth inhibition.
Conclusion: We identified CK1ε as a potential target for developing anticancer reagents with a
high therapeutic index. These data support the hypothesis that circadian clock genes can control
the cell cycle and cell survival signaling, and emphasize a central role of CK1ε and PERIOD2 in
linking these systems.
Background
Cancer can be effectively treated using targeted therapy, as
exemplified by Imatinib [1] or Sorafenib [2]. There are
increasing efforts to fulfill the promise of targeted therapy,
using antibodies, peptides and small molecules that selec-
tively affect cancer cells. In each case, the key is to identify
target molecules that play a unique role in tumor cells.
Genes encoding such target molecules can be discovered by
either comparative or functional genomic approaches. Com-
parative approaches analyze cytogenetic data, genomic
Published: 2 June 2008
Genome Biology 2008, 9:R92 (doi:10.1186/gb-2008-9-6-r92)
Received: 23 April 2008
Accepted: 2 June 2008
The electronic version of this article is the complete one and can be
found online at />Genome Biology 2008, 9:R92
Genome Biology 2008, Volume 9, Issue 6, Article R92 Yang and Stockwell R92.2
sequences, mRNA expression profiles or proteomic profiles,
and select target genes or proteins based on differential
expression or mutation status. For example, high-throughput
sequencing of cancer cell genomes identified BRAF [3] and
PIK3CA [4] as frequently mutated genes in multiple human
tumors. On the other hand, functional approaches involve
perturbing cells with agents, such as cDNAs, small RNAs, or
small molecules, and searching for those that induce specific
phenotype changes. Subsequent target identification may
lead to the discovery of cancer therapeutic targets. Indeed,
the RAS oncogenes were identified using an expression clon-
ing strategy that searched for human genes that transform the
mouse fibroblast cell line NIH3T3 [5].
Among the agents used for functional genomic approaches,
small RNAs are increasingly appealing, because RNA-inter-
ference (RNAi) mediated by small RNAs enables gene silenc-
ing in mammalian cells. RNAi is a naturally occurring
phenomenon involved in the silencing of genes, which results
in regulation of gene expression or activation of an antiviral
defense system [6]. The RNAi pathway involves DICER,
which processes double-stranded RNAs into small RNA
duplexes (approximately 22 nucleotides). One strand of the
small RNA duplex is incorporated into an effector complex
known as the RNA-induced silencing complex (RISC) and
acts as a guide molecule in translational repression or mRNA
cleavage, depending on the degree of base-pair match with
the target mRNA [7].
The conserved RNAi pathway is also activated by experimen-
tally designed double-stranded RNAs or short hairpin RNAs
(shRNAs), which make it possible to knock down genes of
interest in mammalian cells. Consequently, RNAi libraries
targeting large numbers of mRNAs have been generated and
used for conducting high-throughput, loss-of-function
screens in tissue culture systems. For example, RNAi libraries
were used to identify novel tumor suppressors [8,9], regula-
tors of cell death and survival [10], and novel components of
p53 signaling [11]. Moreover, RNAi libraries were used for
understanding the mechanisms of action of novel compounds
[12], for characterizing determinants of sensitivity to clini-
cally used drugs [13], and for identifying novel targets for
anti-cancer therapy, using a pair of isogenic cell lines [14].
Isogenic cell lines are useful for discovering therapeutic
agents and probing the biology of transformation. They may
consist of cancer cells at different stages of malignancy, or a
specific cancer gene can be deleted to create an isogenic cell
line counterpart. Another approach is to isolate primary cells
and induce transformation by sequential addition of onco-
genic elements. This system provides a series of genetically
defined cell lines, and thereby allows for identification of
tumor-cell-selective, or even genotype-selective, lethal
agents. The successful use of such a system has been
described for identification of small molecules with poten-
tially high therapeutic indices [15].
Here we utilized an RNAi library consisting of shRNAs target-
ing human kinases to find kinases whose inactivation induces
tumor-cell-selective lethality or growth arrest. The initial
screening was conducted in two sarcoma cell lines; then, a
series of isogenic cell lines derived from primary fibroblasts
were used for selecting tumor-cell-specific cytotoxic shRNAs.
We report that knocking down CSNK1E, a clock gene encod-
ing casein kinase 1-epsilon (CK1ε), induces tumor-cell-selec-
tive cytotoxicity. Subsequent validation experiments showed
that tumor cells depend more on the kinase activity of CK1ε
than normal cells do. The use of a kinase inhibitor specific to
CK1ε revealed that another clock protein, PERIOD2, is a key
substrate of CK1ε and modulates tumor cell growth.
Results and discussion
Our RNAi library was made of lentivirus solutions in 384-well
plates. Each well contains lentiviruses harboring expression
plasmids encoding a single shRNA that is designed to target a
single mRNA. The arrayed library targets 1,006 human genes,
including 571 kinases; most of them are protein kinases, while
other kinases acting on nucleic acids, lipids, and carbohy-
drates are included (Figure 1a).
We began the screen with two different sarcoma cell lines,
with the goal of pre-selecting shRNAs that are lethal to these
tumor-derived cell lines. We infected U-2-OS, osteosarcoma-
derived cells, and HT1080, fibrosarcoma-derived cells, in
triplicate and incubated them for three days. This allows time
for the shRNAs to be expressed, to bind to their target
mRNAs, and cause a reduction in expression of the encoded
protein, as the protein is turned over. Percent growth inhibi-
tion was determined by adding alamar blue to the culture,
and by measuring fluorescence.
A number of shRNA clones displayed growth inhibitory
effects (Figure 1b,c and Additional data file 1). Statistical anal-
ysis of primary screening data revealed 195 genes whose
knockdown inhibited growth of either cell lines more than
25% (P < 0.01; Figure 1b and Additional data file 1). Fifty-two
genes affected cell growth in both cell lines, while other genes
had specific effects on each cell line, which may reflect the dif-
ferent tissue origin of these two sarcomas. Some of the hit
genes in common between the two cell lines are well-known
regulators of the cell cycle or cell survival, but there were nine
genes whose functions have not been described (Additional
data file 1). We were most interested in genes whose functions
are most critical to the survival of these two cancer cell lines.
Accordingly, we calculated the sum of the percent growth
inhibition in each cell line and selected seven shRNAs whose
summed values were >90% (Figure 1c). Six out of these seven
genes were among the 52 common hits in Figure 1b. One
gene, PPM1E, was not statistically significant and, as
expected, shRNAs targeting PPM1E were not active in our fol-
low-up analysis (data not shown).
Genome Biology 2008, Volume 9, Issue 6, Article R92 Yang and Stockwell R92.3
Genome Biology 2008, 9:R92
Reducing expression of these six target genes causes growth
arrest or cell death in two different sarcoma-derived cancer
cell lines; however, we were concerned that knockdown of
these six genes may affect normal cells to the same degree. To
identify shRNA clones that have cancer cell selectivity, we
created fresh batches of lentivirus harboring the six shRNA
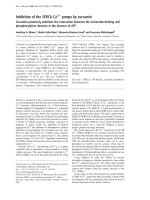
Lentiviral RNAi library screen of human kinases identifies regulators of cancer cell growthFigure 1
Lentiviral RNAi library screen of human kinases identifies regulators of cancer cell growth. (a) Target genes covered by the shRNA library were classified
according to gene function using Gene Ontology groups [33]. (b) Two human sarcoma cell lines, HT1080 and U-2-OS cells, were infected with lentiviruses
containing shRNAs targeting human kinases in 384-well format. Genes whose knockdown inhibits growth of either cell line by more than 25% compared
to control with statistical significance (P < 0.01) were considered as hits. This diagram shows the number of hits specific to each cell line and common to
both cell lines. (c) Median value of percent growth inhibition (%GI) from triplicate results in each cell line. The top seven hits were selected based on the
summed value of %GI in both cell lines.
-30
-20
-10
0
10
20
30
40
50
60
70
-20 0 20 40 60 80
HT1080 U2OS
PRKD2 63.25 51.89 115.14
CAMK2G 54.05 55.62 109.67
CSNK1E 47.08 60.10 107.18
IKBKE 53.73 43.24 96.97
PPM1E 42.10 50.10 92.20
PIK3AP1 50.61 40.58 91.18
CHEK1 45.29 45.69 90.98
Median value of % G.I. in
SumSymbol
% G.I. in HT1080
% G.I. in U2OS
Top 7 hits
HT1080 U2OS
42
101
52
Kinase
genes
(571)
Other
genes
(435)
Total genes
(1,006)
449
29
24
19
9
11
16
14
Protein kinases
Lipid kinases
Carbohydrate kinases
Inositol/phosphoinositol kinases
Metabolic kinases
Nutrient kinases
Miscellaneous
>25% G.I. (mean)
P < 0.01
(a)
(b)
(c)
Nucleobase/side/tide kinases
Genome Biology 2008, 9:R92
Genome Biology 2008, Volume 9, Issue 6, Article R92 Yang and Stockwell R92.4
clones and retested them in a pair of nearly isogenic cell lines,
BJ-TERT and BJ-TERT/LT/ST/RAS
V12
. Both cell lines were
derived from primary human BJ foreskin fibroblasts [16].
These BJ primary cells were engineered successively to
express the catalytic subunit of human telomerase (hTERT),
the SV40 large T and small T oncoproteins (LT and ST), and
an oncogenic allele of HRAS (HRAS
G12V
). We refer to these
cells lines as BJ-TERT, BJ-TERT/LT/ST, and BJ-TERT/LT/
ST/RAS
V12
. Only the BJ-TERT/LT/ST/RAS
V12
cells form
tumors in nude mice. Therefore, testing of shRNAs in BJ-
TERT and BJ-TERT/LT/ST/RAS
V12
should enable one to
identify genes with a function that is essential in tumor cells,
but not normal cells. We measured trypan blue exclusion to
evaluate the cytotoxic or growth inhibitory effect of these
shRNA clones on normal cells and their isogenic engineered
tumor cell counterparts.
Out of these six shRNA clones, five did not show differential
activity in the two cell lines; however, the shRNA targeting
CSNK1E (hereafter, shCSNK1E) had a tumorigenic-cell-line-
specific activity (Figure 2a). The activity of shCSNK1E was
further tested in four different BJ-derived cell lines, namely,
BJ-TERT, BJ-TERT/LT/ST, BJ-TERT/LT/ST/RAS
V12
, and
DRD cells. DRD cells were engineered to express hTERT, ST,
HRAS
G12V
, dominant negative p53, and constitutively active
cyclin-dependent kinase (CDK)4/cyclin D, which inactivates
the RB protein [17]. The p53DD/CDK4/cyclin D1 combina-
tions substitute for LT. DRD cells are tumorigenic in nude
mice, which is expected from the fact that they are also
derived from BJ primary cells and the effects of mutations in
both cell lines should be similar. The growth inhibitory poten-
tial of shCSNK1E increased as the cell doubling time
decreased, suggesting that the activity is proliferation-rate
dependent rather than genotype dependent (Figure 2b).
Theoretically, the length of shRNA involved in base paring
with the target mRNA is long enough to ensure specificity of
the shRNA clone. However, mismatches between a shRNA
and target mRNAs are tolerable; RISC is able to suppress
expression of off-target mRNAs whose sequences do not per-
fectly complement the guide strand of the shRNA [7]. In order
to confirm our hypothesis that knocking down expression of
CSNK1E is responsible for the observed growth inhibition, we
tested multiple shRNA clones targeting the CSNK1E gene;
each shRNA clone binds to different regions of the CSNK1E
mRNA. If more than a single shRNA clone induces growth
inhibition, CSNK1E is likely to be the relevant target, because
the probability of a common off-target effect of multiple
shRNA clones with unrelated sequences is low. We found that
four shRNAs targeting CSNK1E induced strong growth inhi-
bition in HT1080 cells (Figure 2c). The level of CSNK1E
mRNA decreased upon expression of these shRNAs, as
assessed by real-time quantitative PCR analysis (Figure 2d).
Note that one of these shRNAs, clone 1838, did not display
stronger growth inhibition effects even though the mRNA
level was decreased significantly. This is likely to reflect an
off-target effect of this particular shRNA.
The CSNK1E gene encodes the CK1ε protein, whose main
function is to regulate the circadian rhythm by phosphorylat-
ing other clock gene products [18]. The role of CK1ε in cancer
has been speculated upon, because CK1ε was shown to phos-
phorylate key proteins in cancer signaling pathways, such as
p53 [19] and β-catenin [20]. However, the significance of
these phosphorylation events in carcinogenesis is not known,
and the possibility of using CK1ε as a pharmacological target
for cancer treatment has not been considered. Therefore, we
analyzed the expression level of CSNK1E in human tumor
samples to obtain support for its involvement in human can-
cer. Some genes that are specifically required for tumor main-
tenance are overexpressed in cancer cells over normal cells.
We analyzed the gene-expression database Oncomine for dif-
ferential expression patterns in normal versus tumor in dif-
ferent tissue types [21]. The Oncomine database contained
microarray expression data for CSNK1E from ten different
tissues, including brain, head and neck, renal, bladder, leuke-
mia, lung, melanoma, prostate, salivary gland, and semi-
noma. Interestingly, all tumor tissues in the database showed
upregulated CSNK1E expression compared to normal tissues,
suggesting a positive role of CK1ε in cancer maintenance or
neogenesis (Figure 3).
The proliferation-rate-dependent action of shCSNK1E (Fig-
ure 2b) raises the possibility that shRNA treatment induces
cell cycle arrest; thus, fast growing cells have greater growth
inhibition. To test this hypothesis, we stained the DNA of
shRNA-treated cells with propidium-iodide and analyzed the
cell cycle distribution by flow cytometry. The cell cycle distri-
bution profile indicates that, after expression of shCSNK1E,
HT1080 cells were arrested in the second gap (G2) phase of
the cell cycle, with a concomitant increase in the population
of cells harboring less than the normal diploid DNA content
(that is, sub-G1), implying apoptosis had occurred (Figure
4a).
The cell cycle is primarily regulated by the activity of cyclins
and CDKs. Among CDK/cyclin complexes, CDK1-cyclin A
promotes the transition from G2 to mitosis (M), while CDK1-
cyclin B governs maturation of M phase [22]. We examined
whether shCSNK1E treatment affected expression of cyclin
A2 and cyclin B1 in HT1080 cells. Real-time PCR analysis
revealed that shCSNK1E decreased mRNA levels of cyclin B1
and cyclin A2 (Figure 4b). In contrast, mRNA levels of cyclin
D1, whose function is important for the G1 to S transition,
were slightly increased (Figure 4b). These data are consistent
with the cell cycle distribution pattern after shCSNK1E treat-
ment observed by flow cytometry; knocking down CSNK1E
expression caused down-regulation of cyclin B1 and cyclin
A2, which results in cell cycle arrest at the G2/M phase.
Genome Biology 2008, Volume 9, Issue 6, Article R92 Yang and Stockwell R92.5
Genome Biology 2008, 9:R92
In addition to G2/M phase cell cycle arrest, shCSNK1E treat-
ment induced apoptotic cell death, as evidenced by the
appearance of small, fragmented cells and a sub-G1 popula-
tion (Figure 4a). To confirm the apoptotic phenotype of
shCSNK1E-treated cells, we examined cleavage of poly(ADP-
ribose)polymerase-1 (PARP1), which is cleaved by caspases
during apoptosis. Western blot analysis with antibodies spe-
cific to PARP1 showed that cells treated with a non-targeting
shRNA contained only full length PARP1, whereas those
treated with shCSNK1E or staurosporine, a known inducer of
caspase-dependent apoptosis, contained a diagnostic PARP1
fragment, indicating that apoptotic caspases were activated
by these treatments (Figure 4c). Activation of apoptotic cas-
pases was further confirmed by western blot, which detected
the active form of caspase-3 only in shCSNK1E or stau-
CSNK1E is a target for developing anti-cancer drugs with a potentially high therapeutic indexFigure 2
CSNK1E is a target for developing anti-cancer drugs with a potentially high therapeutic index. (a) Retesting of six hit shRNA clones in isogenic BJ-derived
cell lines. Knocking down CSNK1E induced cancer-cell-specific growth inhibition, whereas knocking down other survival genes did not display differential
activity in the two cell lines. The graph is representative of multiple experiments. (b) The activity of shCSNK1E was examined in four isogenic BJ-derived
cell lines. The growth inhibitory effect of shCSNK1E was proportional to the cell proliferation rate. The doubling time of each cell line is shown in
parentheses. (c) Inhibition of HT1080 cell growth by independent shRNA clones that bind to different regions of CSNK1E mRNA. (d) The knockdown
efficiency of each shRNA clone targeting CSNK1E as assessed by quantitative PCR analysis. Error bars in (b-d) indicate one standard deviation of triplicate
data.
0
20
40
60
80
100
120
CHEK1
PIK3AP1
CSNK1E
IKBKE
CAMK2G
PRKD2
% Cell viability
(a)
BJ-TERT
BJ-TERT/LT/
ST/RAS
V12
BJ-TERT
(40 h)
BJ-TERT/LT/
(28 h)
BJ-TERT/LT/
ST/RAS
V12
(15 h)
DRD
(28 h)
0
0.2
0.4
0.6
0.8
1
1.2
1.4
1.6
1.8
mRNA level
Non-
targeted
HT1080
(c)
(b)
(d)
0
20
40
60
80
100
120
% Cell viability
0
20
40
60
80
100
120
% Cell viability
Non-
targeted
1834
(relative quantification)
ST
1836
1837 1838
1834
1836
1837 1838
Genome Biology 2008, 9:R92
Genome Biology 2008, Volume 9, Issue 6, Article R92 Yang and Stockwell R92.6
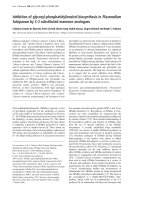
Gene expression studies comparing normal and cancer tissues were analyzed for CSNK1E using Oncomine [21]Figure 3
Gene expression studies comparing normal and cancer tissues were analyzed for CSNK1E using Oncomine [21]. CSNK1E was found to be over-expressed
in cancer samples over normal samples regardless of tissue origin. The graph shows representative results of CSNK1E gene expression analysis from six
human tissues. The number of samples in each study is provided in parentheses. The y-axis units are based on z-score normalization and the P-value of
each set is shown at the bottom of the graph. The upper and lower bands of the box represent the 75th and 25th percentiles, respectively; the upper and
lower error bars represent the 90th and 10th percentiles, respectively. The table shows normalized expression levels of CSNK1E in normal and cancer
samples from ten human tissues.
-2.5
-2
-1.5
-1
-0.5
0
0.5
1
1.5
2
2.5
Head and
neck
Normal
(14)
Cancer
(42)
Germ cell
(14)
Semino-
ma(23)
Bladder
Normal
(48)
Carcino-
ma (109)
Leukemia
Bone
marrow
(6)
Leuke-
mia(87)
Prostate
Benign
(22)
Carcino-
ma (30)
Salivary gland
Normal
(6)
Carcino-
ma (16)
CSNK1E
Casein kinase 1, epsilon
Normal Cancer
Brain
0.83 (23) 1.07 (50) 8.40E-06
Head and neck
-0.53 (14) -0.22 (42) 1.10E-05
Renal
0.37 (162) 0.76 (16) 6.80E-05
Bladder
-0.86 (48) -0.38 (109) 4.20E-14
Leukemia
-1.64 (6) 0.55 (87) 1.30E-08
Lung
1.19 (17) 1.6 (20) 1.60E-05
Melanoma
0.61 (7) 0.81 (45) 1.30E-05
Prostate
-0.35 (22) 0.73 (30) 4.00E-07
Salivary gland
0.67 (6) 1.58 (16) 9.80E-07
Seminoma
0.54 (6) 0.77 (91) 1.80E-06
Normalized expression level
a
a
Data represent median value of samples; sample
size is indicated in parentheses.
P-valueTissues
Z-score nomalized expression level
P = 1.1e
-5
P = 3.8e
-7
P = 4.2e
-14
P = 1.3e
-8
P = 4.0e
-7
P = 9.8e
-7
Testis
Genome Biology 2008, Volume 9, Issue 6, Article R92 Yang and Stockwell R92.7
Genome Biology 2008, 9:R92
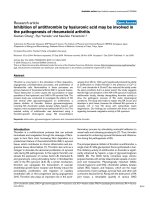
Knocking down CSNK1E induces G2/M cell cycle arrest and caspase-mediated apoptosisFigure 4
Knocking down CSNK1E induces G2/M cell cycle arrest and caspase-mediated apoptosis. (a) Two days after non-targeting shRNA or shCSNK1E treatment,
HT1080 cells were fixed in methanol and stained with propidium iodide (Materials and methods). Flow cytometry of cells was performed on a
FACSCalibur; calculation of cell cycle stages was performed using the cell cycle analysis program Modifit LT. Red area shows cell population in G1 or G2
cell cycle phase, while gray area shows dying cells. Label 'A' denotes apoptotic cell population. Insets show photographs of HT1080 cells treated with non-
targeting shRNA or shCSNK1E. (b) Knocking down CSNK1E down-regulates CyclinB1 and CyclinA2. Cellular RNAs were prepared from HT1080 cells
infected with either non-targeting shRNA (N.T.) or two different CSNK1E-targeting shRNAs (1834, 1837), and real-time PCR was performed with each
gene-specific primer set. The expression levels of CyclinB1, CyclinA2 and CyclinD1 were first normalized to the level of an endogenous control (RPLPO), and
then the relative expression level of each gene among the three cell lines was expressed as a ratio of transcripts in a cell line to those in non-targeted
shRNA treated cells. Error bars indicate one standard deviation of triplicate data. (c) Knocking down CSNK1E induces caspase activation. Whole cell
lysates from HT1080 cells infected with either non-targeting shRNA or shCSNK1E and cells treated with staurosporine were prepared. The cleavage of
PARP1 or caspase-3 (Casp-3) in each sample was examined by western blotting using antibodies against PARP1 and cleaved caspase-3.
G1: 62.30%
G2: 23.66%
S: 14.03%
G1: 66.00%
G2: 34.00%
S: 0.00%
(a)
A
A
0
0.2
0.4
0.6
0.8
1
1.2
CyclinB1
mRNA level
0
0.2
0.4
0.6
0.8
1
1.2
1.4
CyclinA2
0
0.5
1
1.5
2
CyclinD1
(b)
(c)
Cleaved
Casp-3
20
15
M.W.
(kDa)
100
75
M.W.
150
Cleaved
PARP
Non-targeted
shCSNK1E
Staurosporine
Non-targeted
shCSNK1E
Staurosporine
(relative quantification)
N.T. 1834 1837
N.T. 1834 1837 N.T. 1834 1837
Number
200
400
600
800
1,000
0
0 50 100 150 200 250
Channels (FL2-A-FL2 area)
Channels (FL2-A-FL2 area)
0
50
100
150 200
250
Number
100
200
300
400
0
(kDa)
Non-targeting shRNA shCSNK1E
Genome Biology 2008, 9:R92
Genome Biology 2008, Volume 9, Issue 6, Article R92 Yang and Stockwell R92.8
rosporine-treated samples (Figure 4c). Thus, shCSNK1E
induces caspase-mediated apoptosis in sensitive cancer cells.
These results suggest that chemotherapeutic reagents target-
ing CK1ε may induce growth arrest and apoptosis with some
degree of cancer cell selectivity. To test this hypothesis, we
examined the effect of IC261, a kinase inhibitor of CK1ε, in
cell culture. IC261 was reported to selectively inhibit casein
kinase 1 compared to other protein kinases, by an ATP-com-
petitive mechanism. Moreover, it showed an order of magni-
tude greater selectivity for CK1δ and CK1ε over other casein
kinase 1 isoforms [23]. Treatment with IC261 started to
inhibit the growth of HT1080 cells at submicromolar concen-
trations (Figure 5a). When we tested IC261 in BJ-TERT and
BJ-TERT/LT/ST/RAS
V12
cells, the sensitivity of BJ-TERT/
LT/ST/RAS
V12
cells was greater than that of BJ-TERT cells,
which was consistent with the results obtained with
shCSNK1E (Figures 5b and 2a). These data suggest that inhi-
bition of the kinase activity of CK1ε is crucial for the observed
growth arrest and apoptosis, as opposed to other functions of
this protein, such as those mediated by protein-protein
interactions. Moreover, as shRNAs targeting CK1δ were not
effective in suppressing cell growth during primary screening,
the cancer-cell-selective activity of IC261 can likely be attrib-
uted to its inhibition of CK1ε (Additional data file 1).
CK1ε is known to control the circadian rhythm by phosphor-
ylating clock proteins, such as PERIOD and CRYPTO-
CHROME [24]. These clock proteins are also reported to
regulate the cell cycle, suggesting they have a role in linking
the circadian system and the cell cycle machinery [25,26].
Mammalian cells have three isoforms of PERIOD proteins
and two isoforms of CRYPTOCHROME proteins, which are
encoded by PER1, PER2, PER3, CRY1 and CRY2 genes,
respectively. In order to define the role of each isoform in
CK1ε-mediated growth regulation, we conducted counter-
screening with shRNAs targeting these genes to identify sup-
pressors of IC261-induced growth inhibition in HT1080 cells.
Knocking down expression of PER1, PER3, CRY1, or CRY2
did not affect growth inhibition by IC261 (Additional data file
2). However, four different shRNA clones targeting PER2
suppressed IC261-induced growth inhibition, implying that
PERIOD2 is the most crucial substrate of CK1ε in controlling
cell proliferation (Figure 5c,d). Note that the maximum
growth inhibition by IC261 in Figure 5c is smaller than that in
Figure 5a, though they have similar EC50 values of 0.1 μg/ml.
This is because cells have been growing for three days before
being treated with IC261 in order to express shRNAs target-
ing PER2, whereas in Figure 5a, IC261 was added to culture at
the time of cell seeding.
As we showed that the proliferation rate of target cells is an
important determinant of growth inhibition by CSNK1E
knockdown (Figure 2b), we measured the proliferation rate of
HT1080 cells upon PER2 knockdown using the alamar blue
assay (Figure 5e). None of the shRNA clones targeting PER2
changed the proliferation rate of HT1080 cells, indicating
that the protective effect of PER2 knockdown on IC261-
induced growth inhibition is not caused by slowing cell
growth. It has been shown that a major function of CK1ε in the
circadian rhythm is to phosphorylate PERIOD2, which drives
proteosome-mediated degradation of PERIOD2 [27]. In sev-
eral independent reports, overexpression of PERIOD2 has
been shown to exert anti-tumor effects in both cell culture
and mouse models [26,28,29]. Therefore, treatment with
IC261 is likely to stabilize PERIOD2, which activates the
PERIOD2-mediated tumor suppression pathway.
Here, we report the identification of CK1ε as a potential target
for developing anticancer reagents. The mammalian CK1
family consists of at least seven isoforms (α, β, γ1, γ2, γ3, δ and
ε), as well as additional splice variants [18]. They share highly
conserved kinase domains, but differ significantly in the
length and primary structure of their amino- and carboxy-ter-
minal non-catalytic domains, implying that each isoform may
play a specific role in regulating biological processes [18].
Defining isoform-specific functions will aid us in developing
agents with enhanced specificity and reduced off-target
effects. As the specificity of RNAi agents is potentially high, it
allows us to differentiate among these isoforms, which is chal-
lenging for some chemical inhibitors.
In our screening, knocking down other isoforms of CK1 was
not effective at inducing growth arrest, implying that CK1ε
has a unique function in promoting the integrity and prolifer-
ation of tumor cells. The nature of the signaling pathway that
CK1ε uses to control cell growth remains elusive, but several
lines of evidence support a positive role of this kinase in onco-
genesis. First, in our gene expression analysis, cancer cells
have a high level of CK1ε compared to normal cells, regardless
of the tissue origin, implying that a high level of CK1ε causes
a growth or survival advantage during tumorigenesis (Figure
3). Second, in a recent report, enforced expression of myris-
toylated-CK1ε, but not other isoforms, induced colony forma-
tion in soft-agar-growing engineered human epithelial cells
[30]. Third, deletion of PERIOD2 in mice caused increased
tumor development upon gamma-radiation, suggesting a
tumor suppressive role of PERIOD2 [26]. CK1ε is a major
kinase that phosphorylates and degrades the PERIOD2 pro-
tein through the proteasome [31]; therefore, it is likely that
CK1ε exerts its oncogenic effect by inhibiting the tumor sup-
pressive function of PERIOD2. In accordance with this
model, we showed that knocking down PER2 abrogated the
growth inhibitory effect of IC261, a kinase inhibitor of CK1ε
(Figure 5c).
Conclusion
RNAi libraries and isogenic cell lines make it possible to iden-
tify target genes and proteins for cancer therapeutic develop-
ment. We found that CSNK1E is one such target gene upon
which cancer cells depend more than normal cells. As kinase
Genome Biology 2008, Volume 9, Issue 6, Article R92 Yang and Stockwell R92.9
Genome Biology 2008, 9:R92
PERIOD2 is a key substrate of CK1ε that mediates IC261-induced growth inhibitionFigure 5
PERIOD2 is a key substrate of CK1ε that mediates IC261-induced growth inhibition. (a) IC261, a kinase inhibitor of CK1ε, induces growth inhibition in
HT1080 cells. (b) IC261 treatment in BJ-derived cell lines showed a similar degree of cancer cell selective growth inhibition as shCSNK1E treatment. (c)
Knocking down PER2 in HT1080 cells rescues growth inhibition induced by IC261. HT1080 cells were infected with indicated lentiviruses containing
different shRNA clones targeting PER2 (per2_538, per2_539, per2_541, or per2_542). After two days of infection, cells were treated with the indicated
concentration of IC261 and percent growth inhibition was determined using alamar blue. Values in (a-c) represent the mean ± standard deviation of
triplicate data. (d) Cellular RNAs were prepared from the same set of virus infected cells in (c), and real-time PCR was performed with a PER2-specific
primer set to monitor the efficiency of knock down by shRNA clones. (e) Proliferation rate of HT1080 cells infected with the same set of viruses as in (c)
was determined using alamar blue assay. Error bars in (d,e) indicate one standard deviation of triplicate data. N.T., non-targeting shRNA clone.
(a)
[IC261], µg/mL
[IC261], µg/mL
BJ-TERT
BJ-TERT/LT/ST/RAS
V12
(c)
0
0.2
0.4
0.6
0.8
1
1.2
1.4
N.T.
mRNA level
(b)
(d)
0
20
40
60
0
20
40
60
0
20
40
N.T.
per2_538
per2_539
per2_541
per2_542
[IC261], µg/mL
(e)
40,000
50,000
60,000
70,000
80,000
Fluorescence value
(Ex535nm/Em590nm)
N.T.
% Growth inhibition
% Growth inhibition
% Growth inhibition
(relative quantification)
0.001
0.01 0.1
110
0
0.05 0.1
0.15 0.2
0.25 0.3
0123
per2 per2 per2 per2
538 539 541 542
per2 per2 per2 per2
538 539 541 542
Genome Biology 2008, 9:R92
Genome Biology 2008, Volume 9, Issue 6, Article R92 Yang and Stockwell R92.10
inhibitors of CK1ε displayed the same phenotype as shRNA
treatments, efforts to develop kinase inhibitors of CK1ε with
enhanced potency and selectivity would be valuable. Future
work involving the screening of larger shRNA libraries might
reveal additional potential drug targets.
Materials and methods
Cell lines
The human fibrosarcoma cell line HT1080 was maintained in
Dulbecco's modified Eagle's medium (DMEM) supplemented
with non-essential amino acids and 10% calf serum. The
human osteosarcoma cell line U-2-OS was grown in McCoy's
5A medium supplemented with 10% calf serum. BJ-fibrob-
last-derived cell lines were grown in a 4:1 mixture of DMEM
to M199 supplemented with 15% heat-inactivated fetal bovine
serum. Penicillin and streptomycin were used as antibiotics
in all media. All cells were incubated in a tissue culture incu-
bator at 37°C in a humidified incubator containing 5% CO
2
.
Lentiviral shRNA library
We used a library targeting human kinases for our screening
that was generated by The RNAi Consortium [32]. Our
shRNA library consists of lentivirus solutions in 384-deep-
well polypropylene plates (Greiner, Monroe, NC, USA, cata-
log number 781270). The library targets 1,006 human genes,
including kinases, those similar to kinases and some ancillary
proteins. The lentivirus in each well contains an expression
cassette (pLKO.1) encoding a single shRNA clone. On aver-
age, the library contains five different shRNA clones targeting
each gene and has a typical virus titer range from 10
7
-10
8
IU
(infection unit)/ml. We refer to these plates as virus mother
plates.
Primary screening
Assay plates were prepared by seeding 400 U-2-OS or
HT1080 cells per well in 40 μl of growth media in black, clear-
bottom, 384-well plates (Corning Inc., Corning, NY, USA, cat-
alog number 3712). The next day, 40 μl of virus daughter
plates were prepared by transferring 2 μl of virus stock solu-
tion from virus mother plates and 4 μl of 10× polybrene solu-
tion to 34 μl of cell growth media in 384-well polypropylene
plates (Greiner, catalog number 781280). Whole growth
media in the assay plates were replaced with 40 μl of virus/
polybrene/media mixture from the virus daughter plates.
Then, virus infection was carried out by centrifuging the assay
plates for 1.5 h at 2,250 rpm, 37°C and the assay plates were
returned to a tissue culture incubator. Three days later,
alamar blue was added to the assay plates. All liquid handling
was carried out using a Biomek FX AP384 module (Beckman
Coulter, Fullerton, CA, USA). Cell viability was measured
using alamar blue (Invitrogen, Carlsbad, CA, USA, catalog
number DAL1100); subsequently, percent growth inhibition
(%GI) was calculated from the following formula using fluo-
rescence intensity values:
%GI = 100 × (1 - (X - N)/(P - N))
where X is values from cells infected with shRNAs, N is the
values from media only, and P is the values from cells grown
without shRNAs.
All experiments were performed in triplicate and median per-
cent growth inhibition value was taken for selecting final hits
to be analyzed.
Follow-up analysis of hit shRNA clones
Virus production
We used lentiviral plasmids encoding shRNAs targeting
CSNK1E (catalog number SHGLY-NM_001894), PER1 (cata-
log number SHGLY-NM_002616), PER2 (catalog number
SHGLY-NM_003894), PER3 (catalog number SHGLY-
NM_016831), CRY1 (catalog number SHGLY-NM_004075),
or CRY2 (catalog number SHGLY-NM_021117). All shRNA
clones were obtained from Sigma's MISSION
®
shRNA collec-
tion (Sigma, St. Louis, MO, USA). Plasmid DNA was purified
using a HiSpeed Plasmid Midi kit (Qiagen, Valencia, CA,
USA, catalog number 12643). On day one, 2 × 10
6
293T cells
were seeded in 10 cm tissue culture dishes; on day two, 2.8 μg
of shRNA-plasmid construct and 2.5 μg of pDelta8.9 and 0.28
μg of pVSV-G helper plasmids were co-transfected into the
293T cells using FuGENE
®
6 Transfection Reagent (Roche,
Indianapolis, IN, USA, catalog number 11-814-443-001); on
day three, the medium was replaced with 7.5 ml of viral col-
lection media (VCM) that consists of DMEM supplemented
with penicillin and streptomycin (pen/strep), and 30%
Hyclone iFCS (Hyclone, Logan, UT, USA, catalog number
83007-198); on day four, in the morning, the supernatant
containing virus was harvested to empty 50 ml conical tubes
and 7.5 ml of fresh VCM was added back to virus producing
293T cell monolayer. We harvested and replaced the VCM
again in the evening; on day five, in the morning, we har-
vested the supernatant and bleached the 293T cell culture.
The collected virus supernatant was filtered through a 0.45
μm syringe filter (Nalgene, Rochester, NY, USA, catalog
number 190-9945), aliquoted in 2 ml to the cryovials, and
stored at -80°C freezer until time of use.
Virus infection
We seeded 200,000 target cells on 10 cm tissue culture dishes
and the culture was incubated at 37°C in a CO
2
incubator for
24 h. The next day, frozen stocks of virus solution were
thawed at 37°C for a couple of minutes and polybrene (Sigma,
catalog number H9268) was added at a final concentration of
8 μg/ml. Culture media was replaced with virus/polybrene
mix and the culture dish was incubated for 2 h with rocking
every 30 minutes. After 2 h, 10 ml of growth media was added
to culture dish and the culture was incubated further for 2
days before harvesting or treatment of compounds.
Genome Biology 2008, Volume 9, Issue 6, Article R92 Yang and Stockwell R92.11
Genome Biology 2008, 9:R92
Retesting shRNA clones in four BJ cell lines
BJ-TERT or BJ-TERT/LT/ST/RAS
V12
cells were seeded and
infected with lentivirus as described above. After 60 h,
infected cells were released with trypsin/EDTA and harvested
in 4 ml BJ growth medium. Aliquots of the cell suspension
were used for determining cell viability by trypan blue assay.
A hit shRNA clone that displayed differential activity between
BJ-TERT and BJ-TERT/LT/ST/RAS
V12
cells was further
tested in BJ-TERT, BJ-TERT/LT/ST, BJ-TERT/LT/ST/
RAS
V12
, or DRD cells using the same method. Trypan blue
staining, taking 100 images of samples, and analysis of the
images were carried out automatically by Vi-Cell (Beckman
Coulter).
Monitoring drug sensitivity
On the day of the experiment, empty 384-deep-well polypro-
pylene plates (Greiner, catalog number 781270) were filled
with 50 μl growth media except for columns 5 and 13, where
100 μl of IC261 solution (100 μg/ml in growth media) was
transferred. IC261 is a kinase inhibitor of CK1ε and was pur-
chased from Calbiochem, San Diego, CA, USA (catalog
number 400090). After IC261 solution transfer, 2-fold dilu-
tion series across columns 5-12 and columns 13-20 were done
by transferring 50 μl of compound solution to the next col-
umn successively (8-point dilution series) with mixing. We
named this plate '10× IC261 plate'. Assay plates were pre-
pared by seeding 1,500 shRNA-infected HT1080 cells per
well in 36 μl of growth media to black, clear bottom 384-well
plates. Cells in the assay plates were treated with IC261 in a 2-
fold dilution series by transferring 4 μl solution from a 10×
IC261 plate. Assay plates were returned to the culture incuba-
tor and maintained for 24 h before adding alamar blue. Per-
cent growth inhibition was calculated using fluorescence
intensity values.
Alamar blue assay
After 24 or 48 h of compound treatment, 10 μl of 50% alamar
blue solution in growth medium was transferred to the assay
plates, which resulted in 10% final concentration alamar blue.
Plates were incubated further for 16 h to allow reduction of
alamar blue, which results in the generation of red fluores-
cence. The fluorescence intensity was determined using a Vic-
tor 3 plate reader (Perkin Elmer, Waltham, MA, USA) with a
535 nm excitation filter and a 590 nm emission filter.
Cell cycle analysis
HT1080 cells were seeded in 10 cm dishes and were infected
with lentivirus-harboring shRNA targeting CSNK1E for 48 h.
The infected cells were harvested, washed once with phos-
phate-buffered saline (PBS), and resuspended in 1 ml of ice-
cold PBS. We transferred 300 μl of PBS-cell suspension to
pre-chilled 15 ml tubes, mixed with 5 ml of ice-cold MeOH,
and incubated at -20°C overnight. Fixed cells were rehy-
drated in PBS for 3 h and then pelleted by centrifugation.
Cells were reconstituted in 300 μl of PBS containing 60 μg/ml
propidium iodide and 50 μg/ml RNase A. Cell cycle profiles
were obtained using a FACScalibur flow cytometer (BD Bio-
sciences, San Jose, CA, USA) and CellQuest software (BD
Biosciences).
Real-time quantitative PCR
Total RNA was extracted using the RNeasy kit (Qiagen, cata-
log number 74104) as described in the manufacturer's hand-
book. RNA sample (1 μg) was subject to reverse transcription
reaction using TaqMan
®
Reverse Transcription Reagents
(Applied Biosystems, Foster City, CA, USA, catalog number
N8080234) according to the manufacturer's instructions.
Then, quantitative PCR was carried out using Power SYBR
®
Green PCR Master Mix (Applied Biosystems, catalog number
4367659) and 7300 Real-Time PCR System (Applied Biosys-
tems). The primer sequences used for quantitative PCR were:
PER2_F, 5'-GCAAAATCTGAACACAACCC-3'; PER2_R, 5'-
CTTTGTGTGTGTCCACTTTC-3'; CYCLINB1_F, 5'-
CTGGCTAAGAATGTAGTCATG-3'; CYCLINB1_R, 5'-GGTA-
GAGTGCTGATCTTAGC-3'; CYCLINA2_F, 5'-CAGCAGCCT-
GCAAACTGC-3'; CYCLINA2_R, 5'-
GAGGTATGGGTCAGCATC-3'; WEE1_F, 5'-GCATTTAT-
GCCATTAAGCGATC-3'; WEE1_R, 5'-GAGAATGCTGTC-
CAAGCAC-3'; CYCLIND1_F, 5'-CTTCGTTGCCCTCTGTGC-
3'; CYCLIND1_R, 5'-CACCATGGAGGGCGGATTG-3'.
The mRNA level of human acidic ribosomal phosphoprotein
P0 was measured using the following primers and used as a
reference for quantification: RPLP0 F, 5'-ACGGGTACAAAC-
GAGTCCTG-3'; RPLP0 R, 5'-GCCTTGACCTTTTCAGCAAG-
3'.
Western blotting
Monitoring cleavage of PARP1 and caspase-3 upon shRNA treatment
We seeded 2 × 10
6
HT1080 cells in 10 cm dishes and treated
them with 1 μM staurosporine for 16 h. Virus containing
shRNAs targeting CSNK1E was used to infect HT1080 cells
for 48 h. Both dying cells and live cells in each 10 cm dish were
harvested and collected in the same 15 ml tubes by centrifug-
ing cell suspensions at 1,000 rpm for 5 minutes. Cell pellets
were washed three times with PBS and cells were lysed in 200
μl of denaturing lysis buffer (50 mM HEPES KOH (pH 7.4),
40 mM NaCl, 2 mM EDTA, 1.5 mM Na
3
VO
4
, 50 mM NaF, 10
mM sodium pyrophosphate, 10 mM sodium β-glycerophos-
phate, 0.5% Triton X-100, and protease inhibitor tablet
(Roche, catalog number 11836170001)). Protein content was
quantified using a Bio-Rad protein assay reagent (Bio-Rad,
Hercules, CA, USA, catalog number 500-00006). Equal
amounts of protein were resolved on SDS-polyacrylamide
gels. The electrophoresed proteins were transblotted onto a
PVDF membrane, blocked with 5% milk, and incubated with
rabbit primary antibodies specific to: PARP1 (Santa Cruz,
Santa Cruz, CA, USA, catalog number sc-7150); cleaved cas-
pase-3 (Cell Signaling Technology, Danvers, MA, USA, cata-
log number 9661) overnight at 4°C. The membrane was then
incubated in IRDye 800 goat anti-rabbit antibody (Li-cor
Bioscience, Lincoln, NE, USA, catalog number 926-32211) at
Genome Biology 2008, 9:R92
Genome Biology 2008, Volume 9, Issue 6, Article R92 Yang and Stockwell R92.12
1:3,000 dilutions for 45 minutes at room temperature. After
washing off the unbound antibodies, membranes were
scanned using the Odyssey™ Imaging System (Li-cor
Bioscience).
Abbreviations
CDK, cyclin-dependent kinase; CK1ε, casein kinase 1-epsilon;
DMEM, Dulbecco's modified Eagle's medium; GI, growth
inhibition; hTERT, catalytic subunit of human telomerase;
LT, SV40 large T oncoprotein; PARP1, poly(ADP-
ribose)polymerase-1; PBS, phosphate-buffered saline; RISC,
RNA-induced silencing complex; RNAi, RNA-interference;
shCSNK1E, shRNA targeting CSNK1E; shRNA, short hairpin
RNA; ST, SV40 small T oncoprotein; VCM, viral collection
media.
Authors' contributions
WSY and BRS conceived the study, designed the experiments,
analyzed the data, and wrote the manuscript. WSY collected
the data. BRS supervised the research.
Additional data files
The following additional data are available. Additional data
file 1 displays the growth inhibitory activity of all shRNAs
used in this study, statistical analysis, and list of hits. Addi-
tional data file 2 is a figure showing the results of testing shR-
NAs targeting PER1, PER3, CRY1, and CRY2 for suppressing
IC261-induced growth arrest.
Additional data file 1Growth inhibitory activity of all shRNAs used in this study, statisti-cal analysis, and list of hitsGrowth inhibitory activity of all shRNAs used in this study, statisti-cal analysis, and list of hits.Click here for fileAdditional data file 2Results of testing shRNAs targeting PER1, PER3, CRY1, and CRY2 for suppressing IC261-induced growth arrestResults of testing shRNAs targeting PER1, PER3, CRY1, and CRY2 for suppressing IC261-induced growth arrest.Click here for file
Acknowledgements
This research of BRS was funded in part by a Career Award at the Scientific
Interface from the Burroughs Wellcome Fund, by the Arnold and Mabel
Beckman Foundation and by the National Cancer Institute
(R01CA097061). We thank David Root and the RNAi Consortium for pro-
viding the lentiviral shRNA stocks for the primary screen.
References
1. Capdeville R, Buchdunger E, Zimmermann J, Matter A: Glivec
(STI571, imatinib), a rationally developed, targeted antican-
cer drug. Nat Rev Drug Discov 2002, 1:493-502.
2. Wilhelm S, Carter C, Lynch M, Lowinger T, Dumas J, Smith RA,
Schwartz B, Simantov R, Kelley S: Discovery and development of
sorafenib: a multikinase inhibitor for treating cancer. Nat Rev
Drug Discov 2006, 5:835-844.
3. Davies H, Bignell GR, Cox C, Stephens P, Edkins S, Clegg S, Teague J,
Woffendin H, Garnett MJ, Bottomley W, Davis N, Dicks E, Ewing R,
Floyd Y, Gray K, Hall S, Hawes R, Hughes J, Kosmidou V, Menzies A,
Mould C, Parker A, Stevens C, Watt S, Hooper S, Wilson R, Jayatilake
H, Gusterson BA, Cooper C, Shipley J, et al.: Mutations of the
BRAF gene in human cancer. Nature 2002, 417:949-954.
4. Samuels Y, Wang Z, Bardelli A, Silliman N, Ptak J, Szabo S, Yan H,
Gazdar A, Powell SM, Riggins GJ, Willson JK, Markowitz S, Kinzler
KW, Vogelstein B, Velculescu VE: High frequency of mutations of
the PIK3CA gene in human cancers. Science 2004, 304:554.
5. Parada LF, Tabin CJ, Shih C, Weinberg RA: Human EJ bladder car-
cinoma oncogene is homologue of Harvey sarcoma virus ras
gene. Nature 1982, 297:474-478.
6. Iorns E, Lord CJ, Turner N, Ashworth A: Utilizing RNA interfer-
ence to enhance cancer drug discovery. Nat Rev Drug Discov
2007, 6:556-568.
7. Kim VN: Small RNAs: classification, biogenesis, and function.
Mol Cells 2005, 19:1-15.
8. Kolfschoten IG, van Leeuwen B, Berns K, Mullenders J, Beijersbergen
RL, Bernards R, Voorhoeve PM, Agami R: A genetic screen identi-
fies PITX1 as a suppressor of RAS activity and
tumorigenicity. Cell 2005, 121:849-858.
9. Westbrook TF, Martin ES, Schlabach MR, Leng Y, Liang AC, Feng B,
Zhao JJ, Roberts TM, Mandel G, Hannon GJ, Depinho RA, Chin L,
Elledge SJ: A genetic screen for candidate tumor suppressors
identifies REST. Cell 2005, 121:837-848.
10. MacKeigan JP, Murphy LO, Blenis J: Sensitized RNAi screen of
human kinases and phosphatases identifies new regulators of
apoptosis and chemoresistance. Nat Cell Biol 2005, 7:591-600.
11. Berns K, Hijmans EM, Mullenders J, Brummelkamp TR, Velds A,
Heimerikx M, Kerkhoven RM, Madiredjo M, Nijkamp W, Weigelt B,
Agami R, Ge W, Cavet G, Linsley PS, Beijersbergen RL, Bernards R:
A large-scale RNAi screen in human cells identifies new com-
ponents of the p53 pathway. Nature 2004, 428:431-437.
12. Brummelkamp TR, Fabius AW, Mullenders J, Madiredjo M, Velds A,
Kerkhoven RM, Bernards R, Beijersbergen RL: An shRNA barcode
screen provides insight into cancer cell vulnerability to
MDM2 inhibitors. Nat Chem Biol 2006, 2:202-206.
13. Swanton C, Marani M, Pardo O, Warne PH, Kelly G, Sahai E,
Elustondo F, Chang J, Temple J, Ahmed AA, Brenton JD, Downward
J, Nicke B: Regulators of mitotic arrest and ceramide metab-
olism are determinants of sensitivity to Paclitaxel and other
chemotherapeutic drugs. Cancer Cell 2007, 11:498-512.
14. Ngo VN, Davis RE, Lamy L, Yu X, Zhao H, Lenz G, Lam LT, Dave S,
Yang L, Powell J, Staudt LM: A loss-of-function RNA interference
screen for molecular targets in cancer. Nature 2006,
441:106-110.
15. Dolma S, Lessnick SL, Hahn WC, Stockwell BR: Identification of
genotype-selective antitumor agents using synthetic lethal
chemical screening in engineered human tumor cells. Cancer
Cell 2003, 3:285-296.
16. Hahn WC, Counter CM, Lundberg AS, Beijersbergen RL, Brooks
MW, Weinberg RA: Creation of human tumour cells with
defined genetic elements. Nature 1999, 400:464-468.
17. Hahn WC, Dessain SK, Brooks MW, King JE, Elenbaas B, Sabatini DM,
DeCaprio JA, Weinberg RA: Enumeration of the simian virus 40
early region elements necessary for human cell
transformation. Mol Cell Biol 2002, 22:2111-2123.
18. Knippschild U, Gocht A, Wolff S, Huber N, Löhler J, Stöter M: The
casein kinase 1 family: participation in multiple cellular proc-
esses in eukaryotes. Cell Signal 2005, 17:675-689.
19. Knippschild U, Milne DM, Campbell LE, DeMaggio AJ, Christenson E,
Hoekstra MF, Meek DW: p53 is phosphorylated in vitro and in
vivo by the delta and epsilon isoforms of casein kinase 1 and
enhances the level of casein kinase 1 delta in response to
topoisomerase-directed drugs. Oncogene 1997, 15:
1727-1736.
20. Amit S, Hatzubai A, Birman Y, Andersen JS, Ben-Shushan E, Mann M,
Ben-Neriah Y, Alkalay I: Axin-mediated CKI phosphorylation of
beta-catenin at Ser 45: a molecular switch for the Wnt
pathway. Genes Dev 2002, 16:1066-1076.
21. Rhodes DR, Kalyana-Sundaram S, Mahavisno V, Varambally R, Yu J,
Briggs BB, Barrette TR, Anstet MJ, Kincead-Beal C, Kulkarni P, Vara-
mbally S, Ghosh D, Chinnaiyan AM: Oncomine 3.0: genes, path-
ways, and networks in a collection of 18,000 cancer gene
expression profiles. Neoplasia 2007, 9:166-180.
22. Hunter T, Pines J: Cyclins and cancer. Cell 1991, 66:1071-1074.
23. Mashhoon N, DeMaggio AJ, Tereshko V, Bergmeier SC, Egli M, Hoek-
stra MF, Kuret J: Crystal structure of a conformation-selective
casein kinase-1 inhibitor. J Biol Chem 2000, 275:20052-20060.
24. Ko CH, Takahashi JS: Molecular components of the mammalian
circadian clock. Hum Mol Genet 2006, 15:R271-R277.
25. Matsuo T, Yamaguchi S, Mitsui S, Emi A, Shimoda F, Okamura H:
Control mechanism of the circadian clock for timing of cell
division in vivo. Science 2003, 302:255-259.
26. Fu L, Pelicano H, Liu J, Huang P, Lee C: The circadian gene
Period2 plays an important role in tumor suppression and
DNA damage response in vivo. Cell 2002, 111:41-50.
27. Lowrey PL, Takahashi JS: Mammalian circadian biology: eluci-
dating genome-wide levels of temporal organization. Annu
Rev Genomics Hum Genet 2004, 5:407-441.
28. Hua H, Wang Y, Wan C, Liu Y, Zhu B, Yang C, Wang X, Wang Z,
Cornelissen-Guillaume G, Halberg F: Circadian gene mPer2
Genome Biology 2008, Volume 9, Issue 6, Article R92 Yang and Stockwell R92.13
Genome Biology 2008, 9:R92
overexpression induces cancer cell apoptosis. Cancer Sci 2006,
97:589-596.
29. Hua H, Wang Y, Wan C, Liu Y, Zhu B, Wang X, Wang Z, Ding JM:
Inhibition of tumorigenesis by intratumoral delivery of the
circadian gene mPer2 in C57BL/6 mice. Cancer Gene Ther 2007,
14:815-818.
30. Boehm JS, Zhao JJ, Yao J, Kim SY, Firestein R, Dunn IF, Sjostrom SK,
Garraway LA, Weremowicz S, Richardson AL, Greulich H, Stewart
CJ, Mulvey LA, Shen RR, Ambrogio L, Hirozane-Kishikawa T, Hill DE,
Vidal M, Meyerson M, Grenier JK, Hinkle G, Root DE, Roberts TM,
Lander ES, Polyak K, Hahn WC: Integrative genomic approaches
identify IKBKE as a breast cancer oncogene. Cell 2007,
129:1065-1079.
31. Eide EJ, Woolf MF, Kang H, Woolf P, Hurst W, Camacho F, Vielhaber
EL, Giovanni A, Virshup DM: Control of mammalian circadian
rhythm by CKIepsilon-regulated proteasome-mediated
PER2 degradation. Mol Cell Biol 2005, 25:2795-2807.
32. Moffat J, Grueneberg DA, Yang X, Kim SY, Kloepfer AM, Hinkle G,
Piqani B, Eisenhaure TM, Luo B, Grenier JK, Carpenter AE, Foo SY,
Stewart SA, Stockwell BR, Hacohen N, Hahn WC, Lander ES, Sabatini
DM, Root DE: A lentiviral RNAi library for human and mouse
genes applied to an arrayed viral high-content screen. Cell
2006, 124:1283-1298.
33. Beissbarth T, Speed TP: GOstat: find statistically overrepre-
sented Gene Ontologies within a group of genes. Bioinformatics
2004, 20:1464-1465.