Candlestick and pivot point trading triggers setups for stock forex and futures markets 2007 phần 2 pdf
Bạn đang xem bản rút gọn của tài liệu. Xem và tải ngay bản đầy đủ của tài liệu tại đây (2.02 MB, 37 trang )
• Door Number One: Could be an outright stock purchase with a selec-
tive stop-loss.
• Door Number Two: Could be utilizing the options market. That can be
an exciting and worthwhile exploration of a simple purchase of a call
option to utilize leverage or the use of a more complex strategy, such as
a bull call spread, or a hedging program, such as a collar strategy. The
latter uses the premiums collected from the sale of an out-of-the-money
call option to purchase a close-to-the-money put option, which in turn
protects the price erosion of an underlying stock position.
• Door Number Three: Could be taking a trading opportunity by imple-
menting a spread strategy, which would involve buying one stock and
selling short another. This is a sophisticated strategy and one that be-
ginners should study extensively prior to implementing. However, if
you enjoy following and understanding who and what the competitor is
in a specific sector or industry group, this could be your cup of tea. Se-
lecting the right stocks requires extensive research and a good working
knowledge of the fundamentals of that sector or industry. After all, you
Trading Vehicles, Stock, ETFs, Futures, and Forex 23
FIGURE 1.5
RealTick graphics used with permission of Townsend Analytics, LTD.
c01.qxd 9/24/06 9:48 AM Page 23
are looking for one company to outperform the competitor, so you
need to know as much as possible about that business.
Trading decisions and correct stock selection involve more than look-
ing at a chart and a few technical indicators. I believe it helps to look a lit-
tle deeper in expected earnings forecasts and price-to-earnings (P/E) ratios
to see if the stock is expensive or cheap relative to current prices. Calcu-
lating P/E ratios is an easy concept; for example, if a stock is trading at $40
per share and has an earnings of $4 per share, the P/E ratio would be the
price of the stock divided by the earnings—$40/$4, or 10 times earnings.
SPREAD TRADING TIPS
If you decide to take advantage of a spread trade, you should realize that it
is a risky business. You could be on the wrong side of both markets. Since
spreading involves selling short one stock and simultaneously buying an-
other stock, if the price goes in the opposite direction of both trades, you
can lose on both sides of the trade. Selling short is a hard concept for many
traders, both novice and experienced, to grasp. Believe it or not, there are
some folks who are not aware that you can sell first without owning the se-
curity. Short selling means you are betting that the price of a given product
will decline; therefore, you would be selling first without owning the un-
derlying product with the hopes of buying back later at a lower price. Sell-
ing short is considered highly speculative for stock traders; the process
involves “borrowing” the stock from the brokerage firm, if the firm has that
security in inventory. Shorting stock is very similar and should not scare in-
vestors. It is a very simple concept; in fact, it is just the opposite for longs.
You want to buy low and then sell out later at a higher price. With shorting,
you are selling first and buying back later, hopefully at a lower price to gen-
erate a profit.
There are certain restrictions; for one, you need to set up a margin ac-
count with your brokerage firm. Another restriction carries potential exe-
cution risks: Due to Securities and Exchange Commission (SEC)
regulations, there is what is known as the “uptick” rule. The uptick rule was
established in the 1930s to prevent a bear market raid on a stock. In order
to execute a trade, the stock needs to trade at a price higher than the pre-
ceding transaction price in the same security. For example, if you wanted
to enter a spread by selling Dell Inc. and buying Apple, you would have
been anticipating or looking for Apple to outperform Dell’s price gains. Or
if both stock prices decline, you would want Dell to decline more than
Apple. But in order to effectively execute that strategy, you would want to
24
CANDLESTICK AND PIVOT POINT TRADING TRIGGERS
c01.qxd 9/24/06 9:48 AM Page 24
enter the sell side of the spread first because there are no restrictions on en-
tering the long side, just on the short side of the transaction. Let’s say you
enter the long side first without confirmation that you were filled on the
short side; if the market on the position you hold—the long side—goes
down and if both markets moved in tandem, you would need an uptick on
the short side in order to be in the spread. Imagine if you went long first and
the stock dropped. Then when you are finally able to execute the short
side, the market has plunged. That would translate into an actual loss. So if
you do not get filled first on the short side, the worst that can happen is that
you lose a trading opportunity. This is a great example of why traders have
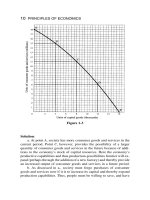
the obligation of knowing all there is about the market they trade in. As you
can see in Figure 1.6, Dell has moved in the same direction as Apple, but
Apple has outperformed as a price leader. The spread opportunity between
these two computer manufacturers, long Apple and short Dell, would have
generated a tidy profit.
Another example of a spread opportunity within competitors of the
same industry or sector would be Best Buy versus Circuit City, as shown in
Trading Vehicles, Stock, ETFs, Futures, and Forex 25
FIGURE 1.6
RealTick graphics used with permission of Townsend Analytics, LTD.
c01.qxd 9/24/06 9:48 AM Page 25
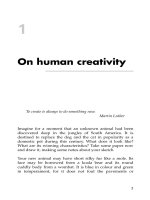
Figure 1.7. As consumers flocked to retail malls before the holidays to pur-
chase gifts such as Apple’s iPods, if you want long Best Buy as the sector
leader and short Circuit City, Best Buy stock outperformed Citcuit City
stock. As you can see from the chart, after the stock market bubble burst in
2000, Best Buy managed to maintain a positive trend higher. It is the lead-
ership of the company and the consumer loyalty that really have helped to
support this company’s growth and profitability. One reason is Best Buy
continued to sell appliances versus one of their rival competitors and as a
result they saw sales rise 7.7 percent from 2004 through 2005. They also had
aggressive gains in web sales, and online revenue jumped 40 percent as
more customers shopped and redeemed gift cards online for the same time
period.
Best Buy’s main competitor, Circuit City, decided or needed to cut back
and close stores and then discontinued selling appliances to stay afloat. It
depended on increasing DVD and CD sales and on electronic products. As
the housing boom materialized soon after that decision, Circuit City gave
up market share to Best Buy; and no doubt companies such as Home Depot
and Sears picked up increased revenues in appliance sales. Therefore, it
26
CANDLESTICK AND PIVOT POINT TRADING TRIGGERS
FIGURE 1.7
RealTick graphics used with permission of Townsend Analytics, LTD.
c01.qxd 9/24/06 9:48 AM Page 26
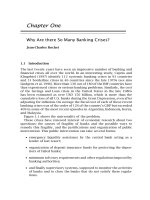
was hard for Circuit City to reenter selling that product line. As you can see
in Figure 1.8, Circuit City’s stock just had not been a great performer in that
sector. The company was founded in 1949, so it has a long history and may
survive the competition. However, if consumers start to spend less on
home electronic products in 2006 and 2007, this company may have trouble
getting its stock price back up to the 2000 high near 65 per share. Circuit
City will need consumers to continue to buy and upgrade new televisions,
camcorders, and digital cameras to boost revenues. I personally have no in-
tentions of buying another camcorder; I barely use the one I have. As for
game software, game hardware, and personal computer software, those are
competitive products; so I believe Circuit City will have to do more to sur-
vive the next few years of what is being forecast as a consumer electronic
sales recession. Therefore, one would need to look closer at these two com-
panies and decide which one has more to gain or which one has more to
lose; once a decision is made, this would be a good pairs market for a
spreading strategy.
Investors have many trading opportunities with stocks, as you can see
Trading Vehicles, Stock, ETFs, Futures, and Forex 27
FIGURE 1.8
RealTick graphics used with permission of Townsend Analytics, LTD.
c01.qxd 9/24/06 9:48 AM Page 27
from the preceding few pages. There are many ways to analyze a company,
from taking a simple look at the P/E ratio to using technical analysis stud-
ies. Investors can see which company is the leader in a specific sector and
invest with that leader. As you can see in the cases of Apple versus Dell and
Best Buy versus Circuit City, holding a diversified portfolio of stocks may
help investors see profits or a positive cash flow. Realistically, you can’t
own shares in every stock. Longer-term investing—you know, the buy-and-
hold mentality, sometimes referred to as the Warren Buffett method—helps
toward generating big gains in solid companies. But remember that World-
Com and even Lucent Technologies were solid companies at one point. So
the message here is that investors need not only to be selective in which
markets they buy and hold but also to monitor their positions. There is the
idea that you can buy stock in a company to which you relate or from which
you purchase products . . . companies like Starbucks, as shown in Figure
1.9. This company has solid growth, great coffee; it carries with each 20-
ounce cup, named a Vente, a solid jolt of caffeine. That is what keeps me
going back, day after day, dropping two dollars per cup for the Starbucks
“experience.” Starbucks has made stellar gains and is a great moneymaking
28
CANDLESTICK AND PIVOT POINT TRADING TRIGGERS
FIGURE 1.9
RealTick graphics used with permission of Townsend Analytics, LTD.
c01.qxd 9/24/06 9:48 AM Page 28
stock. It has solid industry leadership, textbook marketing concepts, and,
more important, customer loyalty. These are all the qualities to look for
when selecting a long-term purchase.
BECOME THE NEXT WARREN BUFFETT
I believe that stocks should be traded as an investment, but there are many
ways to capture a profit. I must say for all investors and for every trader,
you can start your own mutual fund. It requires discipline not only to open
a stock account but also to fund it and add to it every month. If you are a
new investor, just reading this book to see if trading for a living is for you,
it is imperative that you start somewhere and start with a select stock ac-
count first. The discipline is that you should add money in the account
every month, like you are paying a bill. If you are under 30, consider it your
retirement. You are paying your bills in the future now. That is some of the
best advice anyone gave me, and I think it is worthy of passing on to you.
Once you gain more experience, you can separate long-term investing from
short-term speculative trading, which is one form of diversification. After
all, you may see a long period of flat performance in one of your core hold-
ings. Short-term day trading, if you have the time and resources, can be a re-
warding experience. Imagine owning Wal-Mart and for literally seven years
experiencing a loss to a flat performance. Figure 1.10 illustrates the mar-
ket’s sideways move in one of the world’s biggest retail stores.
If you are considering supplementing your investment techniques, one
of the many drawbacks of trading stocks for a short-term day trader with a
small trading account is that you are limited to how many trades you can
make, especially if your account is less than $25,000 and you are not signed
up for a margin account. In that case, you are limited to five round-trip buy-
and-sell trades per week due to SEC rules. So short-term trading would not
be a good consideration for stocks. That is where trading stock index fu-
tures and forex markets takes over, as I will explain in the following pages.
There is one high-risk, high-reward method of trading stocks that I have
not covered yet: getting in on an initial public offering (IPO) stock. Those
investors lucky enough to get in on an IPO like Google (goog), the Chicago
Mercantile Exchange (CME), or even the Chicago Board of Trade (CBOT—
stock, BOT) were able to double, triple, quadruple, or even better, their ini-
tial investment dollars.
The Chicago Board of Trade has been around for over 155 years, and I
imagine it will likely continue to be around for another 155 years, with lit-
tle competition in products traded on its exchange and with the increase in
popularity on the electronics metals products, such as gold and silver, plus
Trading Vehicles, Stock, ETFs, Futures, and Forex 29
c01.qxd 9/24/06 9:48 AM Page 29
the huge volume of trades generated in the grain markets. And with the ac-
tion in the U.S. Treasury notes and bonds and Federal (Fed) funds con-
tracts, the CBOT certainly has a positive longer-term outlook for profitable
revenue growth. Figure 1.11 shows that the price exploded to nearly as
high as 134 but has managed to trade back as low as 86 as of this writing.
The BOT stock illustrates that not all IPOs are guaranteed moneymakers; in
fact, depending on your entry, these offerings can be hazardous to your fi-
nancial well-being. The phrase “invest wisely” means “not putting all your
eggs in one basket.” Find out which is the sector leader, and go with that
stock, unless you like the underdog. In this case, the underdog would be
BOT compared to CME.
As you can see in Figure 1.11, BOT stock initially shot up from the 80s
to a little over 130. At the time I was preparing to write this book, it had not
managed to get back over 130 but traded as high as 119. I do feel that once
the Treasury reinstates issuing the 30-year Treasury bond, volume will in-
crease, which will translate into more revenue for the exchange. There-
fore, the profitability should improve through the next few years. If a
drought scare causes the grain complex to go through the roof, you will see
30
CANDLESTICK AND PIVOT POINT TRADING TRIGGERS
FIGURE 1.10
RealTick graphics used with permission of Townsend Analytics, LTD.
c01.qxd 9/24/06 9:48 AM Page 30
this stock price move like a rocket. Many see the Chicago Board of Trade
mimicking the Chicago Mercantile Exchange success story. As Figure 1.12
shows, in just three short years, CME stock went from under 40 to close to
400 by late November 2005.
The biggest surprise of the three had to be the gains by Google, as
Figure 1.13 shows. After the dot-com implosion in 2001, not many were
willing to experiment with any Internet stock. That mentality may be the
one reason why this stock had such a move, from a contrarian point of
view, that is.
LONG-TERM INVESTING OR SHORT-TERM TRADING
We have briefly covered ways to trade stocks and certain methods to trade
leaders of stocks in certain sectors. Investing carries less stress, fewer day-
to-day decisions, and less risk than trading does; and with that come fewer
rewards. Just as we all have different personalities, there are that many
opinions on how to trade the markets.
Trading Vehicles, Stock, ETFs, Futures, and Forex 31
FIGURE 1.11
RealTick graphics used with permission of Townsend Analytics, LTD.
c01.qxd 9/24/06 9:48 AM Page 31
Some of the keys to successful trading are:
• Diversification. This not only applies to markets, such as a wide as-
sortment of stocks in a portfolio, but also to trading different strategies
and various investment instruments.
• Risk Management. Profitable trading also comes from skills acquired
from practicing discipline, patience, and risk management techniques
that preserve your capital.
• Behavior or Emotions. Successful trading means removing the most
destructive element, negative emotional feelings that plague investors
when trading: fear, greed, and anxiety. Finding the right mixture of in-
vestment products and trading styles can teach you to feel secure when
trading.
The methods we cover in this book can be applied to the topic of se-
lecting stock and spread trading, as we just covered, and to long-term-po-
sition trading, as in the style of trading for which Warren Buffett is famous.
32 CANDLESTICK AND PIVOT POINT TRADING TRIGGERS
FIGURE 1.12
RealTick graphics used with permission of Townsend Analytics, LTD.
c01.qxd 9/24/06 9:48 AM Page 32
EXCHANGE TRADED FUNDS
Exchange traded funds (ETFs) are listed on different exchanges and are
traded on the open market. Choosing this kind of product allows an in-
vestor to select the right sector of performance, rather than pinpointing an
individual stock. The benefits of trading ETFs compared to a mutual fund
are enormous: They allow diversification; they incur more effective trans-
action costs; there is pricing transparency; and they are tax efficient. After
all, it is almost impossible for an individual trader with limited trading re-
sources to effectively track and trade every stock in all sectors of the mar-
ket. ETFs are index-based investment vehicles and are traded as a share of
a single security based on an entire portfolio of stocks. The advantage here
is that the trader can mix the benefits of applying technical analysis and
fundamental analysis to a combination of stock and index trading.
In the most recent development, ETFs have started to include products
related to commodities such as crude oil, gold, and silver; but also they
have expanded into the forex arena by launching a euro currency product.
Trading Vehicles, Stock, ETFs, Futures, and Forex 33
FIGURE 1.13
RealTick graphics used with permission of Townsend Analytics, LTD.
c01.qxd 9/24/06 9:48 AM Page 33
Personalized Mini-Mutual Fund
Instead of agonizing over which stock will outperform in a certain sector,
you can use ETFs as an investment vehicle that has certain stocks in a bas-
ket as one unit, listed as a sector fund. This allows individual investors to
invest in a group of stocks in a sector, rather than relying on a mutual fund
to do it for them. Moreover, many mutual funds charge management fees
and at times do not fully invest all an investor’s cash in the market. Because
ETFs trade like a stock, the price of which fluctuates daily, an ETF does not
have its net asset value (NAV) calculated every day like a mutual fund. By
owning an ETF, you get the diversification of an index fund plus the ability
to sell short, buy on margin, and purchase as little as one share.
Another advantage of an ETF is that the expense ratios for most ETFs
are lower than that of the average mutual fund. When buying and selling
ETFs, you have to pay the same commission to your broker that you’d pay
on any regular order. ETFs allow you to sell without the uptick rule, so you
can short right away, even after the market is in a strong downtrend. You do
not have to wait until the close of the day settlement price as happens in a
mutual fund. Another benefit is the tax consequences because of shielding
from capital gains due to the fact that ETFs do not change holding like a
mutual fund does. So purchasing shares of ETFs is a viable alternative to
investing in mutual funds for individual investors. Keep in mind that many
of the ETFs available today have access to trading options around the ETF.
Therefore, you can develop simple or more complex hedge or spreading
strategies tied around an ETF. There are some negatives, such as the three-
day settlement restriction and a bid/ask spread just like any other market;
but the benefits certainly outweigh the negatives, especially for longer-term
swing and position traders.
The Birth of ETFs
The original ETF was offered to the investing public back in 1993 by the
American Stock Exchange (go to www.amex.com for more listings) and
was known as the SPDRs, which stands for Standard & Poor’s Depositary
Receipts and corresponds with the price movements of the Standard &
Poor’s 500.
The more actively traded and by far more popular ETF came with the
QQQs, which directly correspond with the Nasdaq 100. Then there are the
Diamonds, which move in correlation to the Dow Jones Industrial Average.
ETFs have since expanded, and there is now a new breed of investment ve-
hicles to capture opportunities in sectors known as HOLDRs. These trading
vehicles are based on certain stocks in a certain sector, known as a basket
of diversified stocks in a specific sector.
34
CANDLESTICK AND PIVOT POINT TRADING TRIGGERS
c01.qxd 9/24/06 9:48 AM Page 34
Just as the examples comparing the U.S. Real Estate Trust (IYR) shown
in Figure 1.14 to Toll Brothers, ETFs can offer investors a relationship to
overall sector performance that is better than outright exposure in just one
stock if you are wrong in your investment decision. As we go forward in the
book, I will show you a technical analysis method such as pivot points
using a longer-term time frame and how it can help you determine entry
and exit targets, such as targeting almost the exact high in Toll Brothers, as
well as other stocks.
As you can see in the comparison of the two charts in Figure 1.15, Toll
Brothers took a nasty hit while the Real Estate Investment Trust ETF re-
bounded from the correction.
Looking at a related or similar stock, such as Caterpillar in Figure 1.16,
you would assume that if the construction or housing and real estate mar-
kets could experience a setback due to the 14 interest rate hikes orches-
trated by the Federal Reserve, then a company that manufactures
construction and heavy equipment might suffer a significant correction as
Trading Vehicles, Stock, ETFs, Futures, and Forex 35
FIGURE 1.14
RealTick graphics used with permission of Townsend Analytics, LTD.
c01.qxd 9/24/06 9:48 AM Page 35
well. However, that was not the case, as the chart illustrates. In fact, it is
quite the opposite. So by utilizing an ETF and investing in an overall sector,
an investor has a better chance of gaining a better rate of return. By using
the technical analysis methods that will be covered in this book, an investor
can apply those signals to ETF markets. Keep in mind that options will
eventually be available for most ETFs as well. That will offer investors quite
an edge as far as hedging or protecting against adverse market moves, too.
Hot Sectors, Hot Stocks
In order to take advantage of a hot sector of the market, such as energy,
biotechnology, technology, Internet, brokers, semiconductors, telecom,
and cyclical, to name a few, how would an investor identify the best stocks
in that sector and then narrow it down to one or two stocks and be right?
That is generally the tough part of investing. Trading an ETF or a HOLDR
can help remove that difficulty and may help a longer-term investor achieve
that goal. Moreover, it can also allow an individual to literally trade like a
hedge fund through means of diversified sectors and allow for implement-
36
CANDLESTICK AND PIVOT POINT TRADING TRIGGERS
FIGURE 1.15
RealTick graphics used with permission of Townsend Analytics, LTD.
c01.qxd 9/24/06 9:48 AM Page 36
ing simple to sophisticated trading strategies integrating options as stated
earlier. With market liquidity and market transparency, traders using ETFs
can buy or sell at current market values rather than at assigned market val-
ues based on the close, as is the case when investing in mutual funds. In
fact, some mutual funds may not be fully vested in stocks at a given time.
This means your cash may not be working at 100 percent capacity.
Currency ETFs
This book will also reveal more about the forex markets or foreign cur-
rency trading. And on that subject, there was a new ETF that may appeal to
those who want to participate in currency investing but have neither the
time capacity nor the desire for excessive leverage exposure. Rydex In-
vestments launched the first-ever currency-based exchange-traded prod-
uct back in December 2005.
The Euro Currency Trust (FXE) is an ETF that tracks the price of the
euro, with each share representing about 100 euros plus accrued interest.
Shares of the trust, called “Euro Currency shares,” trade on the New York
Trading Vehicles, Stock, ETFs, Futures, and Forex 37
FIGURE 1.16
RealTick graphics used with permission of Townsend Analytics, LTD.
c01.qxd 9/24/06 9:48 AM Page 37
Stock Exchange (NYSE). The ETF has a 0.4 percent annual fee. Investors
generally pay commissions to buy and sell ETFs, which trade daily on ex-
changes as stocks do. Initially, the trust registered 17 million Euro Cur-
rency shares, for a total offering price of about $2 billion. Shares of the ETF
can be sold short and are eligible for margin, as most ETFs are. Notice the
correlation of price movement in the ETF shown in Figure 1.17 with the
euro FX currency futures contract shown in Figure 1.18.
Granted there is more liquidity in the price of the euro futures contract;
but keep in mind the that the euro ETF was in its third week of trading after
its initial launch date. I suspect that by the time this book is published, the
volume and liquidity will improve dramatically.
Commodity ETFs
Not all ETFs track the price movement of the underlying derivative market
exactly. Take for example the OIH chart shown in Figure 1.19. As you com-
38
CANDLESTICK AND PIVOT POINT TRADING TRIGGERS
FIGURE 1.17
RealTick graphics used with permission of Townsend Analytics, LTD.
c01.qxd 9/24/06 9:48 AM Page 38
FIGURE 1.18
RealTick graphics used with permission of Townsend Analytics, LTD.
FIGURE 1.19
RealTick graphics used with permission of Townsend Analytics, LTD.
39
c01.qxd 9/24/06 9:48 AM Page 39
40 CANDLESTICK AND PIVOT POINT TRADING TRIGGERS
FIGURE 1.20
RealTick graphics used with permission of Townsend Analytics, LTD.
pare moves in the underlying commodity of crude oil, as shown in Figure
1.20, you will see that at times the correlation is not 100 percent exact. In
fact, at times the ETF has actually been a leading price indicator of the un-
derlying commodity price move! Now there is an ETF that is more closely
correlated to crude oil, such as the United States Oil Fund (USO).
The example in Figure 1.21 is streetTRACKS Gold ETF, traded on the
NYSE. It was launched in late 2004; and as of December 2005, when I
started writing this book, it was trading roughly 2.1 million shares a day. It
has attracted $5.65 billion from investors. Each share of the ETF repre-
sents one-tenth of an ounce of gold, which allows mutual funds or private
investors to invest in gold without actually owning the metal. It mirrors or
tracks the price movement of gold almost exactly, as you can see from Fig-
ure 1.21 when compared to the gold futures chart in Figure 1.22.
The objective of the trust is for the value of its shares to reflect at any
given time the price of gold owned by the trust at that time, minus
the trust’s expenses and liabilities. The trust is not actively managed. It re-
ceives gold deposited with it in exchange for the creation of baskets of
iShares. The trust sells gold as necessary to cover the trust’s liabilities, and
c01.qxd 9/24/06 9:48 AM Page 40
41
FIGURE 1.21
RealTick graphics used with permission of Townsend Analytics, LTD.
FIGURE 1.22
RealTick graphics used with permission of Townsend Analytics, LTD.
c01.qxd 9/24/06 9:48 AM Page 41
it delivers gold in exchange for baskets of iShares surrendered to it for re-
demption. The trust is not an investment company registered under the In-
vestment Company Act of 1940 nor a commodity pool for purposes of the
Commodity Exchange Act. This is traded on the American Stock Exchange
(AMEX).
Figure 1.22 shows the CBOT gold minicontract; and as you can see as
you compare the two charts, the price movement in the gold ETF shown in
Figure 1.21 mirrors almost exactly the price movement in the gold futures
contract.
For silver bulls, bears, or spread traders, the newest ETF addition was
the AMEX iShares Silver Trust (SLV). It is a fund based on the daily price of
one ounce of silver as set by the London Bullion Market Association. Those
spread traders buying gold or selling silver now can use ETFs. The key in
showing you the various markets as compared to the ETFs is that you real-
ize that once you identify the opportunity, you then can make a good deci-
sion on which opportunity best presents itself. While futures offer the
leverage, you may want to invest longer term; and an ETF would be right up
your alley without having to pick a gold or silver mining stock. If you are
bullish on precious metals but don’t want to buy the physical metal and if
you have the luxury to trade options, then an ETF would be the right
choice.
It does not go without saying that an outright stock selection can pro-
vide a great return and can at times outperform the sector and even the un-
derlying market. Look at the price move for Newmont Mining in Figure
1.23. This stock took off and never looked back, even when the price of
gold and the gold ETF made a price correction. There are times when that
can happen. Even if you were to purchase long call options, the most prof-
itable rate of return comes from the leverage of an outright long call option
position in a straight up move, such as Newmont experienced. The question
is how many times can that trade and, more important, the timing of such
an event be replicated.
Another advantage of an ETF is the availability and structured use of
iShares. If you are trying to match the most liquid investment vehicle with
a specific sector or group of like stocks, this may be the right investment
choice. IShares are considered to be like an open-ended mutual fund that
reinvests dividends. This investment class is always fully invested in the
market; so when the market moves up and you are long, you would fully
benefit. These index funds also trade just like stocks. Each fund share rep-
resents a proportion of ownership in each stock that makes up the index.
As we have briefly discussed, to make the right choice in an investment and
choose the right stock, you can utilize fundamental analysis, such as earn-
ings per share and market capitalization, to determine what the potential
futures earnings might be. This data can help you determine if the stock is
42
CANDLESTICK AND PIVOT POINT TRADING TRIGGERS
c01.qxd 9/24/06 9:48 AM Page 42
ripe as a buying opportunity or if the price is too high or overvalued and
should be avoided. Considerations that can never be determined are the
hidden demand for a company’s product and the way the company is run,
to see if the profit margins are high or if operating costs and deep discounts
to retailers cut into the company’s bottom line. Therefore, it could be pru-
dent to possibly play the sector through an ETF, which effectively would
eliminate the issue of selecting the wrong stock or the underperformer of
that specific sector.
The Hot Stock
Take, for example, one of the most amazing come-from-behind stories in
2005 and early 2006. Advance Micro Devices (AMD) triumphed, surpassing
Intel’s price level. It would have taken patience and discipline to stick with
this winner; but outperform it did, and what a hot stock it was, as the chart
shows in Figure 1.24!
For a specific ETF or iShare that would list AMD and Intel, you would
look at the iShares Goldman Sachs Semiconductor (IGW) listing. The top 10
Trading Vehicles, Stock, ETFs, Futures, and Forex 43
FIGURE 1.23
RealTick graphics used with permission of Townsend Analytics, LTD.
c01.qxd 9/24/06 9:48 AM Page 43
holdings as of 12/31/2005 were Texas Instruments, Intel, Motorola, Applied
Materials, STMicroelectronics NV, Marvell, Technology Analog Devices,
Broadcom, Advanced Micro Devices, and Maxim Integrated Products.
Intel was a darling among institutional traders and mutual funds, but it
had not performed well, let alone offered enough volatility to day trade or
even swing trade a position. There was just not enough movement in this
stock, as Figure 1.25 shows.
So how was an investor to make money, and how would one possibly
choose to invest in AMD instead of Intel? Actually, once a few simple con-
cepts of identifying market price momentum through candle charts are cov-
ered in the next few chapters, you will see how and why to stick around
when a market goes into a trending phase. Also, once you learn these tech-
niques, it will be pretty easy to help select the right stock. Another simple
investment decision would be to buy the iShares Goldman Sachs Semicon-
ductor ETF! As you can see from Figure 1.26, the semiconductor ETF
moved up. It would have been a far better trade simply being outright long
AMD from under 15 in March 2005, but the torture of watching Intel go
nowhere would have been a reason to buy the semiconductor ETF and
FIGURE 1.24
RealTick graphics used with permission of Townsend Analytics, LTD.
44 CANDLESTICK AND PIVOT POINT TRADING TRIGGERS
c01.qxd 9/24/06 9:48 AM Page 44
45
FIGURE 1.25
RealTick graphics used with permission of Townsend Analytics, LTD.
FIGURE 1.26
RealTick graphics used with permission of Townsend Analytics, LTD.
c01.qxd 9/24/06 9:48 AM Page 45
participate in a profit. The key in using these vehicles is for those who like a
specific sector and do not have unlimited resources to buy a wide spectrum
of stocks. It is also appealing to those who want longer-term trades and who
hold a regular day job and cannot day trade for a living, at least not yet.
Once again, the difficulty of choosing the right stock in a competitive
industry in a specific sector can be overcome; and it may be more profitable
by considering trading an ETF. The previous comparisons of Best Buy and
Circuit City, Dell and Apple, and AMD and Intel all are excellent examples
of how an investor may have a difficult time anticipating which stock out-
performs another in a specific sector. Therefore, for a longer-term stock
trader, ETF investment vehicles could be a solution, helping to boost the
bottom line, and can be added to his or her investment portfolio.
ETFs and some HOLDRs have the greater advantage of trading put and
call options within a prescribed period of time. An investor can even buy
calls such as on the pharmaceutical HOLDRs. Here is a tactic that I have
used before with some success, especially if there are buy signals on sev-
eral individual stocks within a sector. Go ahead and purchase, with a rea-
sonable time until expiration, an in-the-money or close-to-the-money call
option on the HOLDR itself. The pharmaceutical HOLDRs can be traded
based on signals from Abbott, Merck, and Pfizer.
So you can utilize ETFs and their respected relatives and apply several
strategies; also you can use intermarket relationships to determine buy or
sell signals and devise a trading strategy dependent on those signals. Once
you have a good feel for a stock that correlates or links best with an
ETF, then you can use a spread or “pairs” trading strategy or even a hedge
strategy using options. Deciding what is best for your risk capital making,
using an ETF, you no longer need to make a precise pick for a stock in a
specific sector.
In conclusion, trading opportunities exist in these investment vehicles
for all investors; and best of all, they respond quite well using technical
analysis to project support and resistance levels as derived from pivot point
analysis and the momentum techniques that certain candle patterns indi-
cate, which are the specific techniques disclosed in this book. This knowl-
edge should give you, the individual investor, quite an edge in the market!
FUTURES MARKETS: LEVERAGE SYSTEM
We will go over several techniques for helping you identify trading oppor-
tunities in the futures markets. So far we have gone over using exchange
traded funds versus stocks; pairs trading in related stocks; and using
commodities for identifying opportunities in ETFs, such as the oil service
46
CANDLESTICK AND PIVOT POINT TRADING TRIGGERS
c01.qxd 9/24/06 9:48 AM Page 46
HOLDRs (OIH) or the U.S. Oil Fund (USO) versus crude oil futures. The
Euro Currency Trust (FXE) is a more direct move for stock traders playing
the euro currency futures versus the U.S. dollar. Then there is the street-
TRACKS Gold ETF (GLD) compared to the CBOT electronic gold futures
contract, or now a trader can use the iShares Silver Trust to trade against
the physical silver market.
Stock traders can now apply and take advantage of so many commod-
ity markets; but as I mentioned, the futures market is a great investment ve-
hicle to many savvy and financially well-funded traders. Even smaller-sized
traders can benefit from trading the futures market through the responsi-
ble use of the margin system, otherwise referred to as a “good faith de-
posit.” What is a futures contract? It is a legally binding agreement to buy
and sell a commodity or financial instrument sometime in the future at a
price agreed upon at the time a transaction was made. Contracts are stan-
dardized according to delivery points of interest, quality, quantity, and time
of accepting or making a delivery. It is estimated that less than 3 percent of
all transactions actually result in a delivery. In the case of stock index trad-
ing, there is a cash settlement over the value of the contract.
Stock Index Futures
For day or swing traders following the stock market, the futures market
offers an advantage over stocks from tax liability perspective. Always
check with your accountant; but, generally speaking, profits generated in
a futures account are taxed at a rate significantly lower than that for a
stock account.
One confusing aspect and perhaps a drawback for many traders
switching from equities or even forex to trading futures is that there are so
many products with various contract sizes. There is no consistency or
constant in tick value fluctuations or dollar value in the price changes. For
example, the CBOT mini-Dow contract is $5 times the overall Index. When
the Dow was at 10,500, the overall value was 52,500. The margin was set
at $2,600, or just under 5 percent. E-mini–S&Ps are 12.50 per tick (four
ticks per point). If the point value is $50, the overall value of the contract
if the S&P is at 1,200.00 is $60,000. In the currency markets, the euro is
12.50 per tick; the Canadian dollar is 10 per tick; the British pound is 6.25
per point but trades in a minimum two-tick fluctuation. (In my first book
[A Complete Guide to Trading Tactics, Wiley, 2004], I listed all the com-
modities and the contract sizes on pages 8 and 9; please refer to that for a
comparison. Or you can ask your futures broker to provide the listing of
contract specifications.)
The exchanges where the individual futures products are traded set
the margin requirements. Generally speaking, an initial margin requirement
Trading Vehicles, Stock, ETFs, Futures, and Forex 47
c01.qxd 9/24/06 9:48 AM Page 47