Candlestick and pivot point trading triggers setups for stock forex and futures markets 2007 phần 3 ppt
Bạn đang xem bản rút gọn của tài liệu. Xem và tải ngay bản đầy đủ của tài liệu tại đây (1.53 MB, 37 trang )
leverage in the forex markets, positions are normally short-lived. For this
reason, entry and exit points are crucial for success and must be based on
various technical analysis tools. While fundamental analysis focuses on
what should happen, technical analysis is based on what has or is happen-
ing at the current time.
Identifying the overall trend, whether it is short-term or long-term, is
the most fundamental element of trading with technical analysis. A weekly
or monthly chart should be used to identify a longer-term trend, while a
daily or intraday chart must be used for examining the shorter-term trend.
After determining the direction of the market, it is important to identify the
time horizon of potential trades and to apply those strategies to the appro-
priate trend. Therefore, the techniques covered in this book are highly ef-
fective in trading the forex markets.
Technical analysis is the study of historical prices in an attempt to
predict future price movements. There are two basic components on which
technical analysis is based: prices and volume. By having the proper un-
derstanding of how these two components exploit the impact of supply
and demand in the marketplace, with a stronger understanding of how in-
dicators work, especially when combining candle charts and pivot analysis,
you will soon discover a powerful trading method to incorporate in the
forex market.
Long or Short
One of the advantages that the forex market has over equity markets is that
there is no uptick rule, as exists in the stock market, if one wants to take ad-
vantage of a price decline. Short selling in forex is similar to that in the fu-
tures market. By definition, when a trader goes short, he is selling a
currency with the expectation that the price will drop, allowing for a prof-
itable offset. If the market moves against the trader’s position, he will be
forced to buy back the contract at a higher price. The result is a loss on the
trade. There is no limit to how high a currency can go, giving short sellers
an unlimited loss scenario. Theoretically, a short seller is exposed to more
risk than a trader with a long position; however, through the use of stop-
loss orders, traders can mitigate their risk regardless of long or short posi-
tions. It is imperative that traders are well-disciplined and execute
previously planned trades, as opposed to spontaneous trading based on a
“feeling that the price will decline.”
Benefits for Selling Short
There are obvious benefits to short selling. This aspect of the forex market
allows traders to profit from declining markets. The ease of selling con-
60
CANDLESTICK AND PIVOT POINT TRADING TRIGGERS
c01.qxd 9/24/06 9:48 AM Page 60
tracts before buying them first is in contrast to typical stock trading. Mar-
ket prices have a tendency to drop faster than they rise, giving short sellers
an opportunity to capitalize on this phenomenon. Similarly, prices will
often rally gradually with increasing volume. As prices trend toward a peak,
trading volume will typically taper off. This is a signal that many short sell-
ers look for to initiate a trade. When a reversal does occur, there will typi-
cally be more momentum than there was with the corresponding up move.
Volume will increase throughout the sell-off until the prices reach a point at
which sellers begin to back off.
Famous Short Plays
There have been quite a few milestone memories from famous currency
trades, with both short positions and long. For example, famed financier
George Soros “broke” the Bank of England by winning an estimated $10 bil-
lion bet that the British pound would lose value! How about Daimler
Chrysler, the parent company of Chrysler and Mercedes Benz—reportedly
it made more money in the forex markets than it did selling cars! On the
negative side, in early 2005, Warren Buffett announced the U.S. dollar was
in trouble and stated he was heavily short the U.S. currency. That did not
turn out well for him, as the dollar rallied for the most part during all of
2005. What turned the market around? There were many issues—mainly
political, geopolitical, and economic developments—that influenced the
dollar’s value. For starters, many U.S.–based multi-conflomerate corpora-
tions were prompted to bring money back into the United States due to the
Homeland Investment Act (HIA). The HIA is part of 2004 American Jobs
Creation Act and was intended to encourage U.S.–based companies to
bring money back home.
The window of opportunity afforded by the HIA prompted companies
to increase the pace at which funds are repatriated to the United States.
Since companies had only until the end of 2005, many analysts suspected
that companies would rush to repatriate foreign profits by year’s end and
that there would be a high dollar demand to convert foreign currencies.
Don’t forget, during the middle of 2005, there were riots in France. That
contributed to poor market sentiment toward the euro zone, thus giving
ground for a flight to safety, and helped foreign investors switch to buying
U.S. dollars. The tone was essentially dollar-positive and euro-negative,
which is indicative of politics having a negative effect on the euro. Mean-
while, the broader market was also most likely influenced by the high-pro-
file move by Berkshire Hathaway, Inc.’s, Warren Buffett to cut back
speculative positions against the U.S. dollar after losing big on it due to sur-
prising dollar strength.
Mr. Buffett had bet that the dollar would continue losing ground, as it
Trading Vehicles, Stock, ETFs, Futures, and Forex 61
c01.qxd 9/24/06 9:48 AM Page 61
did in 2004, as he felt the massive U.S. current-account deficit would be dol-
lar negative. But instead, monetary policy dictated otherwise as the Federal
Reserve continued to raise interest rates. That was helping to drive demand
as the interest rate differentials widened. In its third-quarter report in 2005,
Berkshire Hathaway said it had cut its foreign-currency exposure to $16.5
billion, down from $21.5 billion in June 2005.
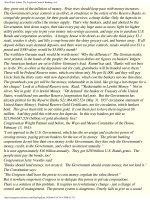
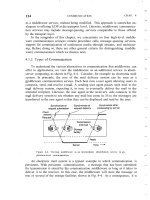
As you can see from the dollar Index weekly chart in Figure 1.34, on a
year-to-year basis, the dollar did make an outstanding run. However, keep
in mind that the dollar was at a high of 120.80 back in 2002; so depending on
where Buffett was shorting the dollar, he could still be in a lucrative posi-
tion. The focus of this story is how shifts in monetary and fiscal policies can
and do dictate price swings in the market, as happened in 2005.
Forex trading is considered the juggernaut in the investment world,
with more than 3.5 trillion in currency trading taking place per day, ac-
cording to the Bank for International Settlements. There is more daily vol-
ume in the forex market than in all of the U.S. stock markets combined.
There is no doubt that that is one reason why foreign currency has become
so popular. Other reasons why forex attracts so many individual investors
62
CANDLESTICK AND PIVOT POINT TRADING TRIGGERS
FIGURE 1.34
Used with permission of esignal.com.
c01.qxd 9/24/06 9:48 AM Page 62
are that the market has liquidity and favorable trading applications, such as
the ability to go long or short a position, and that it trends and trades well,
based off technical analysis studies.
In the past, currency trading was accessible for speculators through the
futures industry when the central marketplace in the banking arena was for
the privileged few. This has all changed now, and the competition is fierce.
The industry has expanded from what was an exclusive club of proprietary
traders and banks to a location where any and all individual traders who
want to participate have access in this 24-hour market from their home or
office computers or laptops.
The forex markets offer traders free commissions, no exchange fees,
on-line access, and plenty of liquidity. Unlike the futures products, the mar-
kets are standardized contract values, meaning a full-size position is
100,000 value across the board. The one main element that attracted in-
vestors is the commission-free trading. Plus, most forex firms require less
capital to initiate a start-up account than a futures account does. In fact, in-
vestors can open accounts on their debit and/or credit cards, and the prac-
tice of accepting payments online through PayPal exists.
Some firms offer smaller-size flexi accounts, allowing traders to start
applying their skills at technical analysis with as little as $500 and trading
ultraminiaccounts with leverage. This feature of what is known as miniac-
counts allows individual investors to adjust their positions by not having
too big a contract value per position; they can add or scale into greater or
lesser positions to adjust the level of leverage according to their account
size. Smaller-size investors are not excluded from trading; they can partic-
ipate with minicontracts. What is great about this feature is that a new
trader or an experienced trader who is testing a new system can trade the
market with real money, rather than simply paper trading, and benefit from
the actual experience of working out execution issues and, more important,
of seeing how they handle the mental or emotional side of trading. Having
real money on the line certainly helps teach people to learn about their
emotional makeup. This is one great way to overcome the fear-and-greed
syndrome that many traders seem to battle. Another excellent quality that
forex miniaccounts have is that traders with low-equity accounts can afford
to trade multiple positions without being exposed to excessive risks like
full-sized positions for scaling out of positions in order to let a portion of
the position ride a profitable position, while capturing profits on a partial
exit. We will go over more on that style of trading later.
What Benefits Do Forex Firms Offer?
Besides offering leverage accounts, other benefits that most forex compa-
nies offer are free real-time news, charts, and quotes with state-of-the-art
Trading Vehicles, Stock, ETFs, Futures, and Forex 63
c01.qxd 9/24/06 9:48 AM Page 63
order-entry platforms; and some even have automated order-entry features
such as one cancels the other and trailing stops. All of these tools and
order-entry platforms come at no additional charge to the trader.
These features may sound too good to be true. With all the benefits
that the forex market offers, most newcomers want to know what the
catch is. There are some slight cost factors that relate to execution;
you pay a premium or a higher spread to buy and a higher spread to
sell. Also, most forex companies take the other side of your trade; you
do not have direct access to the interbank market, as it is called. Since
the forex market is decentralized, it is possible that five different compa-
nies are showing five different prices all at the same time within a few
points (PIPs—percentage in points). Since most forex traders are short-
term in nature, meaning they are quick in-and-out players, day trading
in the forex markets is beneficial for these traders due to the fact that
there are no commissions; but the PIP spreads can and do add up. There
lies the catch.
Buy and Sell the Spread
Forex prices, or quotes, include a “bid” and an “ask” similar to other finan-
cial products. The bid is the price at which a dealer is willing to buy and a
trader can sell a currency; and the ask is the price at which a dealer is will-
ing to sell and a trader can buy a currency. In forex trading, unlike futures
or equities, you have to pay a percentage in price (PIP) spread on entering
a trade. The PIP spread is the point difference between the bid and the ask-
ing price of the spot currency price. This can vary between two and four
PIPs on a euro versus U.S. dollar spread. The spread varies on other cur-
rency pairs and is usually wider on more exotic cross markets, such as the
Canadian dollar versus the Swiss franc.
If you want to hold a position for several days, a rollover process is
necessary. In the spot forex market, all trades must be settled within two
business days at the close of business at 5
P
.
M
. (EST). The only fee in-
volved here is the interest payment on the position of currency held. At
times, depending on the position, a trader can receive an interest payment
as well. This is where the term tomorrow/next (Tom/Next) applies. It
refers to the simultaneous buying and selling of a currency for delivery the
following day.
As with futures, forex markets are now regulated to an extent and
come under the scrutiny of the self-imposed regulators, such as the Na-
tional Futures Association after the CFTC Modernization Act passed in
2002; but since there is no centralized marketplace, many forex dealers can
and do make their own markets, as discussed earlier.
64
CANDLESTICK AND PIVOT POINT TRADING TRIGGERS
c01.qxd 9/24/06 9:48 AM Page 64
Why Trade Spot Forex Markets?
Of all financial instruments traded, forex is believed by many professional
traders and analysts to be one of the best-suited markets to trade based off
technical analysis methods, for a number of reasons. First is its sheer size
in trading volume: According to the Bank for International Settlements, av-
erage daily turnover in traditional foreign exchange markets amounted to
$1.9 trillion in the cash exchange market and another $1.2 trillion per day in
the over-the-counter (OTC) foreign exchange and interest rate derivatives
market as of April 2005. Second, the rate of growth and the number of mar-
ket participants in forex trading have grown some 2,000 percent over the
past three decades, rising from barely $1 billion per day in 1974 to an esti-
mated $2 trillion by 2005. Third, since the market does not have an official
closing time, there is never a backlog or “pool” of client orders parked
overnight that may cause a severe reaction to news stories hitting the mar-
ket at the U.S. Bank opening. This generally reduces the chance for price
gaps. Currencies tend to experience longer-lasting trending market condi-
tions than other markets. These trends can last for months or even years, as
most central banks do not switch interest rate policies every other day.
This makes them ideal markets for trend trading and even breakout sys-
tems traders. This might explain why chart pattern analysis works so well
in forex trading. With such widespread groups playing the game around the
world, crowd behavior plays a large part in currency moves; and it is this
crowd behavior that is the foundation for the myriad of technical analysis
tools and techniques.
Due in part to its size, forex is less volatile than other markets. Lower
volatility equals lower risk. For example, the S&P 500 Index trading range
is between 4 percent and 5 percent daily, while the daily volatility range in
the euro is around 1 percent.
Trading veterans know that markets are interdependent, with some
markets more heavily influenced by certain markets than others. We cov-
ered some of these relationships looking at futures and certain stocks and
how changes in interest rates can move equity markets as well as the cur-
rencies markets. We will learn in coming chapters how to detect hidden yet
repeating patterns that occur between these related markets and how forex
traders can profit from these patterns.
Which Is Bigger—Stocks or Forex?
Forex is by far the largest market in dollar volume, is less volatile, experi-
ences longer and more accentuated price trends, and does not have trading
commissions. Forex is the ideal market for the experienced trader who has
Trading Vehicles, Stock, ETFs, Futures, and Forex 65
c01.qxd 9/24/06 9:48 AM Page 65
paid his or her “trading tuition” in other markets. However, there are no
free lunches. Traders must use all the trading tools at their disposal. The
better these fundamental and technical tools, the greater is their chance for
trading success. While intermarket and other relationships are often com-
plex and difficult to apply effectively, with a little high-tech help, traders
and investors can enjoy the benefits of using them without having to scrap
their existing trading methods.
Forex versus Futures
The futures market through the International Monetary Market (IMM) of
the Chicago Mercantile Exchange has many benefits as well. Some believe
there are tighter spreads between the bid and the asking price, plus there is
no interest charge or rollover fee every other day. In addition, the futures
markets offer options for longer-term traders. There are transactions costs
that apply per round turn; but if the brokerage commission exchange, reg-
ulatory, and transaction charges are less than the PIP spread in forex, an
active speculator would be given a better cost advantage by using the fu-
tures markets instead of the forex spot markets.
Let’s compare a trade in forex to a trade with a similar-size contract
value on the futures exchange, using the example of a euro futures contract
on the CME, where it has a contract size of USD 125,000 worth of euros,
where each PIP would be 12.50 in value. If the commissions and related
fees are on a par with most discount brokerage firms, $20 is your transac-
tion cost per round turn, that is, $10 to buy and $10 to sell out the position.
Keep in mind that the contract value is 25 percent higher than a full-
size forex position, too. If a day trader in forex does a $100,000 full-lot-size
contract and pays three PIPS on every transaction for both the entry and
the exit of each position, this trader would be charged $30 per round-turn
transaction.
The futures arena also has other interesting features and products; one
is the U.S. dollar Index
®
contract traded on the New York Board of Trade,
as was shown in Figure 1.34. That index is computed using a trade-
weighted geometric average of six currencies. It virtually trades around the
clock—the trading hours are from 7
P
.
M
. to 10
P
.
M
., then from 3
A
.
M
. to 8:05
A
.
M
., and then from 8:05
A
.
M
. to 3
P
.
M
. Unlike the forex, there are daily lim-
its on the price movement with 200 ticks above and below the prior day’s
settlement, except during the last 30 minutes of any trading session, when
no limit applies. Should the price reach the limit and remain within 100
ticks of the limit for 15 minutes, then new limits will be established 200
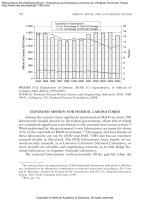
ticks above and below the previous price limit. Figure 1.35 shows a break-
down of the various currencies and their respective weights on the average.
The top four include the euro, which is the heaviest weight at 57.6 percent,
66
CANDLESTICK AND PIVOT POINT TRADING TRIGGERS
c01.qxd 9/24/06 9:48 AM Page 66
followed by the Japanese yen at 13.6 percent, then the British pound at
11.90 percent, and the Canadian dollar at 9.10 percent.
FOREX TRADERS BENEFIT FROM FUTURES
MARKETS INFO
Forex traders can integrate futures data to help in trading decisions, such
as taking a trading signal based on chart patterns in the futures and trans-
lating it into a trading trigger signal in a forex market. Because spot FX and
futures trade in tandem, the price difference is called the basis. Generally,
day-to-day, they are geometrically equal (within a few PIPs). Since, as we
discussed, forex markets are decentralized, there is not a collective data-
base to measure two distinct studies, such as volume and open interest.
These are important tools, so let’s review what the basics are and how a
forex trader can use this futures information.
Volume is the number of trades for the total contract months of a given
future’s contract, both long and short combined. For example, the futures
Trading Vehicles, Stock, ETFs, Futures, and Forex 67
FIGURE 1.35
c01.qxd 9/24/06 9:48 AM Page 67
foreign currency markets trade on quarterly expirations—the March, June,
September, and December contract months. The volume will represent the
total for all the trades in each contract month. Most technical analysts be-
lieve that volume is an indicator of the strength of a market trend. It is also
a relative measure of the dominant behavior of the market. A further ex-
planation is that volume is the measurement of the market’s acceptance or
rejection of price at a specific level and time. There are several theories and
so-called rules when using volume analysis on price charts: First, if a mar-
ket is increasing in price and the volume is increasing, the market is said to
be in a bullish mode and can indicate further price increases. Second, the
exact opposite is true for a declining market. If price is declining and vol-
ume increases, it is said to be in a bearish mode and indicates further price
decreases. However, if a substantial daily market price increase or de-
crease occurs after a long steady uptrend or downtrend, especially on un-
usually high daily volume, the move is considered to be a “blow-off-top or
bottom exhaustion” and can signal a market turning point or a trend rever-
sal. Here are some guidelines to use when using volume analysis.
•Increasing volume in a rising price environment signals excessive
buying pressure and could lead to substantial advances.
• Increasing volume while prices are falling may signal a bear move.
• Decreasing volume while prices are climbing may indicate a plateau
and can be used to predict a reversal.
• Decreasing volume with a weaker price environment shows that
fresh sellers are reluctant to enter the market and could be a sign of a
future downtrend.
• Excessive volume while prices are high indicates that traders are sell-
ing into strength and often creates a price ceiling.
• Excessively low volume while prices are low indicates that traders are
buying on weakness and often creates a floor.
Open interest reveals the total amount of open positions that are out-
standing in existence and not offset or delivered upon. Remember that in
futures trading, this is a zero-sum game so that for every long there is a
short or for every buyer there is a seller. The open interest figure represents
the longs or shorts but not the total of both. So when examining open in-
terest, the theory or general guidelines are that when prices rise and open
interest increases, this reveals that more new longs have entered the mar-
ket and more new money is flowing into the market. This reflects why the
price increases. Of course, the exact opposite is true on a declining market.
Chartists combine both the price movement and the data from volume and
open interest to evaluate the “condition” of the market. If there is a price
increase on strong volume and open interest increases, then this is a signal
68
CANDLESTICK AND PIVOT POINT TRADING TRIGGERS
c01.qxd 9/24/06 9:48 AM Page 68
that there could be a continued trend advance. Of course, the opposite is
true for a bear market when prices decline. Also, if prices increase, volume
stays relatively flat or little changed, and open interest declines, then the
market condition is weakening. This is considered to be a bearish situation
because if open interest is declining and prices are rising, then this shows
that shorts are covering by buying back their positions, rather than new
longs entering the market. That would give a trader a clue that there is a po-
tential trend reversal coming.
Here is a guide as to how to use this information to identify an oppor-
tunity when there is a major top or bottom in the spot forex markets: When
observing a continued long-term trend in a spot forex currency, if it trades
as a futures contract (whether it is in an uptrend or a downtrend), when
prices start to fluctuate with wider than normal daily price swings, or
ranges, or are in an extremely volatile condition, if it is combined with un-
usually strong volume and a decline in open interest, this is referred to as a
climaxing market condition. The market is getting ready to turn or re-
verse the trend.
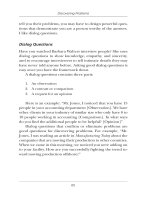
In Figure 1.36, the graph is a split chart of the futures euro currency on
top with the volume and open interest study in the middle. The spot forex
euro currency is on the bottom. Notice that after the peak in prices, the vol-
Trading Vehicles, Stock, ETFs, Futures, and Forex 69
FIGURE 1.36
Used with permission of esignal.com.
c01.qxd 9/24/06 9:48 AM Page 69
ume was increasing, as was the open interest. This was a warning that a
trend reversal was forming, rather than a small correction. Therefore, spot
forex traders would have a better decision-making process, that selling ral-
lies and looking to take sell signals at resistance would be a more fruitful
and profitable course of action.
INSIDER TRADING INFORMATION
There is one more source of information that stock and spot forex cur-
rency traders can borrow from the futures industry. It is the Weekly Com-
modity Futures Trading Commission’s Commitment of Traders (COT)
report. The CFTC market surveillance staff closely monitors trading activ-
ity in the futures markets in order to detect and prevent instances of po-
tential price manipulation. Some consider this “insider trading” information
because every week we get to take a look at which investor group is taking
which side of a trade. (There are many studies and books written on the
subject. In fact, it was covered in my first book on pages 162–165.)
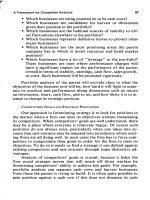
As a futures trader for over 26 years, I have used this information to
capture many significant moves in the markets. Figure 1.37 shows that
70
CANDLESTICK AND PIVOT POINT TRADING TRIGGERS
FIGURE 1.37
c01.qxd 9/24/06 9:48 AM Page 70
there are several categories. The first is the “non-commercial”—all large
professional traders or entities, such as a hedge fund, a commodity trading
advisor, commodity pool operators, and locals on and off the exchange
floors. Any trading entity that hits a reportable position limit (for instance,
in the CME currencies, at the end of 2005, the limit was 400 contracts) is re-
ported by the clearing firm to the exchange, which then turns the informa-
tion over to the CFTC.
The next category is the “commercials”—banks and institutions or
multinational conglomerate corporations looking to hedge a cash position.
The long and short open interest shown as “nonreportable positions” are
derived by subtracting total long and short “reportable positions” from the
total open interest. Accordingly, for nonreportable positions, the number of
traders involved and the commercial/non-commercial classification of each
trader is unknown. This balance of positions is assumed to be the small
speculators. If you look at the first column under non-commercials, you
will see the breakdown of long positions versus short positions. The next
line down shows the changes from the prior week; this is important infor-
mation because you will be able to see if these guys unloaded some of their
positions or added to them from one week to the next. The line under that
tells you the percent of longs and shorts that are held. The last line shows
how many traders there are that control longs or shorts. The information is
gathered as of the close of business every Tuesday by each of the clearing
brokerage firms and is turned over to exchange officials, who then report
the information to the regulatory body know as the CFTC. This information
is released on Friday afternoons at 3:30
P
.
M
. (ET).
It is critical before acting on a decision based on this information to see
if there was a major price swing from Tuesday’s close to the time the in-
formation was released on Friday, because positions may have changed
hands. For example, in Figure 1.37, if the British pound was at 1.7400 at 5
P
.
M
. on Tuesday and the price at Friday’s close was 1.7000, it will indicate
a 400-point move. If the COT showed small speculators net long, I will as-
sume that the speculators were no longer long, as not many small specula-
tors can handle a 400-point loss.
Can traders benefit and make money from this information? The an-
swer is that there is always a chance to make money. The key is to be able
to afford to be not too heavily leveraged if the market moves further than
anticipated. The COT is like an insider information report. It acts like a true
consensus of who literally “owns” the market. A forex trader can use this
data to determine in a long-term trend run if market participants are too
heavily positioned on one side of the market. It is generally the small spec-
ulator who is lefty holding the bag. Let’s face it—money moves the market,
and the banks and large professional traders are a bit savvier when it
comes to their business. After all, one would think a bank has a good idea
Trading Vehicles, Stock, ETFs, Futures, and Forex 71
c01.qxd 9/24/06 9:48 AM Page 71
of what direction interest rates are going to go once a central bank meet-
ing occurs, right?
Suppose the small speculators are showing a nice short position of, say,
at least two longs for every one short. If the non-commercials are net long
and the commercials are net long, chances are that the small speculators
will be wrong. I am looking for imbalances in markets that have been in a
trending market condition for quite some time, and therefore I can develop
a game plan and start looking for timing clues to enter trades accordingly.
Keep in mind that the commercials sometimes are not right; they are not in
the market to time market turns. They are hedging their risk exposure in a
cash position. Therefore the non-commercials, or professional speculators,
in the short term are considered the smart money.
Here are some general guidelines to follow for using the COT Report:
• If non-commercials are net long, commercials are net long, and the
nonreportable positions category is net short by at least a two-to-one
margin, look at buying opportunities. In other words, go with the pros.
• If non-commercials are net short, commercials are net short, and the
nonreportable positions category is net long by at least a two-to-one
margin, look at buying opportunities.
• If non-commercials are net long, commercials are net short, and the
nonreportable positions category is neutral, meaning not heavily net
long or short, look at buying opportunities and stick with the smart
money speculating non-commercials.
WHAT EVENTS MOVE THE CURRENCY MARKETS?
Traders need to be aware of several key elements and events that can cause
currency values to move. For one, intervention plays a role in the curren-
cies. When the Bank of Japan felt that its export business would suffer at
the hand of an overvalued yen, it would intervene and sell yen to buy U.S.
dollars. Countries like Canada and Australia, which produce raw com-
modities, saw a rise in their currency valuations as global demand in-
creased for their goods and as their economies improved as well.
Foreign currency markets are mainly influenced by international trade
flows and investment flows, which are the same factors that influence the
equity and bond markets:
• Economic and political conditions.
• Interest rates, inflation, and political instability.
These factors have a long-term impact, which makes forex attractive
to trade due to the long-term trending conditions established by central
72
CANDLESTICK AND PIVOT POINT TRADING TRIGGERS
c01.qxd 9/24/06 9:48 AM Page 72
bank decisions based on these factors. Forex also offers investors some di-
versification necessary to protect against adverse movements in the equity
and bond markets. Japan is closer to changing its zero-interest rule policy;
and when it does, it may attract money back to Japan and boost its cur-
rency value
STUDY THE “MACRO” ISSUES
Traders who are new to forex can take comfort in knowing that analyzing
and forecasting exchange rate movement rely solely on macroeconomic
factors—the “big picture” issues and concepts for which information is
readily available and intuitively grasped. Once traders have an understand-
ing of the big picture pertaining to an economic region, they can place
trades in the currency market to profit from their analysis. Currency traders
who are looking to capture big moves in exchange rate movement defi-
nitely should focus on three issues when attempting to assess the value of
currencies:
1. Interest Rates—The Carry-Trade Strategy. Each foreign currency has
a central bank that issues an overnight lending rate. This is a prime
gauge of a currency’s value. In recent history, low interest rates have
resulted in the devaluation of a currency. Many analysts assume this is
a function of the carry-trade strategy employed by many hedge funds.
This is a trade where one buys and holds currencies in a high-yielding
interest rate market, such as the United States, and sells or borrows
money from a foreign country where the currency is in a low-yielding
interest rate market, such as Japan. There is a significant risk exposure
to this investment, which requires large capital or a highly leveraged
position from an exchange rate fluctuation.
2. Unemployment Rate. The unemployment rate is a strong indicator of a
country’s economic strength. When unemployment is high, the econ-
omy may be weak and, hence, its currency may fall in value. The oppo-
site is true as well. The question that many economists look to answer
is what a specific country’s full-employment capacity level is. That
knowledge will give clues to the peak in productivity and economic
output. That knowledge also helps determine a country’s capital flows
and, therefore, is good information for currency traders to follow for
longer-term trend identification.
3. Geopolitical Events. Like all markets, the currency market is affected
by what is going on in the world. Key political events around the world
can have a big impact on a country’s economy and on the value of its re-
Trading Vehicles, Stock, ETFs, Futures, and Forex 73
c01.qxd 9/24/06 9:48 AM Page 73
spective currency. Turmoil, strikes, and terrorist attacks, as we have
witnessed in the new millennium, all play havoc with and cause short-
term price shocks in the currency markets. Terms such as “flight to
safety,” as traders move money from one country to another, cause
shifts in currency values. These events need to be monitored by forex
traders as well.
Forex traders use fundamental analysis as described earlier to identify
trading opportunities by analyzing economic information for a longer-term
perspective. Short-term traders should also understand what and when re-
ports can cause a shift in currency markets. Knowing what time is best to
trade the markets will help you nail down when a potential trade may ma-
terialize. As the pie chart in Figure 1.35 showed, the largest percentage
value traded against the U.S. dollar was the euro. Therefore, that would
represent the European session. The central place of foreign currency deal-
ings is London, where the second-most-active trading volume occurs.
Therefore, it is where there are likely to be large range swings in the mar-
ket, granting day traders an opportunity to profit. The European session
runs from 2
A
.
M
. (ET) until 11
A
.
M
. (ET), so a euro currency to U.S. dollar
(EU/USD) or euro currency to British pound (EU/BP) or a British pound to
U.S. dollar (BP/USD) would be an appropriate pair selection to trade.
The U.S. session opens at 8
A
.
M
. (ET), which overlaps the European ses-
sion; and these two sessions combined generate the bulk of trading activity.
Most major U.S. economic reports are released at 8:30
A
.
M
. (ET); and, as ex-
pected, the currency markets generally react off those reports. This offers
traders the opportunity to trade off what is normally a violent price spike.
Once the U.S. markets close at 5
P
.
M
. (ET), the currency markets are avail-
able to trade; but it is not until the Asian session opens at 7
P
.
M
. (ET) that
markets will experience potential price swings. The Australian dollar (AUS)
and Japanese yen (JY) would be what traders would want to focus on, and
the trade opportunities there would be the USD/JY or the USD/AUS or the
cross pair trading the JY/AUS. Notice that the Asian markets overlap the
European session as well, so a Japanese yen versus euro currency cross
(JY/EU) is a popular pair to trade. Here are the time zones a trader wants to
focus on when trading spot forex markets.
• European session—2
A
.
M
. (ET) until 11
A
.
M
. (ET).
• U.S. session—8
A
.
M
. (ET) until 5
P
.
M
. (ET).
• Asian session—7
P
.
M
. (ET) until 4
A
.
M
. (ET).
The prime trading periods for day traders are from 12:30
A
.
M
. (ET) until
5:30
A
.
M
. (ET), from 7
A
.
M
. (ET) until 12
P
.
M
. (ET), and from 1:30
P
.
M
. until 5
74
CANDLESTICK AND PIVOT POINT TRADING TRIGGERS
c01.qxd 9/24/06 9:48 AM Page 74
P
.
M
. (ET). These periods are when peak volumes occur, due to the opening
of the European session and economic reporting times in Europe. Then, as
the U.S. market opens, you have the window of opportunity to trade off the
volatility from the time when U.S. reports are released. In the afternoon of
the U.S. session, volume increases as traders rush to balance their positions
before the end of the day. These are the select times to trade forex markets
(more information can be found at www.fxtriggers.com).
For the most part, day and swing traders use technical analysis to iden-
tify opportunities from specific chart patterns that demonstrate frequent re-
occurring results. They need to trade in active time periods, trading off
trend lines and moving averages, which are a form of trend line analysis
that will help in certain market conditions. We will go over a set of moving
averages that is different from what is normally written about and that will
help identify conditional changes in the market, thereby giving forex
traders a better edge. We will also incorporate and show you how to calcu-
late support and resistance levels from mathematical-based models, such
as pivot point analysis, and other means, such as Fibonacci corrections
and extensions, to identify opportunities and drive trading decisions. These
are the methods I will be covering in this book to help you form a trading
plan based on specific rules and conditions for trading the forex markets.
Trading Vehicles, Stock, ETFs, Futures, and Forex 75
c01.qxd 9/24/06 9:48 AM Page 75
c01.qxd 9/24/06 9:48 AM Page 76
77
CHAPTER 2
Determining
Market Condition
Bullish, Bearish, or Neutral
I
would say the hardest thing for any trader to do is buy high, especially
after seeing a huge run in the market. Buying high is a technique that
very successful professional traders use. It is also a contrarian ap-
proach. After all, if you feel that the value cannot go any higher, it probably
won’t, right? This market condition generally tempts traders to sell. That is
absolutely the wrong thinking! In most bull markets, that thinking falls
under the category of “picking tops without cause,” “justification,” and
“trading based off a set of rules or technical reasons”! Do not try to antici-
pate what the market will do next. Simply go with what the market tells you
it is currently doing. In other words, try to avoid concerning yourself with
why the market is moving; focus on what is occurring. That is my definition
of staying in the now and, most important, staying with the trend.
Forget that last week the market may have taken a nosedive or that yes-
terday the market rallied significantly. Concern yourself with what the mar-
ket is doing now. Ask yourself where prices are in relation to the current
trend. It is up to you to identify the type of trader you are (day trader, swing
trader, long-term trader) and the time frame in which you trade (minutes,
days, weeks, . . .).
For example, a day trader in the mini–stock index futures or the foreign
exchange (forex) markets may only be working with a five-minute time
frame. In that case, she could care less what the market did last week or
yesterday. A day trader may also want to focus on a 60-minute trend to de-
cide whether she should hold the position for two or more periods. A swing
trader, who would hold a position for several days, may want to see what
c02.qxd 9/25/06 8:22 AM Page 77
the trend is doing from a weekly time perspective or from a time interval
based on the past several days. Longer-term position traders may want to
view the trend over several weeks or months. Cracking the code and un-
derstanding how to interpret what the market is telling you is what this
book is about and what it will hopefully teach you.
As a trader, you should recognize the immediate environment or mar-
ket condition. Is it up, down, or sideways? After a trend is established,
let’s say a bullish trend, it should consist of higher highs and higher lows. It
is usually a more fruitful situation to buy dips in that environment, as you
will you get more out of the trade in price magnitude than you will in sell-
ing the rallies. In a bullish environment, buying begets buying. Higher clos-
ing highs more importantly bring higher highs as momentum and assigned
values are justified.
WHAT DEFINES MOMENTUM?
The close is the assigned value for any market. The law of physics that
states “a body in motion tends to stay in motion until a force or obstacle
stops or changes that motion” really applies to this concept, because higher
assigned values can and do usually attract more buying and even new buy-
ers. That is what momentum is and why it is the key in trading. Think of
what an auction is like. There is excitement. People are furiously bidding up
the price of an object. It attracts more buyers. Gosh, it even attracts people
to bid on items they don’t even want. Then as value has peaked, the bidding
dries up; and the last person with the highest bid is awarded the item (or
stuck buying the high). Trading is essentially the same if you know when
it’s the right time or price level to enter the market and what signals to look
for to exit a trade.
There are all kinds of traders, and each one uses different forms of
analysis. What I teach short-term stock, forex, and futures traders is that
there is immediate equal access to the four common denominators that
each and every trade has to work with, without prejudice and exclusivity:
(1) the open, (2) the high, (3) the low, and (4) the close. For stock traders,
there is a fifth element: volume. Fugures traders who are longer term or
who like to confirm the strength or the weakness of a trend should also be
concerned with volume. In futures, unlike in stocks, the volume is not given
to the investing public in realtime intraday. Truthfully, that is why the fu-
tures and forex markets depend on technical analysis to speed the analyti-
cal process to determine a market move on pure price action. After all, it is
how we analyze, interpret, and act on the information that makes us differ-
ent as traders. As for forex, we do not have a means to measure volume as
78
CANDLESTICK AND PIVOT POINT TRADING TRIGGERS
c02.qxd 9/25/06 8:22 AM Page 78
discussed previously. Therefore, it is wise for a forex trader to learn how to
borrow information from the futures markets.
WHAT MAKES A SUCCESSFUL TRADER?
The key elements to making money are this: Successful traders interpret
correctly and act swiftly! Successful traders have the courage to act and act
promptly. I often ask what are the differences between successful traders
and not so successful traders are. I get all kinds of relatively good answers
of why traders fail, mainly due to the fact that folks share their own bad ex-
periences with me. The reason I give for success is very simple: Generally,
a successful trader does not make a habit of consistently buying the high of
a given time period and riding the loss out until it “turns around.” Inversely,
successful traders do not make a habit of consistently selling the low of a
session and riding that loser out. Successful traders have a plan; they follow
the market and go with the flow. After all, that is where the saying, “The
trend is your friend,” came from. So we need to determine the trend. That
is where charts come in handy.
As Figure 2.1 shows, there are but three states the market is in: (1) bull-
ish, or uptrend; (2) bearish, or downtrend; and (3) neutral, sideways, or
Determining Market Condition 79
FIGURE 2.1
Uptrend
Sideways
Downtrend
c02.qxd 9/25/06 8:22 AM Page 79
what is known as a consolidation phase. We can see the current trend or
conditional state that the market is in. What we can’t see is when and by
how much that condition will change. That is one reason why many traders
lose—they anticipate or guess which direction the market will go; they
trade without a plan or set of rules to enter a trade. If you do believe that
the markets are an effective mechanism for reflecting the perceived value
on a given product at a given time, then you need to learn how to follow the
flow of the market. A chart shows the market in its current condition. Until
that condition changes, you need to go with the flow. So what signals
should you look for when conditions change? When the market is in an up-
trend, a simple signal is once the market ceases to increase its assigned
value by establishing not only higher highs and higher lows but, most im-
portant, when a market stops making higher closing highs.
As for a market that is in a downtrend, when different events occur—
such as lower highs, lower lows, or, more important, lower closing lows—
then it is starting to change conditions. If a bearish market or a bullish
market changes conditions, it will most likely go into what is called a con-
solidation or congestion phase. Figure 2.2 shows the market moving from
an uptrend to a congestion phase, or sideways pattern. What we need to do
then is, first, learn how to anticipate or discover what forecasting tool
would help us determine what the potential top of that uptrend would be
and, second, understand what clues to look for once it establishes the top
to help signal us that the trend may resume or that a reversal of the trend
will occur.
80
CANDLESTICK AND PIVOT POINT TRADING TRIGGERS
FIGURE 2.2
Congestion
Uptrend
Resumption or Reversal?
c02.qxd 9/25/06 8:22 AM Page 80
WHERE’S THE CATCH?
As the market starts to trade higher once, it enters a trend phase. Generally
speaking, the market will pause or consolidate before resuming the up-
trend. However, there lies the catch and what substantiates the Random
Walk theory. Not at all times do markets resume an uptrend from the con-
solidation phase. False breakouts and reversals do occur. Most bullish
chart patterns, such as flags, pennants, rising wedges, and ascending trian-
gles, are just an assortment of classical technical continuation patterns that
exist in trends. These work in bar charts and candle charts. The larger pat-
terns tend to give a clue to the next move by forming in the direction of the
trend; the smaller corrective patterns, such as flags and triangles, lean away
from the trend. Sideways channels that form after a bullish trend have a
tendency to support off a past breakout point or an old high.
Figure 2.3 shows weekly chart of Apple Computer; it had an amazing
run after it went out of a period of congestion and blasted off to the upside.
Notice that after the bullish price direction resumed, prices do not make
Determining Market Condition 81
FIGURE 2.3
RealTick graphics used with permission of Townsend Analytics, LTD.
c02.qxd 9/25/06 8:22 AM Page 81
lower closing lows until the second week in December. After that, as you
can see, it did move higher at the start of 2006; but the tweezer top forma-
tion (equal and opposite) contained the rally, and prices ended back where
they started.
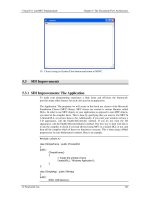
FIND THE CLUES!
From a strict chart-reading perspective, finding the clues as to when a trend
is nearing completion is a matter of watching the relationship of the close
of the time period for which you are trading to past highs and lows. If you
study the chart in Figure 2.3, you will see the first leg or run-up in the mar-
ket from September 2004 until the first lower closing low occurred in
March 2005. The market never made a lower closing low during that time
period. Once it did, the market entered a consolidation phase. That was the
first conditional change. The sequence of higher highs, higher lows, and
higher closing highs stopped; and a new conditional change occurred—the
market made a lower closing low and closed below the open twice in a row.
The chart in Figure 2.4 zooms in on that specific area to help highlight what
occurs when a trend pauses or exhausts itself.
As traders, we are searching for information that will give us clues to an
advantageous entry spot to go long, whether it is at the beginning stages of
a bottom or breaking out of a congestion phase or a sideways channel. De-
termining the market condition, whether it is bullish, bearish, or neutral, is
what will help us in our trading decisions. There are many forms of techni-
cal analysis studies to help us achieve that. The best form of trend analysis
is the simple trend-line approach; you start with the lowest low point and
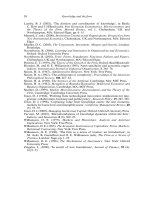
then draw the line up until the next corrective low point. Figure 2.5 demon-
strates the most common way to draw a supporting trend line. After a long
hard crash in IBM, a low was made on 4/17/2005 at 71.85 (the Weekly Pivot
Point S-1 targeted a low of 72.50). Drawing a line from that low and ex-
tending it out to the second reactionary low and extending forward illus-
trated a rising trend. As the market kept bouncing near that support line
(S-1), it advanced higher. Using this form of simple analysis will help you
identify the market’s condition and, therefore, develop a trading plan or
keep you focused to buy breaks.
As for determining a bearish or downward trend, you need to draw a
line from a peak, or top, in the market, as shown in Figure 2.6. You have a
series of lower highs to draw a resistance trend line. Start with the first
peak, extend the line downward to the next high, and then extend the line
forward. This will help you remain focused that the market is bearish, and
therefore you want to focus on selling opportunities.
82
CANDLESTICK AND PIVOT POINT TRADING TRIGGERS
c02.qxd 9/25/06 8:22 AM Page 82
83
FIGURE 2.4
RealTick graphics used with permission of Townsend Analytics, LTD.
FIGURE 2.5
RealTick graphics used with permission of Townsend Analytics, LTD.
c02.qxd 9/25/06 8:22 AM Page 83
As the trend line is drawn from the top and extended down to the next
high, notice that the highs are touching the newly drawn resistance line as
the market pushes away from the trend line. Also notice the sequence of
events that occur. It is the opposite of what we saw in a bull trend: Prices
are making lower highs and lower lows and closing below the opens (as in-
dicated by the dark candles); but more important, prices continually close
below the prior time period’s low. In addition, the downtrend does not end
until late November, when prices reverse these negative conditions. The
conditional changes that occur on the way down reverse at that time with
higher highs, higher lows, higher closes than opens, and, once again, the
most important feature of all, higher closes than a prior period’s high.
BE ON GUARD FOR CHANGES
I must reiterate that no one, no matter what, can foresee the future. There-
fore, you must be aware that changes can and do occur. You must under-
84
CANDLESTICK AND PIVOT POINT TRADING TRIGGERS
FIGURE 2.6
RealTick graphics used with permission of Townsend Analytics, LTD.
c02.qxd 9/25/06 8:22 AM Page 84