Candlestick and pivot point trading triggers setups for stock forex and futures markets 2007 phần 6 ppsx
Bạn đang xem bản rút gọn của tài liệu. Xem và tải ngay bản đầy đủ của tài liệu tại đây (2.15 MB, 37 trang )
range at 1282.25 and after the trigger to exit the trade was initiated at 1288.
This was a 5.75-point gain per contract. The focus is that prices traded
above both moving average values and that the three-period pivot point
moving average acted as support all the way up. Both moving averages
were moving in tandem with each other, and the slope of both averages was
pointing in the direction of the trend.
TRADING TIPS
This is an important point, so let me reiterate—What helps indicate the
strength of a trend when you use two or more sets of values for your mov-
ing averages are:
• The slopes of the moving averages are both pointing in the direction of
the trend.
• The moving averages have a good degree of separation or are equidis-
tant from each other, which indicates a steady trending condition.
• The moving averages are trending in tangent or are parallel with each
other, rather than one significantly outpacing the other.
• If the shorter-term moving average separates or moves too far away
from the longer-term moving average, then there is a potential for an
overbought condition. Traders should start looking to liquidate half of
their positions.
• When a crossover occurs, traders should liquidate the entire position
We have not yet covered candle patterns, an integrating component of
this trading method. Most traders have a basic understanding of candle pat-
terns, and I do go over the more frequent and recurring ones. By now you
may have seen dojis, shooting stars at tops, and hammers at bottoms in this
first section of the book. There is a good reason for that, which we will
cover. Right now, let’s focus on the moving average components.
Figure 6.9 is a 5-minute chart on the CBOT mini-Dow looking at the
same time period as the e-mini–S&P in Figure 6.8. Notice the coincidence
factor as both markets form similar patterns at the same precise moment. I
bring up this point because it is important that as a day trader you follow
like or similar markets to see if there is confirmation throughout the sector.
Besides, if one market rallies, it is likely that the other market will rally as
well. All 30 stocks in the Dow are traded in the S&P 500. Therefore, they
can be considered like, or markets that will trade in tandem with each
other. One market may develop a specific pattern that is more pronounced
than a pattern in the other market, and you can trade one market based on
Pivot Point Moving Average System 171
c06.qxd 9/25/06 8:28 AM Page 171
a signal from the other. Notice in Figure 6.9 that the Dow made a lower low
on that day and was formed by what I call the jackhammer pattern, which
I will cover later.
Watch the relationship of the moving averages. Once the long white
candle formed after the hammer, which is the candle that made the lowest
low point in the market, the tall white candle closed above both moving av-
erage values and above the hammer candle’s high. As prices started to
move in a bullish trend, focus on the action of the moving averages in rela-
tion to prices. The pivot point is above the three-period moving average
pivot point; prices form a sequence of higher highs, higher lows, and higher
closing values above both moving averages and the prior time period’s
highs. This series of conditions continued until after the top was formed by
a shooting star around 10:15
A
.
M
. in conjunction with the mini-S&P. The
trigger to enter a long occurred at 10845 until the first lower closing low, or
conditional change, occurred when prices closed below prior sessions’
lows and below the moving averages at 10895—a nice clean 50-point trade
in the mini-Dow, or $250 per contract in less than 50 minutes.
In Figure 6.10, let’s go over what the 15-minute chart on the spot forex
172
CANDLESTICK AND PIVOT POINT TRADING TRIGGERS
FIGURE 6.9
Used with permission of esignal.com.
c06.qxd 9/25/06 8:28 AM Page 172
yen looks like with the COMAS method. If you look at the candle before 10
A
.
M
., you will see the moving average values actually crossed over first, be-
fore the long white candle formed after 10
A
.
M
. This gives an early warning
and indicates that there is a bullish bias. Keep in mind that it happened be-
fore the price action confirmed a bullish trend with the sequence of higher
highs, higher lows, and higher closing highs. This feature allows you to
have an early warning system in place that helps spot directional trend
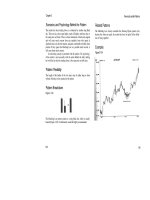
changes. Look at Figure 6.11 with the daily chart on the spot forex British
pound. As you can see, the moving average crossover that occured on No-
vember 25 foretold of the bullish trend reversal that carries the market
from the 1.71 level all the way up to the 1.77 area. In that trend run, you will
see how the moving averages both lined up and acted as support. By the
time December 15 rolled around, see how the moving averages cross back
down, giving you an early warning that the trend was in jeopardy; and sure
enough, a bearish reversal occurred. From the peak made in December, we
see that the market declined, which triggered a sell signal when the pivot
point crossed beneath the three-period moving average. That not only indi-
cated a major bearish reversal but also showed that the three-period pivot
Pivot Point Moving Average System 173
FIGURE 6.10
Used with permission of esignal.com.
c06.qxd 9/25/06 8:28 AM Page 173
point acted as a resistance line all the way down as prices kept in the bear-
ish sequence of lower highs, lower lows, and lower closing lows. There is
one more element to that sequence, which is that a dark candle represents
the market closes below each time period’s open. Keep that in mind when
we go over candle patterns in Chapter 7.
As illustrated in Figure 6.12, the COMAS method can work in helping to
determine changes in market conditions from a consolidating phase to a
bullish uptrending phase and then back to a downtrending, or bearish, con-
dition phase. This graph illustrates a bearish conditional change in the mar-
ket once the pivot point crosses beneath the three-period moving average
pivot point. Once you have identified that a bearish condition exists, then
you can trigger a short position. As a general rule, a trader should look to
sell from an area of resistance in a market that is trending to the downside;
that is, sell rallies. A trader wll see more profits in selling rallies than in buy-
ing breaks in declining or bearish trending markets.
In trading, as in life, timing is everything. There is nothing more frus-
trating to a trader than to correctly analyze the market, correctly predict
the direction of the trend, get stopped out due to a premature entry, and
174
CANDLESTICK AND PIVOT POINT TRADING TRIGGERS
FIGURE 6.11
Used with permission of esignal.com.
c06.qxd 9/25/06 8:28 AM Page 174
then watch the market move in the originally predicted direction. As we all
determine early in our trading careers, being correct about the direction of
the trend is not enough. We must also be able to anticipate when the mar-
ket is setting up to trigger an appropriate entry into the market. The pivot
point combined with a moving average of the pivot point is one method that
can help you successfully identify when a conditional change may occur in
the market.
Let’s look at Figure 6.13, which is a 15-minute chart on the spot forex
British pound. Notice the period after the long white candle at approxi-
mately 9:00
A
.
M
.—prices go in a sideways mode or consolidation phase.
The moving averages also flatline with a bias toward a downward slope.
The crossover occurs, followed by a lower closing low, a lower high, and a
lower low; and the close is below the open. In addition, the price is closing
beneath both moving averages; and, most important, the three-period pivot
point moving average acts as resistance, all the way down, until the market
moves into a consolidating phase.
The concept of incorporating pivot point analysis with a moving aver-
age approach will give you a testable, mechanical, systematic approach to
trading. In order to execute a trade, you need to have specific elements
occur. Knowledge of these elements will arm you with critical information
that can help provide you with protection from overtrading and from suf-
fering from emotional pitfalls.
Pivot Point Moving Average System 175
FIGURE 6.12
c06.qxd 9/25/06 8:28 AM Page 175
1. In order to execute a trade, you need to see a change in market direc-
tion and commitment from the market to illustrate a change in market
direction by closing above or below the moving averages.
2. You need to follow some simple rules, such as take buy signals at sup-
port and take sell signals at resistance.
The importance of this trading method is that you must be able to apply
the techniques on a consistent basis that allows you to make decisions in a
mechanical and nonemotional way. A common mistake that traders make
is that they do not test a strategy to make a logical determination about
whether the strategy is viable for their trading style. Many traders adopt a
new strategy, trade with it immediately, and start tweaking different com-
ponents of the strategy. Then they decide that there is no merit to the strat-
egy, since it is not profitable, and begin looking for a different strategy. A
much better approach is to establish a defined set of trading rules and test
those rules until an outcome is determined based on a reasonable number
of trades. Patience to wait for triggers and not act on the anticipation of an
outcome and discipline to follow through with that trigger are a must if you
are to be successful. These character traits can be learned and developed
176
CANDLESTICK AND PIVOT POINT TRADING TRIGGERS
FIGURE 6.13
Used with permission of esignal.com.
c06.qxd 9/25/06 8:28 AM Page 176
by implementing this methodology. It is what I teach students and other
highly successful professional traders.
When the price target has been met and the trigger has presented itself,
enter the trade without hesitation. Do not think about the entry; this is a
mechanical process. You have already done your homework, and you have
satisfied your criteria. Your system is in place, and this is part of the system.
If you do not place the trade when the trigger executes and confirms, you
are not trading according to your plan. Successful traders have the courage
to act and act promptly. It is important to recognize the immediate envi-
ronment or market condition. Is it up, down, or sideways? After a trend is
established, let’s say a bullish trend, it should consist of higher highs and
higher lows; each period should close above the open, and we should see
higher closing highs. The pivot point moving average should help verify
this condition. In a bearish trend, we would want to see lower highs and
lower lows; each period should close below the open of each period. Under
these circumstances, the pivot point moving average should confirm this
market condition as well.
Traders need to identify themselves, which will help them know the
time frame to follow in a trending market. Are you a day trader? Are you a
swing trader who may be in a position that lasts two to five days? Or are
you a position trader? Once you acknowledge what your time objective is,
you can narrow down your goals and your expectations for the trade. For
example, when I am day trading, I will generally be able to identify what the
average range for a day is; I will expect that if I miss 20 percent of the bot-
tom and 20 percent of the top, while waiting for a moving average crossover
signal, then I can expect to only capture 60 percent of the average daily
range. Perhaps this can be achieved only once or twice a day.
HOW DO I START?
First, I need to structure my computer and my charts to a format that is
conducive to day trading. For stock index contracts, I watch two “like” or
“tandem” markets in two time periods. These are the CBOT mini-Dow and
the e-mini–S&P. Lately, due to client requests, I have been alerted to trad-
ing the Russell 2000 and the German stock index Deutscher Aktien Index,
known as the DAX. The DAX, an index portfolio of 30 German blue-chip
stocks, opens at 3
A
.
M
. (ET) and closes at 11
A
.
M
. (ET). (On a side note, as
of October 2006, the DAX, based in Frankfurt, Germany, will start accept-
ing non-German companies. In order to qualify for the Index, foreign com-
panies must conduct their operations in Germany.) The DAX 30 actually
tracks close to moves in the S&P 500 futures. In spot forex, I use the euro
and a like market, such as the British pound and the yen.
Pivot Point Moving Average System 177
c06.qxd 9/25/06 8:28 AM Page 177
For day trading, I use the 5- and 15-minute time periods. All of my chart
screens look the same: The 5-minute e-mini–S&P and the mini-Dow are on
the top, and the 15-minute S&P and mini-Dow are on the bottom. All my
chart pages are set up this way; therefore, all chart pages are synchronized
so that I do not watch different time periods when switching from one
screen to another—I have a uniform setting.
• I find the most reliable day trade signals are confirmed in the 15-minute
time frame and triggered in the 5-minute time period as well.
• When both time frames are in sync with each other and when like mar-
kets have similar signals, this generates a higher probability trigger.
As I stated earlier, the parameters I use in this book are a variation of
what is programmed in my proprietary library with Genesis Software. This
is a system that generates buy and sell signals based on the principles we
have gone over in the book so far. More information on this software can be
found on my web site at www.nationalfutures.com
Figure 6.14 illustrates how I line up the e-mini–S&P with the mini-Dow
side by side with the corresponding time periods of 5 minutes at the top and
15 minutes at the bottom. Stock and forex charts are lined up the same way.
The greatest feature with this software is that it highlights a sell signal
with a red triangle pointing down, and it signals a buy trigger with a green
triangle pointing up. These coincide against resistance levels to sell and
support levels to buy. As you can see, the sell signals when aligned against
the pivot point resistance numbers offer a fantastic visual confirmation
based on my predefined strategies; therefore, it will help eliminate the emo-
tional element and impatience of acting on anticipation rather than on a
true signal.
All the signals and methods covered in this book can be applied with
most charting packages. In fact, 26 years ago, I was calculating the pivot
point support and resistance numbers with a handheld calculator. The pivot
point calculator is available on my web site. In addition, this book comes
with a CD (compact disc) that has a pivot point calculator as well. All that
needs to be done is to input the data for the high, the low, and the close; and
the R-2 down to the S-2 numbers will be calculated for you. It is very easy
to use; all you need are the prices for stocks, futures, or forex markets for
any time frame. Figure 6.15 shows the monthly price range for Dell Inc.,
which I will use to demonstrate how powerful this method of market analy-
sis is when combined with certain candlestick patterns.
Figure 6.16 is Dell with the monthly and weekly pivot support targets
indicating a possible bottom. Using the higher time frames, such as the
monthly figures, alerted me to a major bottom. All I then needed to do was
178
CANDLESTICK AND PIVOT POINT TRADING TRIGGERS
c06.qxd 9/25/06 8:28 AM Page 178
to look and wait for the reversal trigger, which came when the market made
a high close doji pattern.
The next few chapters will really bring home the message of the value
of incorporating pivot points and candlestick patterns. Using the pivot
point as a moving average in addition to using the pivot point calculations
to identify target ranges will certainly make you a more prepared trader.
This method has captured the attention of many experts who are now
using it; and its accuracy at predicting turning points in the market con-
stantly amazes me. Believe me, many people are fascinated by this concept.
In December 2002, Futures Magazine first published an article I wrote on
the subject, “Combining Cycles and Pivot Points to Predict Market Values”
(p. 38), and has published several other articles of mine. Perry Kaufman, the
famous technician and author, in the fourth edition of his nearly 1,200-page
Pivot Point Moving Average System 179
FIGURE 6.14
Used with permission of www.GenesisFT.com.
c06.qxd 9/25/06 8:28 AM Page 179
180 CANDLESTICK AND PIVOT POINT TRADING TRIGGERS
FIGURE 6.15
Used with permission of www.nationalfutures.com.
c06.qxd 9/25/06 8:28 AM Page 180
New Trading Systems and Methods (Wiley, 2005) quoted my work from
such magazine articles. Many other educators have come to listen to me
teach, have taught my ideas, and have seen improvement in their students.
I have had the opportunity to share my work and research with others, and
I would like to share it with you. These trading ideas are not new, and they
have stood the test of time.
Here is an excerpt from an online interview I had in February 2003 (see
www.nationalfutures.com). The concepts I was talking about then pretty
much cover what we have gone over so far and will continue to cover in the
following chapters. The difference is that I am going over in detail what the
specific signals, settings, and rules are for the trading triggers.
Q: How long have you been involved in the markets?
A: I started in the business back in 1979 as a runner on the floor of the
Chicago Mercantile Exchange [CME]. I then worked for George and Carrie
Lane, the innovator and premier educator for the stochastics oscillator.
Back then, we looked for day trading opportunities in agricultural com-
modities, bonds, and foreign currencies. The best markets that we used
Pivot Point Moving Average System 181
FIGURE 6.16
RealTick graphics used with permission of Townsend Analytics, Ltd.
c06.qxd 9/25/06 8:28 AM Page 181
specifically for quick day trading were in the Swiss franc and the German
deutsche mark. Floor traders used these numbers and kept them to them-
selves as a secret formula for their day trading numbers. These are known
as the pivot point calculations. I started incorporating them in my trading
approach back in 1984 and have been using them ever since.
Q: How do you calculate pivot points?
A: I use the traditional formula. To determine current support/resis-
tance levels, the first step is to find the pivot point [PP] number: PP = (H +
L + C) divided by 3
The first resistance level (R-1) = (PP × 2) – L
The second resistance level (R-2) = PP + H – L
The first support level (S-1) = (PP × 2) – H
The second support level (S-2) = PP – H + L
Q: What time frames do you apply to calculate the pivot points?
A: I find it extremely important to use multiple time frames in my re-
search and analysis. For those who are familiar with the “numbers” from
the pivot point calculations, the idea of applying them from any time period
other than the prior day’s session may make little or no sense. However, I
apply the daily, weekly, and even monthly target numbers and incorporate
these in my traders “tool box.” Often traders will comment, “If I am a day
trader, why would I want to be concerned with a monthly or a weekly mar-
ket outlook?” Consider that in every month, there will be a high and a low,
and the close will be somewhere in between. In one week, a high or a low
will be established; and in one day of the week, the market will form that
point of interest. More often than not, in an hour or so, trades will take
place that will establish that high and subsequently that low!
Q: What are the various time periods in forex markets from which you
take the data to calculate the numbers?
A: For the daily numbers, I take the New York Bank settlement. For
weekly numbers, I use the data beginning from the open on Sunday night to
the close on Friday afternoon. Monthly numbers are calculated by calendar
periods.
Q: What is the main purpose for using the pivot points, and how can
traders use them?
A: One popular application of the pivot point concept is to go long or
cover any short positions at either of the two support levels or to go short
or sell at the projected resistance levels. Knowing these fixed price levels
gives the trader unambiguous points to trade off, to enter, or to exit the
market or, more important at times, where not to enter a position. For ex-
ample, you should not buy right at either of the resistance levels. These lev-
els act as boundaries that can turn back price advances or declines, at least
on the first attempt. Another technique is to trade the breakout of the first
support or resistance levels. If prices do break through the S-1 or R-1 level,
182
CANDLESTICK AND PIVOT POINT TRADING TRIGGERS
c06.qxd 9/25/06 8:28 AM Page 182
traders have a new target at the R-2 or S-2 level to take profits. The benefits
of using the both short- and longer-term pivot points for a short-term day
trader are numerous: They give a trader a better edge due to the ability to
work with predetermined price levels, which lead to precise entry and stop-
loss points, all of which give the trader the additional edge in the quest for
bigger profits.
Q: You use different technical tools in your daily videos. On which ones
do you put more trust or emphasis?
A: Great question! I use stochastics as an overbought/oversold indica-
tor, and I use it to help me determine divergence and convergence signals.
I use three-period variable moving averages to help keep me focused on the
trend. Moving averages also help me identify potential turning points when
the short-term average crosses over or below the longer-term average.
Q: You use candle charts over bar charts. Why is that?
A: Each candle has different characteristics that represent the differ-
ence, or the distance, between the high, the low, the open, and the close.
These characteristics use colors to differentiate the relationship between
the open and the close, referred to as the real body. Candlestick charting
acts as an immediate way to illustrate and to help identify the current mar-
ket’s environment and the current time frame’s acceptance or rejection of
a specific support or resistance level in a clear visual manner. If, for exam-
ple, on a given trading session, prices move higher from the opening price,
establish the high, and then fall, the distance formed from those points of
interest is called the “shadow.”
Candle charts give me color and depth, which help me almost immedi-
ately determine where current prices are in relation to past price levels.
Candlestick charting techniques can be used from data for whatever time
period you are looking at: hourly, daily, weekly, or monthly. There are 60 to
70 different classifications of named candlestick patterns—from one on up
to several candle components. They can signal reversal, stalled, and con-
tinuations of a market’s price move. Day traders want to focus on a small
arsenal of the more consistent and reliable reoccurring formations. Several
patterns that a trader wants to home in on and recognize are the more pow-
erful reversal formations at tops and bottoms of price ranges.
Q: How do candlesticks help you in your trading?
A: My trading approach incorporates time-tested techniques but uses
the aid of candlestick charts, which help me identify the true condition of
the markets. If you believe market prices are simply the reflection of human
emotion on perceived current value and focus on what the market is doing,
rather than on what the market might do, then you are ahead of the crowd
in understand how markets function. With that understanding, you will
then be able to have the confidence to act swiftly and to execute or trigger
into a trade or position in the market.
Pivot Point Moving Average System 183
c06.qxd 9/25/06 8:28 AM Page 183
Q: Which do you favor more—fundamental or technical analysis?
A: I watch what reports are coming out, as some can generate wild gy-
rations (e.g., monthly unemployment report). I rely heavily on technical
analysis. After all, it is the purest and most objective study of price action.
It is used for expedience. You can review one, five, ten, or even twenty
charts in a matter of seconds or minutes to get a quick overview of the gen-
eral trends. How long would it take to study the fundamental reports on the
economy or interest rates in various countries to develop an opinion to buy
or sell a foreign currency? That process could take hours, days, or even
weeks to figure out. Specific chart patterns and price actions have a high
degree of repetition. They are not 100 percent accurate; however, they do
have a high percentage of reoccurrences. Success comes in the simple form
of managing risk when applying a systematic method to these principles
and being able to quickly identify when and why a particular pattern fails.
Q: You learned that certain candle patterns developed near these pivot
points. Which ones do you look for near support or resistance levels?
A: Top reversal or bearish, such as dojis, bearish haramis, harami
crosses, dark cloud covers, and evening star formations. And for bottom re-
versal or bullish candle patterns, I look for bullish haramis, harami crosses,
bullish piercing patterns, bullish engulfing patterns, or, my favorite, a rare
occurring pattern called a morning doji star.
Q: How significant are doji patterns?
A: Extremely significant, especially if you know what to look for. There
are specific criteria that dojis need to meet; but if you know what these are,
they can be very powerful in helping your trading decisions. Doji forma-
tions help confirm reversals. There are different names and nuances asso-
ciated with certain dojis. Dojis indicate indecision, the market ends or
closes, where it began or opened. Dojis signify that confidence is lost from
buyers or sellers after the open as the market made a lot of intraday noise
as the range during the day was established. In a bullish or bearish trending
market, indecision is the last thing you want to see. Strong rejection or fail-
ure from the high and/or the low is a significant telltale sign that changes
are coming.
Q: What other considerations can you share with us regarding dojis?
A: In a strong uptrending market, usually the market will close near a
high, as larger capitalized traders will hold positions overnight. If the large
money traders are not confident the market will move higher in price, then
usually the market closes back near the open. I find it uncanny how many
times dojis form at or very close to the actual pivot point calculated support
or resistance numbers. That is what helps me set up my trades; it is the re-
lation of the next candle’s close after a doji that triggers my entries, espe-
cially if they are lined up at the pivot points.
Q: What is the shortest time frame that you use for charting?
184
CANDLESTICK AND PIVOT POINT TRADING TRIGGERS
c06.qxd 9/25/06 8:28 AM Page 184
A: Five minutes.
Q: What other time frames do you track?
A: Besides monthly, weekly, and daily charts, I use the 5-, the 15-, and
the 30-minute and even the 60-minute for overnight trend trading.
Q: What is your favorite or most reliable time frame?
A: For day trading, the 5- and 15-minute are equally important; so I
watch both.
Q: Do you just use pivot points, or do you use other methods for fore-
casting support and resistance levels?
A: In my book A Complete Guide to Technical Trading Tactics: How
to Profit Using Pivot Points, Candlesticks, and Other Indicators, I demon-
strate many powerful ways to anticipate support and resistance levels, in-
cluding Fibonacci retracement, Fibonacci extensions, and projection
methods. In fact, in my trading course, I teach specific trade setups and
confirm signals to trigger or execute trades, how to manage a trade, and
how to know when to exit or even reverse a position.
Q: What signals or rules do you follow for a trading trigger?
A: Without giving away too many of my trade secrets, there is one that
can be found in my advanced trading course—a special trading setup that I
look for in a bullish setup.
• When the market approaches a key pivot point, buy on the close or
on the next open once a new closing high is made above the previ-
ous bullish reversal candle pattern or a doji.
• Place your initial risk-management stop below the low of the lowest
low point of the bullish candle pattern on a stop-close-only basis.
• Exit the trade on the close or on the first open of a candle that
makes a lower low after a prolonged uptrend, especially if it is near
a pivot line.
• One can use a “filter,” or a back-up process, to confirm the buy sig-
nal against a major pivot point number, such as a bullish conver-
gence stochastic pattern.
Remember, a bullish candle pattern can be a harami, a harami doji
cross, a bullish piercing pattern, a bullish engulfing pattern, a doji, or a
morning doji star.
Q: Tell us about this course and book you have mentioned?
A: The book was published by John Wiley and Sons in May of 2004. I
put the course together based on several seminars I conducted, one of
which was at the Chicago Board of Trade back in May 2003 and then again
in December 2004. I had a huge response from folks who could not attend
but were impressed with my methods. I offer it on my web site, which is
www.nationalfutures.com. Both the book and the course are available on
my site, and I do get asked to autograph and add a personal message when
these are prepurchased from my web site.
Pivot Point Moving Average System 185
c06.qxd 9/25/06 8:28 AM Page 185
c06.qxd 9/25/06 8:28 AM Page 186
187
CHAPTER 7
Candle Charts and
Top Reversal
Patterns
C
andlestick charting is an extremely pronounced and effective
method for tracking and examining the four most important price
points: the open, the high, the low, and the close. Using candlestick
charting helps me visually to better compare current price activity in rela-
tion to past price points of interest. The advantage of using candlestick
charting in place of bar charting is that you can use the same techniques
and analysis that you do with bar charts and have the diversity and unique
signals that candlesticks generate. As you learn this method of charting,
you will come to see how it is a great barometer of human emotion, namely,
fear and greed.
In addition, this is a simple, yet certainly more specialized format of
charting. It has gained in popularity in the United States and is currently
followed by more and more analysts. My first book covered most of
the top formations, and I want to review what I believe are the more fre-
quent and reliable patterns. This chapter will show some statistical evi-
dence that there are certain patterns that develop over and over again.
Candlestick charting is extremely easy to learn; and once you remember
the sequence of events that form a trending market condition, the candles
will certainly be your best tool in spotting market reversals at tops
and bottoms. Having that information will certainly stack the odds in
your favor for making money consistently in the markets as an indepen-
dent trader.
c07.qxd 9/25/06 8:30 AM Page 187
CANDLESTICK CHARTING
Candlestick charting gives a detailed depiction of a price graph with almost
a three-dimensional effect. What stands out most is that a chartist can see
patterns more clearly and distinctly than with other types of charts. There
are over 60 candle patterns that form to create certain setups. This book
will focus on only a few select patterns and, what matters most, the triggers
that initiate a call to action.
If you are not familiar with candlestick formations, I am going over the
foundation of how to construct a candle and what it represents. If you wish
to become an expert at each of the patterns, several authors have written
great books on the subject. One is Steve Nison, who introduced the West-
ern world to candles. (In my first book, on page 44, I wrote about how he
discovered candles.) Others are Steve Bigalow and Greg Morris.
For the expert, this section will be a great review. Since each market
has a different trading characteristic, such as volatility or price moves, cer-
tain candlestick patterns vary and may occur more or less frequently. Each
candlestick pictured has a different characteristic that represents the dif-
ference or the distance between the high, the low, the open, and the close.
Candlestick charting techniques can be used from data for whatever time
period you use: hourly, daily, weekly, or monthly. Candlestick charts lend
themselves to pattern recognition and trendline support, resistance, and
channel lines. Candles also help to corroborate other forms of technical
analysis, especially pivot point analysis.
I want to explain the basics, and then I want to show you specific pat-
terns so you can see for yourself how to utilize them. I will also show a few
examples of the more popular named candle formations. Moreover, I will
explain the psychology of what is behind creating the pattern as it relates to
the open, the high, the low, and the close of a given time period. Armed with
the knowledge of which patterns have a higher frequency of occurring and
with the understanding of what they symbolize, you should be able to trade
the markets from recognizing them; and when patterns do develop, you
should be able to instinctively act on the signals, thereby increasing your
ability to make money as a trader.
The components of a candlestick are derived from the open, the high,
the low, and the close. In Figure 7.1, we see a dark candle (in a color chart-
ing software package, it would be a red candle). This signifies that this par-
ticular time period’s close is below the open. It does not indicate whether
the market closed higher or lower than the previous time period did. The
computer code for this sequence would be C < O—the close is less than the
open. We can also assign a negative (–) value or reading to help determine
the relative strength of a trend.
In Figure 7.2, the white, or hollow, candle signifies that the concluded
188 CANDLESTICK AND PIVOT POINT TRADING TRIGGERS
c07.qxd 9/25/06 8:30 AM Page 188
time period shows that the close is above the open (in a charting software
package, you would universally see this as a green candle). Keep in mind
that you can adjust almost any parameter in any software package to your
liking. Therefore, you may want the candle to be white. The point is that the
color of a “lower close than open” candle should be different from the color
of the “higher close than open” candle. The computer code for this se-
quence would be C > O—the close is greater than the open. We can also as-
sign a positive (+) value or reading to help determine the relative strength
of a trend by how many more positive, or “higher close than open,” candles
exist.
The three main components of candle charts that we need to identify are:
1. Relationship between Open and Close (Candle Bodies). With the real
candle body colored and representing a negative or a positive reading,
we can see what is dominating the market.
In uptrends, or bullish market conditions, we see buying come in
on the open; and as we learned from the stochastics indicator, the mar-
ket should settle closer to the highs. It should also close above the
open; and that is why in bullish market conditions, we see hollow,
white, or green candles. This is why I assign it a positive (+) reading.
How much the bulls are dominating the market is reflected by the
length or the distance between the open and the close. If the market
opens on the low and has a large range where it closes at the high of the
session, that signifies that the bulls are in strong control. However, if
the market has a wide-range session and the market price closes back
Candle Charts and Top Reversal Patterns 189
FIGURE 7.1 Selling or Short FIGURE 7.2 Buying or Long
c07.qxd 9/25/06 8:30 AM Page 189
near where it opened—say, in the middle of the range—that is not a
sign that bulls dominate the market for that particular time period.
In a bearish market condition, or a strong downtrend, we would
see dark- or red-colored real body candles. This represents sellers en-
tering the market on the open and dominating the session right into the
close of that time period. If the market opens on the high and prices de-
cline where the close is at or near the low, this shows that the bears are
firmly in control. This is why I assign a negative (–) reading. The dis-
tance factors between the open and the close are illustrated in a much
more defined way in candle charts than in bar charts due to the shape
and color coordination of the candles.
2. Shadows and Correlations to Candle Body. The distance of a low
and/or a high in relation to the real body as created by the open and the
close can really illustrate the market’s denial of a support or a resis-
tance level. Long shadows, tails, or wicks, as they are called, that form
after a long downtrend indicate a potential that the trend has exhausted
itself and that demand is increasing or supply is dwindling. Shadows,
tails, or wicks formed at the tops of real bodies, especially after a long
price advance, indicate that demand is drying up and supply is increas-
ing. The overall size of shadows is important to watch in relation to a
real body and can be easily identified.
3. Size or Length of the Overall Candle. Now this is one that is hard to
miss using the color-coded method of candle charts. A long candle that
opens at the bottom and closes at the high, which would be an abnor-
mal occurrence, has significant meaning. After a long downtrend, see-
ing this formation indicates that a major trend reversal is taking place.
After a long uptrend, seeing an unusually long candle that closes above
the open (a positive value) would indicate that an exhaustion or blow-
off-top condition may exist.
The reverse is true in down trades. After a long price decline, a tall
red- or dark-colored candle, which represents the market close below
the open (a negative assigned value), may indicate that a capitulation
or an exhaustion bottom has formed. After a long uptrend or price ad-
vance, if that same candle was formed, it might indicate that a major
trend reversal is occurring.
CANDLE FORMATIONS
The candle development will give us immediate identification of the current
market’s environment and the market participant’s acceptance or rejection
or a support or resistance level in a clearly visual manner.
190
CANDLESTICK AND PIVOT POINT TRADING TRIGGERS
c07.qxd 9/25/06 8:30 AM Page 190
The Doji
There is a special candle that has no real body to speak of and is called
the doji. The close of this candle is at exactly the same price as the close.
I generally am a little more lenient with this formation; if after a long range
trading session the close is less than 8 percent of the overall high and low,
I consider it a doji. For example, if the Dow has a 100-point trading range
and the close is within 8 points of the open, I consider it a doji. In curren-
cies, for example, if the British pound had a 150-point range and the market
closed within 12 points of the open, I would consider that a doji formation
(Figure 7.3).
Doji formations help confirm reversals. There are different names and
nuances associated with certain dojis, such as the gravestone, Figure 7.4,
which, when formed after a major downtrend, signals that the trend is near
an end and that slightly lower prices are expected to come. It is similar in
appearance to what is called an inverted hammer at market bottoms or a
shooting star at the top of a prolonged price advance.
The dragonfly, Figure 7.5, resembles another candle pattern with
similar implications, which is a hanging man formation. This candle gen-
Candle Charts and Top Reversal Patterns 191
FIGURE 7.3
FIGURE 7.4
c07.qxd 9/25/06 8:30 AM Page 191
erally develops after a long uptrend and has very bearish implications at
market tops.
Then there is a long-legged, or rickshaw, doji in Figure 7.6. It has an ex-
tremely wide range, which heightens the collective market participant’s in-
decision.
The secret weapon of candlestick charting is knowing the power of
what the doji represents. Dojis indicate indecision—the market ends where
it began. Confidence is lost from buyers or sellers on the open as the mar-
ket made a lot of noise as the range was established. In a bullish or bearish
trending market, indecision is the last thing you want to see. Strong rejec-
tion or failure from the high and/or low is a significant telltale sign that
changes are coming.
We use the phrasing of Sir Isaac Newton’s law in the markets an awful
lot because it really applies to market moves: “A body in motion tends to
stay in motion until a force or obstacle stops or changes that motion.” I be-
lieve and teach that the doji represents that force: It generally stops or
changes the motion or momentum due to the uncertainty or indecision that
is created at peak and troughs.
In a strong uptrending market, usually the market will close near a
high, as larger-capitalized traders will hold positions overnight. If the large-
money traders are not confident the market will move higher in price, then
usually the market closes back near the open. If large-capitalized traders
lose confidence, then it is best to wait before making a trading decision,
right? Well, that is the indecision that forms a doji.
Dojis help form two- and three-candle formations that can develop into
more powerful and trustworthy signals once identified. A few of these for-
mations are morning doji star, the evening doji star, and the bullish and
bearish harami doji crosses, which are discussed later in this chapter.
With each of these patterns, we need to see a specific sequence of events
for these patterns to develop, such as a gap lower open and a gap higher
open than a previous close. Due to the electronic age and 24-hour market
192
CANDLESTICK AND PIVOT POINT TRADING TRIGGERS
FIGURE 7.5 FIGURE 7.6
c07.qxd 9/25/06 8:30 AM Page 192
access, these patterns have several variations. Therefore, I have simplified
my search for what really matters most and concentrated my attention on
certain high-frequency formations.
That is not to say that other patterns are not worth notice, such as the
bullish piercing pattern, the bearish dark cloud cover, the engulfing pat-
terns, the harami, and continuation patterns, such as the rising and falling
three methods. There are many combinations that end up becoming great
“after the fact” type patterns. There are the fry pan pattern, the advancing
soldiers, the towers, the three crows, the separating lines, the tower tops
and bottoms, the belt hold, the counterattack lines, the three river bottoms,
et cetera.
Other Important Candle Patterns
For practical trading application, it is very difficult to program code for
most software trading applications to automatically alert you to a trade sig-
nal based on the exact patterns and sequences of a particular formation. It
is most important that you be able to act on that signal. However, it is pos-
sible to program a few select patterns once you identify what the most fre-
quent and most reliable candle patterns are that reproduce desirable
market reactions or price moves, especially when these patterns occur at or
near the predicted support and resistance levels derived from pivot point
calculations. We have done that in a small sample and a back test, which I
will share with you. First, let me give an overall description of what the sec-
ond-most-important candle patterns are after the dojis and of how to trigger
a trade based on the specific relationship of those patterns to the four com-
mon denominators to which we all have equal access: the opens, the highs,
the lows, and the closes of a respective time period. There is one more ele-
ment that stock traders have, and that is real-time trading volume analysis.
Volume can highlight candle patterns’ significance, such as the hammer
pattern shown in Figure 7.7.
Candle Charts and Top Reversal Patterns 193
FIGURE 7.7
c07.qxd 9/25/06 8:30 AM Page 193
• The hammer indicates that a reversal or a bottom is near in a down-
trend. When a hammer appears at the top of an uptrend, the name
changes to a “hanging man” and indicates that a top is near. There are
three main characteristics that a pattern needs in order to qualify.
1. The real body is at the upper end of the trading range; the color
(white or black) is not important.
2. The lower part, or the “shadow,” should be at least twice the length
of the real body.
3. It should have little or no upper shadow, like a shaved head candle.
After a long decline, if a hammer forms on higher or increased vol-
ume, this adds to the certainty that a capitulation low has occurred.
Hammers can be created both by a closing below the open, which
would be assigned a negative change value (shown in Figure 7.8), and
by a higher close than the open, which would be assigned a positive
change value (shown in Figure 7.9).
194
CANDLESTICK AND PIVOT POINT TRADING TRIGGERS
FIGURE 7.8
FIGURE 7.9
Hammer
Hammer
c07.qxd 9/25/06 8:30 AM Page 194
Candle Charts and Top Reversal Patterns 195
FIGURE 7.10
FIGURE 7.11
• The shooting star is the inverted formation of the hammer and forms at
tops (Figure 7.10). It usually signals a major reversal. The color does
not matter, but the body should be at the lower end of the trading range
with a long shadow. Its significance is that it shows that the market
opened near the low of the day, then had an explosive rally that failed,
and closed back down near the low of the day. Usually there is little or
no lower shadow like a shaven bottom. When it is at the bottom of a
downtrend, it is called an inverted hammer. Figure 7.11 shows a posi-
tive assigned candle, or a higher-close-than-open star. Figure 7.12
shows a negative assigned candle, or a lower-close-than-open star.
c07.qxd 9/25/06 8:30 AM Page 195