Reinventing strategy using strategic learning to create and sustain breakthrough performance phần 4 pot
Bạn đang xem bản rút gọn của tài liệu. Xem và tải ngay bản đầy đủ của tài liệu tại đây (224.46 KB, 29 trang )
Then we had a happy accident. In New Orleans, at a quarterly
meeting of regional executives from around the world, we heard a
Sterling Winthrop customer service expert I’ll call Wendy Smith de-
scribe the strategy she had developed for our Canadian subsidiary. In
Canada, the company had made the needs of retail pharmacists a ma-
jor priority. By assisting them with inventory control and product dis-
play and by providing them with accurate and timely deliveries,
Sterling Winthrop ensured their loyalty. In return, the Canadian phar-
macists enthusiastically supported the company’s marketing drives
and recommended its products to the public. As a result, Sterling
Winthrop was one of the most successful pharmaceutical companies
in Canada.
As we listened to Wendy, John Mansfield and I looked at each
other. We’d been struck by the same thought: There it was, our entry
strategy for Russia, developed in Toronto, transmitted to us in New Or-
leans, and now ready for use in Moscow.
Wendy gave her presentation on a Thursday. By Friday morning
we had convinced her to pack her bags and fly to Moscow, where she
would explain her customer service strategy and help Mansfield’s
team refine it for local conditions.
The fun and suspense in trying out a new strategy is that there
is never just one correct answer that will guarantee success. Busi-
ness, after all, is a game of risk and probability. But after a certain
point we had done as much legwork as time would permit, and now
we had to act.
We outfitted two enormous buses as roving Sterling Winthrop re-
tail stores—complete with displays for Panadol, shampoo, and tooth-
paste—and sent them to visit pharmacies all over Russia. We ran
training seminars and showed the free-market pharmacists how to im-
prove their businesses. And we built a new warehouse and delivery
system to provide them with accurate, on-time deliveries. These were
unheard-of luxuries in Russia.
The result? As we predicted, Russian consumers did indeed rely
on pharmacists for advice. The pharmacists, in turn, were inspired by
Sterling Winthrop’s help in training and equipping them, and they en-
thusiastically recommended Panadol to their customers. Within six
months Panadol had become a leading headache remedy in Russia,
while Johnson & Johnson and Tylenol were nowhere to be seen.
No Substitute for Insight 75
Some months later, we had a good laugh when we met a senior
Johnson & Johnson marketing executive at an industry conference in
Atlanta. Shaking his head ruefully, he asked, “What the hell did you
guys do in Russia? We couldn’t believe it—it seemed like every phar-
macy in the country had a Panadol display in the window!”
Today, looking back at this story, I see that we were unknow-
ingly engaged in the four essential steps of Strategic Learning—
learn, focus, align, and execute—and had discovered the importance
of doing a good situation analysis by asking the right questions.
While the companies that I work with today are grappling with
different issues, they still face the same basic dilemmas we encoun-
tered in Russia. Indeed, many of the lessons of the Panadol launch
have grown only more important with time—above all, the impor-
tance of insight, the wellspring of strategy.
Vision versus Insight
When working with a company, I frequently find that the first thing
executive teams want to do is define a new vision for their company.
It is a common misconception that a firm can simply invent a new di-
rection for itself in a vacuum, express it in a galvanizing vision state-
ment, and implement it the next day. If only life were so simple.
As we discovered in launching Panadol, it is essential to develop
key insights first and then develop a vision statement based on those
insights. (Where a clear and compelling vision already exists, a thor-
ough situation analysis will validate and reinforce it.) A company’s
vision and its strategy are intertwined. A vision statement, after all, is
an extension of a firm’s winning proposition—an aspirational state-
ment of where that winning proposition can take them in the future.
To treat them as separate entities is a serious mistake.
Competing on insight is not just a good idea, it is vital to a
company’s survival. As we’ve seen, divergent learning is at the
heart of successful adaptation. Yet it is a disturbing fact that most
companies do not have a systematic process for generating in-
sight. In today’s fast-moving environment, managers are often
76 WINNING THE BATTLE FOR INSIGHT
TEAMFLY
Team-Fly
®
forced to come up with a strategy on the fly, and they find them-
selves in a mad scramble through a bracken of misperceptions and
half-formed ideas. In an ever more complex world, the need for an
effective process to generate better and faster insights is more
crucial than ever.
In the following pages, we’ll examine how to harness such a
process of divergent learning by doing an effective situation analysis.
The Golden Rules for Situation Analysis
There are three golden rules for doing a situation analysis.
Produce a Diagnosis, Not a Survey
Making a survey is the easiest thing in the world. The only criterion
you need to know is: Leave nothing out. But surveys are useless; all
they do is burden you with a glut of information. A diagnosis, on
the other hand, is a process that allows you to dig beneath the su-
perficial symptoms of a problem and discover its root causes and ul-
timate consequences.
First you should uncover what is strategically important, then
dig deeply into the issues and begin to filter the important from the
unimportant. The understanding you gain in this process will help
you make the most intelligent choices for your business.
Trends Tell a Story; Snapshots Never Do
A wide-angle snapshot of your firm—a statement like “We’re losing
millions of dollars”—gives you only a superficial understanding of
your business. But mapping trends will help reveal the underlying
drivers of this condition.
Every trend tells a story. Whenever you make a significant
finding, map the trend, and tell the story it reveals—for example,
“Our business looks good today. However, operating costs are
rising and revenue is static, which means that we won’t be prof-
itable tomorrow.”
The Golden Rules for Situation Analysis 77
Simplicity Is a Virtue
The more complex the world becomes, the more important simplic-
ity is. But this should not be confused with superficiality. Simplicity
is no shortcut. The reduction of an insight into a clear, distilled, and
meaningful statement is very hard work. Once a company has un-
covered an insight, managers frequently want to take immediate ac-
tion. But this is a mistake. It takes real discipline to say no at this
point, and to keep digging and sharpening and polishing, until your
insight shines like a rare gem—which is precisely what it is.
Searching for the Scoop
A great situation analysis is the result of asking the right questions.
Break the team into small groups and present them with a set
of guiding questions in each of the five categories—customers,
competitors, the firm’s own realities, industry dynamics, and the
broader environment. Later in this chapter, I’ll offer sample guiding
questions that you can use in each category, but the best questions
for your company and industry may be somewhat different from
these. Feel free to revise, subtract, or add questions as needed to
focus on the key issues facing your business today. And you may
also want to allow your working groups to modify the questions
further as they probe for relevant insights. Members of the groups,
drawn from different functions and hierarchical levels in the orga-
nization, should then work together intensively for the next month
to drive out insights in their assigned areas.
Discovering insights takes practice and hard work: There are no
cookie-cutter answers to these penetrating questions. To spur the
teams on, I like to tell them to pretend they are investigative re-
porters hunting for a scoop. They must continue to dig and probe
the issues relentlessly, until they have discovered a handful of supe-
rior insights that could be worthy of front-page headlines.
After a month, the executive team reassembles, and each group
reports on its insights. We debate the pros and cons of each group’s
conclusions and capture common themes. In my experience as a
corporate coach, I’ve noticed that no matter what the company
78 WINNING THE BATTLE FOR INSIGHT
does or who is participating in the situation analysis, the same thing
always happens. After they have considered the issues from every
angle, different groups start pointing at the same short list of key in-
sights. This is a very interesting phenomenon to witness. In this
“Aha!” moment, all of a sudden people begin to make connections
or see answers they had never noticed before. This is when the re-
ally important insights begin to come into focus, allowing the group
to create a consolidated list of well-honed insights. It’s an exciting
moment for any company.
When we launched Panadol in Russia, as you’ll recall, we relent-
lessly asked questions about our product and our new market, and
finally arrived at the following insights:
▼ Despite the rise of modern pharmacies, Russian consumers
will still not self-select their medications. They will continue
to turn to the authority figure in the white lab coat for advice
on what to buy.
▼ The authority figure they turn to is now the free-market phar-
macist. Customer service for the pharmacists is terrible, how-
ever, and few of them understand how to run a retail business.
▼ The way to reach consumers, therefore, is through the phar-
macists. If we provide the pharmacists with superior cus-
tomer service and education, then they will promote Panadol
to the Russian public.
In retrospect, these statements look deceptively simple. The
truth is, each one required a significant amount of hard work—first
to recognize and develop, then to express clearly. Taken together,
they gave us the winning strategy.
How to Do It
The situation analysis probes the following key areas for insights:
▼ Customers.
▼ Competitors.
How to Do It 79
▼ The firm’s own realities.
▼ Industry dynamics.
▼ The broader environment.
The first order of business is to develop a set of questions to ask
within each of these areas. The questions will vary depending on the
industry and the particular issues your company faces. The follow-
ing is a set of guiding questions I typically start with when doing a
situation analysis with an executive team.
Customers
▼ What are the underlying trends affecting our customers’ pref-
erences? How is today different from yesterday, and how will
tomorrow be different from today?
▼ What is the hierarchy of customer needs? (These should in-
clude customers’ hidden needs—those things we must under-
stand before they do.)
▼ How well do we currently serve those needs?
Note how the first question is posed. It doesn’t simply ask,
“What will your customers’ needs be tomorrow?” That’s too big a
question for anyone without a crystal ball to answer. It can be para-
lyzing. The trick is to break the question into parts: First define to-
day; then ask yourself how today is different from yesterday; finally,
ask how tomorrow will be different from today. In the course of this
questioning you will define a trend, and suddenly the larger question
becomes much more manageable.
When discussing the hierarchy of customer needs, the chal-
lenge is to put yourself in your customers’ shoes. First, make an
exhaustive list of all the things you think your customers con-
sider to be important; then prioritize the list in a hierarchy from
most important to least important. This will give you a much
deeper understanding of your customers, and of how you can fill
their needs.
80 WINNING THE BATTLE FOR INSIGHT
Some clients ask, “How do we know if we have come up with
the right hierarchy?” My answer is: Come out of your shell; ask the
people in your organization who deal with customers, and ask your
customers directly. Use whatever means you can—market research,
focus groups, interviews, or informal discussions—to define what is
most important to your customers. That understanding is a critical
input for your strategy.
Many companies—particularly high-tech companies, I’ve no-
ticed—are far more comfortable talking about what they offer rather
than what the customer wants. To make a bad situation worse, they
often speak in the mumbo jumbo of their specialty, which others find
difficult to understand. This is counterproductive. Strategy creation
is an outside-in process, not an inside-out process.
The mantra is: Define the benefit you offer your customers, not
the product you are trying to sell them—and do it so clearly that
even nonexperts in your industry will readily understand.
Theodore Levitt, the Harvard Business School professor who is
one of the most distinguished experts on marketing, reminds us that
“People don’t want a quarter-inch drill; they want quarter-inch
holes.” Your job is to define the solution you’re offering, not simply
the product or service you’re selling.
Nicholas Hayek of Swatch understood this brilliantly. With the
development of quartz technology, accurate timekeeping became a
given. Hayek recognized that an overlooked benefit of quartz
watches was that they could now be a fun, creative, and easily af-
fordable fashion accessory. This was a stunning insight, one that
mattered very much to a lot of people, it turned out. And Hayek saw
it first and understood it better than any of his competitors. Indeed,
he used this simple insight to revolutionize and revive the entire
Swiss watch industry.
“Discovery consists of seeing what everybody has seen and
thinking what nobody has thought,” said Albert Szent-Gyorgyi, a
1937 Nobel laureate in biochemistry. Japanese companies, in par-
ticular, have focused intensely on fulfilling customers’ (unex-
pressed) desires with revolutionary products. They have done this
by empathetically observing the behavior of customers as the ba-
sis for understanding their most important needs. Sony answered
Customers 81
the wish for a small, light, portable music machine with the Walk-
man. Honda gained market share by including cup holders in its
cars. And Yamaha revived the moribund piano market when it pro-
moted electronic keyboards, thereby making a 300-year-old instru-
ment into a fresh and exciting choice for a new generation of
teenage musicians.
The trick, in other words, is to know what your customers want
before the customers themselves do. “Marketing,” Harvard profes-
sor John Deighton has said, “is understanding the behavior of cus-
tomers better than they understand it themselves.”
Competitors
In every competitive arena, including business, you must know your
enemies in order to defeat them. Athletes, for example, carefully
study videotapes and scouting reports to anticipate how their com-
petitors are likely to react under pressure. Armies, politicians, and
even restaurateurs do the same kind of research. To win in busi-
ness, it’s important to understand what game your competitors are
playing, where their strengths and weaknesses lie, and how you can
exploit the situation.
Some guiding questions:
▼ In what distinctive ways are our traditional competitors serv-
ing the market? How does their effectiveness compare with
ours in the eyes of the customer?
▼ Who are our nontraditional competitors, and what unique
benefits are they offering? Who is the most dangerous and
why?
▼ What will be the next big breakthrough in serving customer
needs? Who is most likely to launch it—us or a competitor—
and why?
Never take your eye off the competition, even when they don’t
seem to pose an immediate threat. It’s a principle whose importance
the following story illustrates.
82 WINNING THE BATTLE FOR INSIGHT
Xerox Overlooks the Competition
In 1949 the Haloid Company of Rochester, New York, unveiled a 14-
step process by which one could make a copy of text on paper. By
1965, Haloid had become the Xerox Corporation (xerography is from
the Greek for “dry writing”), a hugely successful company with annual
revenues of $500 million. For years, Xerox dominated the American
photocopier business. The company’s marketing strategy was to em-
phasize how fast its machines were, and its legendary sales force sold
Xerox machines directly to large companies.
In 1975, Canon, a Japanese photocopier maker, was looking for a
way to enter the U.S. market. Deciding not to go head-to-head with
Xerox on its home turf, Canon emphasized the price and quality of its
machines, and sold mostly to individual consumers or small busi-
nesses through retail channels. This proved to be a very successful
strategy, which built up a lot of goodwill for Canon among consumers
(some of whom worked at large companies).
At first Xerox, the behemoth, didn’t pay much attention to the up-
start Canon. But once Canon had achieved a critical mass in sales, it
launched a devastating attack on Xerox’s home turf by selling its own
fast machines directly to large companies. Soon Canon became a ma-
jor force in the photocopier market, on all scales. That was the begin-
ning of Xerox’s slide—including a disastrous reorganization of its sales
force, a shuffle of CEOs, and a free-falling share price—from which
the company has yet to recover.
Beware the danger of falling into the same trap as Xerox. It can be
tempting to dismiss the threat posed by a seemingly insignificant com-
petitor. Avoid underestimating the full implications of what your com-
petitors are up to by thinking through the competitive game several
moves ahead.
In assessing the relative effectiveness of your company in com-
parison to that of the competition, remember: It’s not your opinion
about a competitor that is important, it’s your customers’ opinions
that matter.
In the thick of the business battle, we tend to view competitors
through a distorted lens: Either we dismiss them in an unrealistic way
Competitors 83
(“They’ll never amount to anything”) or we invest them with supernat-
ural powers (“We can’t possibly compete against them in that mar-
ket”). These are extreme but common reactions. Ultimately what
really matters is that we learn to define our competitors through our
customers’ eyes. Just looking at market share is not going to tell you
enough about the competition. You really need to know what
strengths and weaknesses each has, and how you rank in comparison.
Another danger in assessing the competition lies in overlooking
your indirect or nontraditional competitors. Convergence is an in-
creasingly important factor in the new economy, and you must be
aware of who all of your competitors are. This is no longer a simple
question. If you are a telephone company, for example, your indirect
competitors are not only other telecoms, but also TV, Internet, con-
sumer electronic, and computer companies. To protect market share,
you may have to form partnerships or alliances to compete against
these indirect competitors, or even go so far as to acquire them.
Convergence isn’t only a high-tech phenomenon. Unexpected
shifts in more traditional, old-economy industries can pose life-
threatening new competitive dangers to companies that appear to
be unchallenged market leaders.
Blindsided by the Bagel
In the old days, the debate around the conference table at Kellogg’s
headquarters in Battle Creek, Michigan, was whether the market
would trend toward hot or cold cereal. Back and forth went the debate.
Kellogg was a high-performance company, and its cornflakes cereal
was a dominant brand. But then, out of left field came a new breakfast
phenomenon: the bagel.
Traditionally a food favored by Jewish New Yorkers, fresh bagels
require both boiling and baking. They have a short shelf life, and their
manufacture formerly required expensive equipment that only large or-
ganizations could afford. But in the 1960s, Daniel Thompson invented
a small, inexpensive machine for mass-producing high-quality bagels.
Slowly at first, mom-and-pop stores selling fresh-baked bagels began
appearing, and consumers reacted with enthusiasm to this unusual,
chewy treat. The trend accelerated rapidly, and bagels began cutting
84 WINNING THE BATTLE FOR INSIGHT
into Kellogg’s market as a quick, tasty, inexpensive breakfast food.
Kellogg was caught utterly unprepared for such a shift in taste; the
company watched in dismay as sales of cornflakes (and other break-
fast cereals) declined.
In 1996, Kellogg attempted to stave off further losses by buying
Lender’s Bagels, a frozen bagel product sold, like cornflakes, through
supermarket channels, for $455 million. But the cereal maker’s bet on
frozen bagels at a time when freshly made bagels were becoming a
national craze turned out to be another disastrous miscalculation. In-
deed, frozen bagels were the only sector of the bagel market that was
declining. Just three years later, Kellogg sold Lender’s to Aurora
Foods for just $275 million.
But the story doesn’t end there. Now the traditional breakfast food
market has come under attack from yet another indirect source—the ex-
plosive growth of national coffee-shop chains. With stores like Starbucks
on virtually every street corner, busy city dwellers are charging them-
selves up on coffee, bagels, pastries, and muffins as they scurry to the
office or relax on weekends. What does this mean for Kellogg? Consider
this question: Have you ever tried to order cornflakes in a coffee shop?
The lesson? Indirect competitors can change the playing field in
virtually any industry. Sometimes they will operate in areas where it
may be hard for you to engage—just as Kellogg is hard-pressed to
combat the dual menace of the bagel and the coffee shop. The key for
an incumbent company is an early and insightful understanding of the
trends and the newly emerging competitors and an incisive assess-
ment of your strategic options—before you are forced into a defensive
posture with your room to maneuver severely curtailed.
The final competitor question focuses on breakthroughs in serv-
ing customer needs. When coaching executives, I ask them to equate
the breakthroughs made in their industry over time with the break-
throughs made by champion high jumpers—from the scissors to the
straddle to the Fosbury flop. After they have plotted out these break-
throughs, I ask the second and most crucial question: Who will
launch the next big breakthrough, and why? The why ensures that
you avoid too-easy answers and forces you to develop a clear-sighted
view of the challenges you face and their potential consequences.
Competitors 85
The Firm’s Own Realities
When managers look at their own businesses, they have a tendency
to fall into the same traps over and over again:
▼ They look at snapshots of their business, rather than the
deeper trends.
▼ They don’t do a proper variance analysis.
▼ They don’t disaggregate their measures of performance.
In light of this, the following are among the questions a com-
pany needs to ask itself about the state of its business.
▼ What are the five-year trends on our critical performance
measures, and what conclusions can we draw from them?
▼ Where are we making money and where not? (This question
requires disaggregation of profit and cash flow by customer,
product group, and geography.) Are we addressing our losing
propositions?
▼ What are our key strengths that we can leverage for competi-
tive advantage? What are our weaknesses that represent bar-
riers to better performance?
As mentioned before, trends always tell a story, while snapshots
never do. You will get what I call a snapshot view of your business
by comparing your earnings in this quarter to your estimates, or to
your prior year’s earnings. But this tells you very little of use. It’s
much more important to understand the unfolding story—the
deeper trends—of your business.
To really understand where your business is headed, track the
four to six key elements of your business performance over the past
five years. Be selective; don’t try to measure everything. Then, when
your latest quarterly results are reported, add the key results to the
historical trend and look carefully at how the trend is developing.
Executives can become so focused on the current fiscal year
86 WINNING THE BATTLE FOR INSIGHT
TEAMFLY
Team-Fly
®
that often the results of this kind of long-term analysis take them by
surprise. Countless times I’ve heard managers say something like:
“Wow, I never realized that our gross margin has dropped four per-
centage points over the past five years—that’s $12 million in prof-
its!” If you don’t fully understand the underlying trends in your
business, you could be on your way to becoming a boiled frog, as
described in Chapter 1.
Beyond Snapshots to Trends
In 1979, I was made the managing director of Van den Berghs UK, a
Unilever foods subsidiary that controlled 60 percent of the British mar-
garine market. This large business had achieved success after suc-
cess over many years, and had become a typical fat cat: proud,
profitable, and averse to change. As part of a briefing to me, the chief
financial officer, Peter Burnett, did a five-year trend analysis of the key
elements in our profit-and-loss (P&L) statement.
What the CFO’s graph showed was that Van den Berghs’ revenue
growth was gradually slowing, gross margin ratios were static, and—
most ominously—overhead costs were climbing slowly but relent-
lessly. In other words, the company was profitable at the moment but
its underlying trends were unhealthy.
Peter and I then decided to address the following question: “If
nothing changes in our business in the foreseeable future, what will
the trends look like?”
A week later, Peter came into my office, looking grim. He had ex-
tended Van den Berghs’ existing trend lines 10 years ahead, and the
conclusions were sobering, to say the least.
“If these trends continue as is, our business will be in loss within
seven years,” he said. “I never realized it.”
At the next executive committee meeting, we pinned the graph to
the wall without saying a word. The eight executives stared at it for a
while in silence. Finally, the head of operations, a blunt-speaking York-
shireman, said what was on everyone’s mind: “Why the hell aren’t we
doing something about this?!”
Why, indeed? We got right to work.
The Firm’s Own Realities 87
Executives are always in search of a useful analytical tool to
help them monitor their business, especially one that will tell them
where they are making or losing money, and why. In fact, such a
tool exists. It is called a variance analysis, and it is a form of man-
agement accounting that, unlike the statutory accounting format re-
quired by law, allows you to delve deeply into the reality of your
business and to see the truth in the numbers.
For some reason, many companies are either unaware of this
tool or don’t know how to use it. When CFOs want to review a
company’s recent performance, they often dish up a virtual forest
of numbers that acts as a barrier to clear thinking. At board meet-
ings, for instance, board members are given a “board book” with
every number possible thrown into it—columns upon columns of
detailed figures—and it then becomes an intellectual sparring game
to see who around the table can make the best sense of it. What a
waste of time!
A big mistake is to confuse a variance analysis with a reconcilia-
tion statement. When managers are asked to compare today’s profit
with that of five years ago, the response is often to work their way
through the P&L, from the revenue downward, comparing each line
item and then showing either a plus or a minus for the five-year pe-
riod. This is a reconciliation statement, and unfortunately it is
nearly useless. All it really does is to provide you with another view
of the trees rather than a real map of the forest.
A variance analysis starts at the bottom of the P&L, not the top,
and aims to diagnose the causes of shifts in profit. For example,
just explaining profit decline in terms of revenue drop is meaning-
less: Revenue can fall for three main reasons—volume, price, or the
mix of products sold. To be useful, we need to understand which of
these factors led to the decline. Similarly, gross margins can fall be-
cause of either price or costs. Again, we need to diagnose the true
reasons for the decline.
There is real skill and discipline involved in doing a proper vari-
ance analysis. The technique is to examine each potential cause of
the profit shift in turn, while holding the other variables constant.
This approach cuts through the clutter and tells you simply and
clearly what the three to five key factors are that caused your profit
88 WINNING THE BATTLE FOR INSIGHT
to rise or fall. This key diagnostic information should fit on one
page—as opposed to the encyclopedias of information with which
companies try to manage themselves. As always, the pursuit of clar-
ity and simplicity will lead you to the truth.
When a company does a variance analysis for the first time,
there is often a moment of revelation when the people involved say,
“I never knew that before.”
To show how a variance analysis works in practice, let’s take a
look at the case of an Italian beverage company (the details of this
story have been altered out of respect for confidentiality).
Vanishing Margins at Limonata
The company—let’s call it Limonata—had had a lock on its key sup-
plies—fruit juices and teas, mostly—for over a dozen years, and its
brand had thrived across Western Europe. By the early 1990s, its
business had grown to over a billion dollars. Without significant com-
petition, however, Limonata grew complacent. It failed to innovate, or
even to advertise very much. Then a new competitor appeared—let’s
call it L’Orange—and rapidly gained market share with a trendy new
beverage modeled on America’s AriZona iced tea. Within three years,
Limonata’s profits had plunged by $60 million.
The company’s many stakeholders began to bicker in search of an-
swers. They decided that price was a major issue and were about to “go
to war” with a turnaround plan, when they sought strategic advice.
“Sixty million dollars is a lot of profit to lose in only three years,” I
said to Marco, Limonata’s CEO. “Where did it all go?”
“My estimate is that we lost about half our profit, $30 million, to vol-
ume decline,” he replied, “and the other half to a margin squeeze—
there was an oversupply of juice on the market, which forced down
prices and shrank our margins.” The CFO offered a similar point of view.
Marco and the CFO seemed confident about their estimate of the
reasons for Limonata’s losses. But to validate this assessment, we de-
cided to do a variance analysis of the company’s profit decline. The
comparison of Limonata’s numbers in 1997, its last healthy year, to
those of 2000 provided an analysis that revealed a very different story
than the one Marco and his CFO had believed to be true.
The Firm’s Own Realities 89
Limonata Variance Analysis
1997 operating profit: $88 million
2000 operating profit: 28 million
Profit variance: ($60 million)
Sources of Profit Variance
Volume: ($98 million)
Advertising and promotion: (10 million)
Price: (11 million)
Cost savings: 59 million
Profit variance: ($60 million)
These figures were the outcome of a root cause analysis designed
to isolate those few key things that were causing the decrease in prof-
its. (Decreases are shown in parentheses.) Often the real reasons
catch people by surprise—as they did in this case.
The Limonata analysis shows a negative volume variance of a
whopping $98 million and a negative price variance of only $11 mil-
lion. This was a huge revelation, one that showed Limonata didn’t
really understand the root cause of its problems. And they’d over-
looked entirely the positive variance from cost savings, which meant
the problem was much worse than they’d imagined. The company’s
losses were overwhelmingly due to a loss of volume—the result of a
collapse in brand performance—and had little to do with margin
squeeze.
“It seems we were about to embark on a major turnaround based
on a false assumption,” Marco said. “That could have been disas-
trous. To remain competitive, we must focus our energy on turning the
brand around.”
Let’s examine Limonata’s volume problem a little further. The stark
fact was that if it had simply held its volume constant over those three
years, it would have had $98 million more in profit than it actually
showed in 2000. But those numbers would still have been unaccept-
able. Why? Because if volume had remained static in a growing mar-
ket, Limonata would actually have been losing market share.
If Limonata had simply maintained market share from 1997 to
90 WINNING THE BATTLE FOR INSIGHT
2000, it would have made an additional $14 million in profits—thus giv-
ing a total of $112 million more than the 2000 actual profit.
Within a $60 million adverse profit variance, Limonata’s real prob-
lem had remained hidden: a brand performance problem that
amounted to $112 million, not the $30 million Marco thought. As it
turned out, pricing, Limonata’s original bogeyman, was an insignificant
factor—only $11 million.
This is a dramatic example of how easy it is for companies to mis-
understand the trends affecting their businesses. The surprising thing,
of course, is that Limonata had not done a variance analysis before.
But Limonata’s experience is by no means uncommon, and it under-
scores the importance of using variance analyses to discover the
truths hidden in your numbers.
The next story highlights the importance of disaggregation.
Most accounting systems tend to measure things in the aggregate.
Yet, to understand where your company is making or losing
money, it is essential to disaggregate profitability—by customer,
products, assets, and/or geography. Such a disaggregation will
provide you with a realistic assessment of where the real
issues lie.
A Glass House at Tropicana
When I became the CEO of Tropicana in 1990, the company’s return
on assets (ROA) was just above 20 percent. That wasn’t a bad num-
ber, but we felt it could be improved. Making and storing not-from-con-
centrate orange juice is an asset-intensive business, and so we began
to look for ways to maximize our ROA. I asked Steve Schechtman, a
senior financial planner, to tackle the project. Steve’s approach was an
object lesson for all of us.
Instead of looking at the total ROA for all of our assets (an aver-
age), Steve looked at each major asset separately to see how prof-
itable it was on a stand-alone basis. That is, he treated our major
assets as if they were independent entities charging us market prices
The Firm’s Own Realities 91
for their services; in doing this, he enabled us to see clearly the profits
and ROA of each asset.
This analysis proved very revealing. Within our huge plant in
Bradenton, Florida, we had a large glass plant—the fourth-largest
glass plant in the country, in fact—which produced the glass bottles
for our juices. The plant was so deeply embedded in our daily busi-
ness that it was easily overlooked as an independent asset. When
we disaggregated the assets, however, we discovered the glass
plant was underperforming and dragging down the rest of Tropi-
cana’s numbers.
We quickly entered into a joint venture with a third-party glass
manufacturer, which substantially raised the ROA of the glass plant.
Because the plant was a significant part of the company’s total
asset base, this provided a substantial improvement in our over-
all returns.
The important point is that one cannot manage averages. Disag-
gregation is the key to any profit improvement plan.
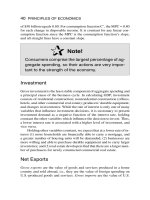
Another powerful technique for separating winners from losers
in your portfolio of businesses involves applying what is commonly
called the 80/20 rule. The chart in Figure 5.2 shows how to apply the
rule to your profits.
In the right-hand column, list your most profitable product cate-
gories in descending order, while indicating the percentage of profit
accounted for. Draw a horizontal line under the list when you have
accounted for 80 percent of your total profit. Now, under the line,
list the product categories that account for the remaining 20 per-
cent of your profit.
Quite often, you will find that something like 20 percent of your
firm’s products or customers contribute 80 percent of your profits,
and vice versa—hence the 80/20 rule. The 80 percent of products or
customers that contribute only 20 percent of profits generally rep-
resent a huge misappropriation of resources, and should be ad-
dressed aggressively.
The 80/20 analysis gives you the ability to identify and weed out
your marginally profitable or loss-making products, customers, or
92 WINNING THE BATTLE FOR INSIGHT
business units, and apply your scarce time and resources to improv-
ing the businesses that are most profitable.
Trimming the Seagram’s Portfolio
In 1988, when I arrived as the new CEO at Seagram’s U.S. spirits busi-
ness, I learned that the company’s profits had been drifting steadily
downward over the previous four years. My team did an 80/20 analysis
of the company’s long list of products. It revealed that a number of un-
derperforming secondary brands were responsible for the decline and
were using up a disproportionate amount of time and resources.
This was a difficult moment. Each of those laggardly brands had a
history with the company, and their internal champions found every
reason under the sun to keep them. But these appeals were based on
The Firm’s Own Realities 93
20%
80%
Profit
Product Categories
Figure 5.2 Profit Concentration Map
sentimental attachments, not hard business sense. Ultimately, we
made the decision to bite the bullet and sell off 37 brands.
This streamlined our portfolio and had an immediate impact on the
profits and market share of our remaining premium brands. By 1992,
Seagram’s spirits business excluding the secondary brands had real-
ized a 36 percent increase in profits over what it had generated when it
included those secondary brands in 1988. The turnaround really
stemmed from our 80/20 analysis, which showed where we were mak-
ing money and where we were spinning our wheels. Above all, it al-
lowed us to focus where it really counted.
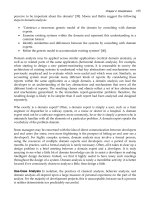
Another useful technique is the Portfolio Profitability Map, a
matrix that classifies the profitability of various products or busi-
ness segments. Versions have been developed by companies like
the Boston Consulting Group (BCG) and McKinsey & Company,
but the simplified version I like to use is similar to the approach
of my colleague at Columbia Business School, Larry Selden. It in-
corporates the language developed by BCG, and it appears in Fig-
ure 5.3. (Note that this figure assumes that we are dealing with a
94 WINNING THE BATTLE FOR INSIGHT
High
Low
Revenue
Growth
Low High
Return on Assets
CASH USERS
DOGS
STARS
CASH COWS
Figure 5.3 Portfolio Profitability Map
manufacturing company. For service companies, I suggest that
the horizontal axis show gross margin percentage rather than re-
turn on assets.)
Those products that fall into the upper left-hand quadrant (i.e.,
high revenue growth but low ROA) are typically “cash users.” Ide-
ally, you want to move these products or businesses over into the
top right-hand quadrant, which is the truly profitable box. These are
the “stars” in your company’s portfolio. Because of product life cy-
cles and changing consumer tastes, stars shift over time into the
bottom right-hand box, where they become steadily earning “cash
cows” in their mature years. The aim, of course, should be to use
the cash cows to generate new products to replenish the top left
quadrant, and to shift those cash users to the top right quadrant, the
stars. What often happens, however, is the development of an em-
barrassingly long list in the bottom left corner, popularly known as
“dogs.” Think of your dogs as something like the junk most people
accumulate in their attics—except that the dogs waste money and
other resources, not just storage space.
A good rule of thumb is that products or business units that are
stuck in the lower left quadrant—the dog house—for three or more
years must be addressed. The options are limited: close, fix, or sell
these product lines.
(The rare exception to this rule is when there is a clear and
compelling reason to maintain a loss maker, such as when a dog
helps to generate profits in other areas of the business. When I was
in the liquor business, for example, we didn’t make any money on
the in-flight sale of liquor on airplanes. Yet all the liquor companies
were scrambling to get their brands served on planes because it was
a great way to advertise to a captive audience. Occasionally such a
loss maker may produce genuine benefits that make it worth retain-
ing. But beware of this slippery slope: It can be very seductive to in-
vent reasons to maintain unhealthy businesses.)
Again, the great value of this exercise is the focus it helps to
create. Time after time I’ve seen companies’ performance improve
when they have the courage to ruthlessly clean out the attic and
concentrate all their resources on those few things that are truly
important.
The Firm’s Own Realities 95
Industry Dynamics
The guiding questions I recommend in this category are:
▼ Which trends in our industry and in the new economy are the
most important in shaping our destiny? How will they change
the rules of success?
▼ What are we currently doing to exploit these developments
so that they produce greater value for our customers?
▼ What barriers must we overcome to take the lead in prof-
itably exploiting these trends? What are the top priorities?
The insurance industry is one that is undergoing radical
change in the new economy, but many traditional insurers have
been slow to respond. In the meantime, they are facing new com-
petitors every day.
Death by Boiling Threatens the Insurance Industry
“A slow death” is the fate of the traditional insurance industry, accord-
ing to someone who should know—William H. Donaldson, former
chairman of Aetna, America’s leading insurer.
For years, insurance companies in the United States were pro-
tected from open market competition by Depression-era laws that
barred other financial institutions from entering their business. They
made money by insuring large, industrial-era businesses with signifi-
cant bricks-and-mortar assets. Most of these insurance carriers dis-
tributed their products through a single channel—either through a
direct sales force or through a network of independent agents and bro-
kers. That all began to change in the 1990s, however, with the onset of
deregulation, e-commerce, and other shifts.
In response to the new economy, many companies in the conserv-
ative insurance industry turned inward and chose to make incremental
rather than innovative changes. “Our customers will never buy policies
over the Internet,” they said. “Commercial insurance is too complex to
be sold online.” “What do bankers know about insurance?!” As it turns
96 WINNING THE BATTLE FOR INSIGHT
TEAMFLY
Team-Fly
®
out, plenty of companies are using the Internet to purchase insurance;
commercial insurance is available online; and bankers have jumped
into the insurance game.
While the big banks like Chase Manhattan and other new players
reinvent the game of selling insurance—and grab market share while
they are at it—insurance companies are beginning to understand that
they are in danger of becoming boiled frogs. Some of them are trying
to jump; Metropolitan Life, for example, has announced it will counter-
attack by entering the already crowded full-service banking field. The
insurance industry’s traditional business model is in danger of becom-
ing obsolete. Now insurers must create a bold, fresh approach.
For many companies, e-commerce is simply too big a question to
get a firm grip on. Yet the Internet is now a mainstream phenome-
non, not a separate business. A useful way to analyze its business
significance is to consider it in terms of the River of Business, as
shown in Figure 5.4. In this depiction, your company lies midstream.
Your suppliers are upstream, and your customers are downstream.
Products and services flow from upstream to downstream, and your
challenge is to extract the maximum value from this flow.
The usefulness of this diagram lies in its power to help you disag-
gregate the various roles the Internet can play in your business. For
some companies, the primary value of the Internet lies upstream—in
the relationship between the firm and its suppliers. These companies
Industry Dynamics 97
Suppliers
Company
Customers
Upstream
Midstream
Downstream
Throughstream
Figure 5.4 The River of Business
will use the Internet to manage their procurement processes more ef-
ficiently, thus reducing costs and perhaps creating tightly controlled
just-in-time inventory systems that minimize the amount of capital
that is tied up in parts and materials.
Other companies will concentrate on the midstream, creating
better internal efficiencies—for example, in manufacturing, ware-
housing, distribution, and invoicing.
For still other companies, the downstream area is most critical.
These companies will focus on using the Internet to improve their
methods of finding, selling to, and servicing customers. They may
concentrate on creating user-friendly web sites where their prod-
ucts can be ordered, or on developing databases of frequently asked
questions that will enable customers to quickly and easily resolve
most product-use problems without having to speak with a com-
pany representative.
Rather than trying to tackle the big question of the Internet as a
whole, companies have found it helpful to use the River of Business
to break the problem into its component parts and examine each one
separately. Which area of the river is most critical to your own eco-
nomics? Where are the greatest opportunities for new efficiencies
concentrated? Where do bottlenecks currently exist that the Internet
may help to unclog? The answers to questions like these will help you
decide where best to focus your company’s Internet initiatives.
Of course, the ultimate advantage is to use the Internet to create
a superefficient throughstream covering the entire supply chain.
However, it is impractical to achieve this in one fell swoop. It is
therefore necessary to tackle the challenge in coordinated stages.
The key point is that you should aim to have an explicit e-
commerce strategy, one that describes not only how you will par-
ticipate in the game, but also how you will take the lead.
At GE, for example, former Chairman Jack Welch was con-
cerned that his business units were not aggressively preparing them-
selves for a future built on the Internet. He asked the executives in
charge to create what he called “Destroyyourbusiness.com”—a se-
ries of new ways of doing business over the Internet that would chal-
lenge GE’s existing business models. The executives might have
98 WINNING THE BATTLE FOR INSIGHT
snickered (GE, after all, dominates many categories), but they com-
pleted their assignment.
Then Welch startled his executives by telling them to actually
implement those strategies. After all, he reasoned, if GE didn’t do
so, someone else surely would. As a result, GE is one of the lead-
ers among Fortune 500 companies in moving from traditional to
Internet-enabled business models.
The Broader Environment
As mentioned in Chapter 3, there’s an entire branch of modern sci-
ence known as complexity theory, which focuses on the seemingly
random, discontinuous, and disproportionate nature of change. One
of the emblematic metaphors used by the complexity theorists to il-
lustrate the unpredictability of interactions within any complex sys-
tem is the idea that, given enough time and just the right conditions,
a single flap of a butterfly’s wings in Peru could eventually produce
a cyclone in Japan. Whether or not this is literally true, it’s certainly
the case that subtle shifts in the broader environment can have an
unexpected impact on a business. These days, hardly any industry
is immune from the large-scale changes taking place in society.
Thus, executives need to focus on a wide array of environmental in-
dicators, launching the discussion by asking:
What is happening around us that will impact our business in re-
gard to the following factors?
▼ Economic trends.
▼ Social habits and attitudes.
▼ Globalization.
▼ Technology.
▼ Demographics.
▼ Government policies.
For example, under the heading of social habits and attitudes,
consider the trend toward casual dress in business.
The Broader Environment 99